
Abstract
Different CuSi composite nanorods with 0–100 at.% Cu were fabricated by an oblique angle co-deposition technique. The effects of increasing Cu during deposition on the morphologies, structures and properties were investigated. During co-evaporation, the addition of Cu decreases the nanorod width and height but increases the nanorod tilting angle. The polarized optical transmission spectra reveal that all the nanorod samples show a remarkable anisotropic response to visible light with an eccentricity e ≈ 1, whereas their optical response to NIR light depends strongly on the Cu composition, and the related eccentricity increases monotonically with the increase of Cu. The obtained amorphous Si film has a resistivity of approximately 4.9 × 10⁴ Ω cm. The incorporation of 5–75 at.% Cu increases the electrical conductance from two to eight orders of magnitude. The improved conductance and the unique optical properties of the Si-based nanocomposites could have potential applications for Li-ion battery anode and optical design.
Export citation and abstract BibTeX RIS
1. Introduction
Nanocomposites that are composed of more than one component have been a subject of interest in the materials research community due to their improved physical and chemical performances, as compared to the corresponding single component nanostructures [1–7]. These nanocomposites offer a wealth of promising applications in various scientific and commercial fields. For example, metal or semiconductor nanoparticles embedded in dielectric or polymer materials show distinct optical properties for potential applications in optics, optoelectronics, optical coating for solar energy collection and conversion, sensing and bioengineering [1, 2]; transition metal catalysts improve the hydrogen storage thermodynamics and kinetics of metal (like Mg) hydrides for applications in developing solid state hydrogen storage devices [3, 4]; the incorporation of conductive metal Cu or C in Si nanostructures for rechargeable Li-ion battery anodes improves battery performance [5–7]; etc. Intense efforts have been made to develop various methods for fabricating novel nanocomposites, mainly via chemical and physical routes, including sol–gel [8], ball milling [4], ion implantation [9], ultrasound radiation [10], electrodeposition [11], chemical vapor deposition [12], physical vapor co-deposition [13] and hybrid growth techniques [1]. The predominating morphologies of the nanocomposites obtained using these methods are in the form of powders or films.
It is well known that the properties of materials at the nanoscale regime are strongly influenced by their shape and dimensional constraints. In particular, one-dimensional (1D) composite nanostructures have found many potential applications in renewable energy [14], photocatalysis [15], gas sensors [15], nanoelectronics [16], spintronics [17] and nanophotonics [18]. Some existing 1D nanostructure fabrication methods can be modified to produce composite nanoarrays. For example, Yu and co-workers prepared uniform WO3 nanorod/graphene composites through a one-step hydrothermal method and systematically explored their applications in high-efficiency visible-light-driven photocatalysis and NO2 gas sensing. The results revealed that the visible light photocatalytic performance and the gas sensing property of WO3 nanorods had been improved by up to 2.2 and 25 times, respectively, due to the existence of graphene in the composites which facilitated the electron transfer, light absorption, and electrical conductivity [15]; Liu et al synthesized aligned 1D diluted magnetic semiconductor (DMS) Zn1−xMnxO nanorod arrays through a reaction of metallic Zn foil and MnCl2⋅6H2O under oxygen environment at varying temperatures between 750 and 950 °C by a chemical vapor deposition method. At 950 °C, strong room-temperature ferromagnetism was observed in the nanorod arrays, which could be due to more substitution of Mn2+ in ZnO nanostructures at high temperatures. The as-grown aligned room-temperature DMS nanorods have great potential in spintronic nanodevice applications [17]; Wang et al fabricated Ni–P nanorod arrays with a series of aspect ratios in the pores of anodic aluminum oxide (AAO) membranes by electrochemical deposition, and the aspect ratio of the composite nanorods was controlled by the deposition time. The optical study showed that, with increase of the nanorod aspect ratio, the optical absorbance decreases in the ultraviolet region but increases in the visible region, whereas the photoluminescence decreases. These demonstrations reveal the potential applications of Ni–P/AAO nanoarray composite structures in nanophotonics [18]. Although some exciting progress has been made in fabricating composite nanostructure arrays, none of the synthetic techniques can produce arrays of nanocomposites with arbitrarily tailored morphologies, structures and compositions.
Using the well developed glancing angle co-deposition (GLACD) or oblique angle co-deposition technique (OACD) in a unique two-source electron beam evaporation system, we have demonstrated that not only the morphology but also the composition of nanorod arrays can be precisely programmed by a computer during the nanorod growth process [19–22]. OACD is a technique that combines the use of co-deposition and oblique angle deposition (OAD). The co-deposition enables the vaporization of two materials to occur simultaneously, allowing the exact composition of the fabricated nanorod array to be dictated by their relative deposition rates [19]. The self-shadowing effect in an OAD process causes the formation of a well-aligned nanorod array structure [21–23]. In this work, well-aligned CuSi composite nanorods with different Cu to Si ratios have been systematically designed and fabricated by OACD. The changes in the morphology, composition, structure, electrical and optical properties induced by the increase of Cu during co-deposition have been investigated by scanning electron microscopy (SEM), energy dispersive x-ray spectroscopy (EDX), x-ray diffraction (XRD), four-point-probe electrical measurement and (polarized) optical transmission characterization.
2. Experimental details
The CuSi composite nanorods were fabricated by a custom designed evaporation system with two electron beam sources (Pascal Technology) described elsewhere. Two separate quartz crystal microbalances (QCMs) were used to monitor the deposition rates, rCu and rSi, and thicknesses,  and
and  , of Cu (99.9%, Alfa Aesar) and Si (99.9999%, Alfa Aesar) independently, in the near-normal direction of the substrates. Two kinds of substrate were used: glass microscope slides (Gold Seal® Catalog No. 3010) for optical, electrical and x-ray diffraction (XRD) characterization; Si(100) wafers for scanning electron microscopy (SEM) observation. Before sample preparation, the chamber was evacuated to a base pressure of 10−6 Torr. During deposition, the pressure varied from 10−5 to 10−6 Torr. To fabricate composite nanorod arrays, the substrates were tilted at α = 88° with respect to the incident Cu and Si vapor flux; to obtain composite films as controls, during the same deposition, additional pieces of substrate were installed directly below the tilted substrates to receive the evaporated Cu and Si atoms in the near-normal direction, i.e., α ≈ 0°. A total of seven different kinds of nanostructured sample, each having a different Cu/Si ratio, were fabricated by OAD or OACD. The nominal atomic ratio of Cu to (Cu+Si) or Cu atomic concentration,
  , in each sample is determined and controlled by the deposition rate ratio rCu/rSi according to the relationship
  , where ρ is the bulk density and M is the molar mass of the corresponding materials. In the experiment, the nanorod arrays were grown until the thickness sum of the two QCMs monitoring Cu and Si reached 2.5 μm, i.e.,
  . The detailed deposition parameters, such as the deposition rates rCu and rSi, final thickness readings
  and
and  , and nominal Cu atomic concentration
  , are summarized in table 1. The expected Cu atomic concentrations were as follows:
  , 5, 15, 25, 50, 75 and 100 at.%, and these samples are denoted as Cu0, Cu5, Cu15, Cu25, Cu50, Cu75 and Cu100, respectively.
Table 1. The detailed deposition parameters to control the compositions for all the CuSi samples.
| Sample |
 (at.%) (at.%) |
rCu (nm s −1) | rSi (nm s −1) |
 (μm) (μm) |
 (μm ) (μm ) |
 (μm ) (μm ) |
|---|---|---|---|---|---|---|
| Cu0 | 0 | 0 | 0.5 | 0 | 2.5 | 2.5 |
| Cu5 | 5 | 0.016 | 0.5 | 0.08 | 2.42 | 2.5 |
| Cu15 | 15 | 0.054 | 0.5 | 0.24 | 2.26 | 2.5 |
| Cu25 | 25 | 0.1 | 0.5 | 0.42 | 2.08 | 2.5 |
| Cu50 | 50 | 0.31 | 0.5 | 0.95 | 1.55 | 2.5 |
| Cu75 | 75 | 0.5 | 0.27 | 1.62 | 0.88 | 2.5 |
| Cu100 | 100 | 0.5 | 0 | 2.5 | 0 | 2.5 |
For all samples, the morphology, composition and crystal structure were characterized by a field-emission scanning electron microscope (SEM, FEI Inspect F) integrated with an energy dispersive x-ray spectrometer (EDX) and a grazing angle x-ray diffractometer (XRD, PANalytical X'Pert PRO MRD) using Cu Kα radiation with an x-ray incident angle of 0.5°. The sheet resistances of the films were determined using a custom designed four-point-probe resistance measurement device. In this setup, a Keithley 2635A SourceMeter was used to supply a constant current and a Keithley 2000 Multimeter was used to perform the voltage measurements. The optical properties of the nanorod samples were studied by a UV–vis–NIR double beam spectrophotometer (JASCO V-570). To obtain polarized transmission spectra, two rotatable Glan Thompson polarizers (Thorlabs Inc.) were placed in the paths of the incident light beams.
3. Results and discussion
3.1. Morphology, composition and structure evolution
Figure 1 shows top view (in the left column) and cross-sectional view (in the right column) SEM images of the CuSi samples fabricated by OAD or OACD. The SEM images reveal that all the samples consist of arrays of aligned and tilted nanorod structures with different dimensions, densities/separations and tilting angles. The inset in each top-view image shows a two-dimensional power spectrum obtained from the same sample surface. These power spectra are basically composed of four elongated spots. Along and perpendicular to the vapor incident direction the spots have separations of 2k∥ and 2k⊥ by which the average separations between nanorods can be determined according to Δ∥ = 1/k∥ and Δ⊥ = 1/k⊥ in these two different directions, respectively. The obtained results are summarized in table 2. The Cu atomic concentration in each composite sample measured by EDX, CCu, is also listed in table 2. The measured CCu values are close to the nominal  values estimated from the deposition rate ratios with no more than 10% deviation. To quantitatively analyze how the morphology of the OAD Si nanorod array evolves with the addition of Cu through co-evaporation, we measured the average nanorod width w from the top-view images and the nanorod thickness δ, height h and tilting angle β from the cross-view images. All these structural parameters are illustrated in figure 1(a). To clarify the morphology evolution with the Cu amount in the nanorods, all the structural parameters, w, δ, h, β, Δ∥ and Δ⊥ as functions of the Cu atomic concentration are plotted in figure 2.

Figure 1. Top view (in the left column) and cross-sectional view (in the right column) SEM images of different CuSi nanorod arrays: (a) Cu0; (b) Cu5; (c) Cu15; (d) Cu25; (e) Cu50; (f) Cu75; (g) Cu100. The inset in each top-view image shows a two-dimensional power spectrum with a size of 10 μm−1 × 15 μm−1 obtained from the same sample surface. The sketch for polarized transmission measurement is illustrated in (g).
Download figure:
Standard image
Figure 2. The Cu concentration dependence of the structural parameters, nanorod width w, thickness δ, height h and tilting angle β in (a), and nanorod separations Δ∥ and Δ⊥ in (b).
Download figure:
Standard imageTable 2. The structural parameters of different CuSi nanorod arrays.
| Sample | CCu (at.%) | fCu (vol%) | w (nm) | δ (nm) | h (μm ) | β (deg) | Δ∥ = 1/k∥ (μm ) | Δ⊥ = 1/k⊥ (μm ) |
|---|---|---|---|---|---|---|---|---|
| Cu0 | 0 | 0 | 400 ± 200 | 90 ± 20 | 1.68 ± 0.06 | 51 ± 4 | 1.0 ± 0.6 | 0.6 ± 0.4 |
| Cu5 | 5 ± 1 | 3.2 | 500 ± 200 | 70 ± 20 | 1.72 ± 0.06 | 51 ± 3 | 1.2 ± 0.9 | 0.6 ± 0.5 |
| Cu15 | 14 ± 1 | 9.6 | 500 ± 300 | 70 ± 10 | 1.50 ± 0.02 | 50 ± 3 | 1.2 ± 0.9 | 0.7 ± 0.5 |
| Cu25 | 22 ± 1 | 16.8 | 400 ± 200 | 70 ± 10 | 1.50 ± 0.02 | 50 ± 6 | 0.9 ± 0.7 | 0.5 ± 0.4 |
| Cu50 | 45 ± 2 | 38 | 270 ± 90 | 70 ± 10 | 1.42 ± 0.03 | 52 ± 3 | 0.8 ± 0.7 | 0.5 ± 0.4 |
| Cu75 | 70 ± 3 | 64.8 | 230 ± 60 | 70 ± 10 | 0.88 ± 0.03 | 60 ± 3 | 0.8 ± 0.7 | 0.4 ± 0.3 |
| Cu100 | 100 | 100 | 80 ± 40 | 40 ± 10 | 0.49 ± 0.01 | 76 ± 1 | 0.6 ± 0.5 | 0.1 ± 0.1 |
By combining figures 1 and 2 and table 2, one can capture the detailed morphology evolutions. When a small amount of Cu (≤15 at.%) is co-deposited with Si, the obtained nanorods with widths of wCu0 = 400 ± 200 nm, wCu5 = 500 ± 200 nm and wCu15 = 500 ± 300 nm have similar widths statistically, considering their significant uncertainty; however, further increasing the amount of Cu causes the nanorod width to decrease gradually from wCu25 = 400 ± 200 nm until the narrowest width of wCu100 = 80 ± 40 nm. The incorporation of Cu decreases the nanorod thickness δ from δCu0 = 90 nm to δCu5 ≈ 70 nm initially, but the δ is not sensitive to CCu amount and remains almost constant at 70 nm, which is thicker than that of the pure Cu nanorods with δCu100 ≈ 40 nm. Both the w and δ curves with the nanorod width w being larger than the thickness δ indicate that the OAD nanorods fan out visibly along the direction perpendicular to the incident vapor direction during growth, due to the lack of atomic shadowing in this direction [24, 25]. This makes the gap between nanorods in this fan-out direction smaller than that in the perpendicular direction, which is consistent with the results obtained from the power spectra, i.e., the separations in the direction perpendicular to the vapor flux Δ⊥ are always smaller than those in the direction parallel to the vapor flux Δ∥, as shown in figure 2(b). From figure 2(b), it can also be seen that the addition of a small amount of Cu, ≤ 25 at.%, causes a slight increase in both the separations Δ∥ and Δ⊥; however, both Δ∥ and Δ⊥ decrease gradually with further increasing Cu concentration. The cross-sectional view images show that nanorod height h decreases gradually from pure Si to pure Cu nanorods with increasing Cu amount in the CuSi composites; however, the tilting angle β of the nanorods with respect to the substrate normal decreases from βCu0 ≈ βCu5 ≈ 51° to βCu15 ≈ βCu25 ≈ 50°, and then increases gradually with increasing Cu amount from βCu50 ≈ 52° to βCu75 ≈ 60° until βCu100 ≈ 76°.
With the incident flux angles for both Cu and Si fixed at α = 88°, the tangent rule, tanβt = 1/2tanα [26], predicts βt ≈ 86°, while the cosine rule, βc = α − arcsin[(1 − cosα)/2] [27], gives βc ≈ 59°. Clearly, such a change of the tilting angle β with the Cu and Si composition obtained in the present experiment demonstrates that the 'universal' model, the tangent rule or the cosine rule, is not suitable to describe the tilting angle of composite nanorods formed by OACD. By considering the stacking of the two atoms during deposition, the self-shadowing effect and other atomistic effects on the surface, we have proposed a semi-empirical statistic model. The details have been described elsewhere [28]. Based on the proposed model, the tilting angle of the CuSi composite nanorods can be expressed as

The solid β–CCu curve in figure 2(a) shows the result from the above equation with the symbols corresponding to the experimental data. This equation clearly fits the experimental results very well. Equation (1) demonstrates that the tilting angle of composite nanorods during OACD does depend on the nanorod composition. It is also a function of the deposition angle, deposition temperature, etc [28].
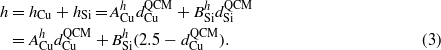
For nanorod height h, one can assume
where ACu and BSi are proportional coefficients for Cu and Si [29]. In the experiment, since  is fixed, the nanorod height h can be expressed as
According to  * (ρSiMCu/ρCuMSi) and
  , one can obtain

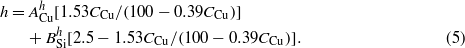
By combining equations (3) and (4), one can derive the relationship between h and CCu,
In addition, both the nanorod width w and the nanorod thickness δ should depend on the surface diffusion and fan-out effect [25, 30], and we can assume
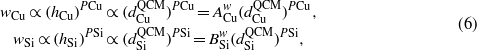
where PCu and PSi are the fan-out exponents for Cu and Si, respectively. Then,
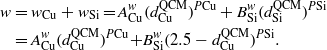
Based on the work by Karabacak et al [31], PCu ≈ 0.3 and PSi ≈ 0.32, one has
Similarly, one can obtain the relationship between δ and CCu,

Using the relationships of h–CCu (equation (5)), w–CCu (equation (7)), and δ–CCu (equation (8)) to fit the corresponding experimental data in figure 2(a), as shown by the solid curves, the fitting parameters ACu and BSi are obtained and summarized in table 3. For all three relationships, the obtained ACu value is always smaller than that of BSi, which implies that, for the same concentration of Cu and Si, the Cu will make a smaller contribution than the Si to the nanorod height h and fan-out effect (smaller w and δ) during co-deposition.
Table 3. The fitting parameters ACu and BSi obtained from the relationships of h, w and δ versus CCu.
| Relationship | ACu | BSi |
|---|---|---|
| h–CCu | 0.20 ± 0.03 | 0.68 ± 0.02 |
| w–CCu | 0.005 ± 0.005 | 0.31 ± 0.04 |
| δ–CCu | 0.019 ± 0.008 | 0.049 ± 0.006 |
Figure 3 shows the crystal structure evolution of CuSi nanorods with the addition of Cu. When grown at room temperature by electron beam evaporation, the resultant Cu nanostructure is a face-centered-cubic (fcc) polycrystalline phase, as shown by XRD in figure 3(a), where the diffraction peaks can be indexed to Cu (111) at 2θ ≈ 43.44°, Cu(200) at 2θ ≈ 50.56° and Cu(220) at 2θ ≈ 74.26°; however, the deposited Si nanostructure is amorphous due to the absence of Si crystalline peaks in its XRD pattern (figure 3(b)). The incorporation of 5 at.% Cu does not make any difference to the XRD pattern (figure 3(c)) compared to that of pure Si (figure 3(b)). When 15 at.% Cu is added, an extremely weak and wide peak centered at 2θ ≈ 44.8° is detected in figure 3(d). In addition, another peak at 2θ ≈ 36.4° starts to appear at CCu = 25 at.% (figure 3(e)). These two XRD peaks become stronger and stronger on increasing the Cu amount to 50 at.% (figure 3(f)) and 75 at.% (figure 3(g)), while they both disappear in the pure Cu sample (figure 3(a)). This implies that, during co-deposition, another phase other than Cu and Si could form, which is orthorhombic Cu3Si. The peak at 2θ ≈ 44.8 could come from the Cu3Si(300) diffraction, possibly overlapped with the Cu3Si(012) diffraction since their standard diffraction peaks are very close, Cu3Si(012) at 2θ = 44.57° and Cu3Si(300) at 2θ = 44.99°, and the peak at 2θ ≈ 36.4° can be well indexed to Cu3Si(201). As seen from the XRD pattern in figure 3(g), a small amount of polycrystalline Cu can also be detected besides the polycrystalline Cu3Si phase in Cu75. All the diffraction peaks in the CuSi composite samples are very wide and weak, indicating that their degrees of crystallinity are low. By applying the Scherrer formula [32] to those well-separated peaks such as Cu(220) and Cu3Si(201) in Cu75, the average crystal sizes are estimated to be DCu ≈ 6 nm and DCu3Si ≈ 10 nm in diameter; using the strongest Cu (111) peak in Cu100, the Cu crystal size in pure Cu nanorods is DCu ≈ 17 nm. For all the other CuSi samples, the size of polycrystals could be less than 1 nm. Note that it is hard to exclude the following two possibilities: (1) amorphous Cu3Si could form in Cu5; (2) the unreacted Cu could remain in the form of amorphous phase in the co-deposited composite nanorod samples. As a result, the crystal structure of the nanorods evolves from the amorphous Si in Cu0, to the mixture of amorphous Si, Cu and Cu3Si in Cu5, to the mixture of polycrystalline Cu3Si as well as amorphous Si and Cu in Cu15, Cu25 and Cu50, to the polycrystalline Cu3Si of DCu3Si ≈ 10 nm and Cu of DCu ≈ 6 nm embedding in the amorphous Si matrix in Cu75, and then to the polycrystalline Cu of DCu ≈ 17 nm in Cu100.

Figure 3. The XRD patterns of various CuSi nanorod arrays.
Download figure:
Standard image3.2. Electrical properties
Since both the CuSi nanorod and film samples for each composition were fabricated in the same deposition, they have similar composition and crystal structure. To simplify the electrical transport characterization on the CuSi nanorod arrays, in the experiment, we measured the sheet resistances R□ of the corresponding CuSi films at room temperature and thus estimated their inherent resistivity ρ values according to the relationship ρ =R□×t, where t is the film thickness. This is based on the consideration that the individual Si-based nanorods could have comparable composition-dependent electrical properties to those of the corresponding films. Figure 4 shows the obtained ρ–CCu relationship for the CuSi composite films, as indicated by circle symbols. The amorphous Si film has a resistivity ρCu0 ≈ 4.9 × 10⁴ Ω cm , which is of the same order as that of the bulk Si, ρbulk Si = 6.4 × 10⁴ Ω cm [33]. When only 5 at.% Cu is co-evaporated with Si, the conductance of the formed composite Cu5 is significantly increased by two orders of magnitude, with a lower resistivity of ρCu5 ≈ 2.9 × 10² Ω cm. With further increasing the Cu amount, the conductance is improved gradually from ρCu15 ≈ 1.8 Ω cm, to ρCu25 ≈ 1.4 × 10⁻¹ Ω cm, to ρCu50 ≈ 3.6 × 10⁻³ Ω cm and to ρCu75 ≈ 1.1× 10⁻⁴ Ω cm; these values represent four, five, seven and eight orders of magnitude increase in conductance, respectively, compared to the pure Si film. Such electrical conductance enhancement in Si is due to the incorporation of conductive metal Cu with ρbulk Cu = 1.68 × 10⁻⁶ Ω cm [34] and/or Cu3Si with ρbulk Cu3Si = 5.5 × 10⁻⁵ Ω cm [35], as confirmed by XRD in figure 3.

Figure 4. The resistivity ρ versus Cu concentration CCu for the corresponding CuSi film samples together with the calculated results according to both the Maxwell-Garnett and the Bruggeman models.
Download figure:
Standard imageFor the CuSi composite films consisting of conductive metal Cu and/or Cu3Si clusters/nanoparticles embedded in amorphous Si matrix, two classic effective medium theory models, the Maxwell-Garnett model [36] and the Bruggeman model [37], have been used to describe their conductivities. Regarding such a dispersed system where spherical shaped metal nanoparticles with a small volume fraction of fi are uniformly dispersed in a dielectric matrix and the interaction among these metal nanoparticles can be neglected, one can obtain the effective conductivity σe of the composite system by the Maxwell-Garnett formula [36]

Here, σm and σi are the conductivities of the host matrix (Si) and the incorporated metal nanoparticles (Cu and/or Cu3Si), respectively. With increase of the metal volume fraction fi, strong interaction among the metal nanoparticles appears, and thus the effective conductivity can be well described by the Bruggeman formula [37]

For the CuSi composite films with different CCu, for simplicity, we assume that only Cu3Si nanoparticles are dispersed in the amorphous Si matrix, considering that Cu3Si is the dominant metal phase compared to Cu even in Cu75, as revealed by XRD in figure 3. Thus, σi = 1/ρbulk Cu3Si = 1.82 × 10⁴ S cm−1 and σm = 1/ρCu0 = 2.04 × 10⁻⁵ S cm−1. The metal volume fraction fi values for different CuSi samples are estimated according to  vol%, assuming that all the co-deposited Cu exists in the form of Cu3Si, and the data are summarized in table 2. Based on equations (9) and (10), the calculated results are also plotted in figure 4, as shown by the square symbols for the Maxwell-Garnett model and the triangle symbols for the Bruggeman model, respectively. Clearly, it can be seen that at high CCu such as Cu50 and Cu75, the Bruggeman theory predicts the experimental results quite well; however, at low CCu ranging from Cu5 to Cu25, there are big differences between the calculated resistivity values and the experimental results. This implies that these two models fail to describe the electrical properties of the present CuSi film system in such a small metal fraction region. Such failure could indicate that the CuSi composite film system containing Cu of 5–25 at.% or 3.2–16.8 vol% is close to its percolation threshold [38]. In other words, electrical change of the CuSi films from insulator/semiconductor to conductor with the increase of Cu could occur in this range.
3.3. Optical properties
Silicon is the most common semiconductor material with a narrow band gap of  eV (or wavelength λ = 1117 nm). The band gap characteristic of Si determines that it is opaque at visible wavelengths but partially transparent in the near-infrared (NIR) range [39], which is caused by its strong visible interband absorption and relatively weak NIR free carrier absorption [40]. In addition, the optical properties of Si are subject to modification by doping/embedding other compositions, such as Cu clusters or nanoparticles, as well as the amount of the dopant. Moreover, the structures of materials determine their properties. An anisotropic nanostructure could induce anisotropic physical properties [19]. For the CuSi composite nanoarrays with different Cu concentrations obtained by OACD, polarized optical transmission spectra were measured in the range of 300–2000 nm using linear polarized incident light normal to the substrate surface. When the incident electric field E is in the nanorod tilting plane, i.e., φ = 0°, the polarization is defined as p-polarization. We define s-polarization as the E direction where φ = 90°, as illustrated in figure 1(g).
Figures 5(a) and (b) show the transmission spectra in two polarization directions, p-polarization (φ = 0°) and s-polarization (φ = 90°), for each CuSi nanorod sample, respectively. Since Si has different absorption mechanisms in different wavelength ranges, we will discuss the optical properties of the CuSi nanorods correspondingly. In the NIR free carrier absorption region with photon energy  (λ > 1117 nm), the addition of metal Cu and/or Cu3Si will increase the free carrier concentration, which will cause an increase in the optical absorbance of the Si matrix. As a result, the Si nanorod array (Cu0) has the highest NIR optical transmission to both p- (figure 5(a)) and s- (figure 5(b)) polarized light, and the transmission also decreases with the addition of Cu. However, the interband absorption of Si in the photon energy range of
  (λ < 1117 nm) is a complex process and strongly depends on the defects produced in the Si nanorods. Therefore, there is not a monotonic Cu concentration-dependent optical transmission relationship in this region, as shown in figures 5(a) and (b).

Figure 5. The typical polarized optical transmission spectra in the wavelength range of 300–2000 nm, for p-polarization at φ = 0° (a) and s-polarization at φ = 90° (b), for different CuSi nanorod arrays; (c) the p- and s-polarized optical transmission T at λ = 500 nm,  and
and  , and at λ = 1500 nm,
  and
and  , as functions of CCu; the incident light polarization angle dependent optical transmission T at λ = 500 nm, T500 − φ, in (d), and at λ = 1500 nm, T1500 − φ, in (e); (f) the obtained eccentricity e (
 ) versus CCu for both λ = 500 and 1500 nm.
Download figure:
Standard imageIn order to gain further insight into the effect of adding Cu on the optical properties of Si nanorods, we choose two typical wavelengths, one is visible at λ = 500 nm which is above  and the other is NIR at λ = 1500 nm which is below
  , to investigate the optical behaviors of the CuSi samples. Figure 5(c) plots the p- and s-polarized optical transmission T at λ = 500 nm,
  and
and  , and at λ = 1500 nm,
  and
and  , as functions of the Cu concentration CCu. Clearly, the
  and
and  are small, 0% < T500 < 20%, for all the CuSi samples, and they only depend weakly on CCu. Although the T500 tends to decrease with increasing CCu, some exceptions exist. For example, the
  of Cu5 is higher than that of Cu0, which could be related to the defect effect as mentioned above. While the T1500 depends strongly on CCu, for pure Si or Cu0, T1500 ≈ 100%, with increasing CCu, the T1500 decreases significantly and monotonically until T1500 ≈ 0% of Cu75. In addition, one can see that the s-polarized transmission is always stronger than the p-polarized transmission,
  and
and  in figure 5(c). In other words, the absorbance in the s-direction is always smaller than that in the p-direction, which is due to the size and alignment of the nanorods resulting in the nanorod width projected in the s-direction being smaller than the nanorod length projected in the p-direction [19, 41].
To demonstrate the polarization and Cu concentration dependence of the optical properties of the anisotropic CuSi nanorod arrays, angular-dependent polarized optical transmissions at λ = 500 nm (T500) and λ = 1500 nm (T1500) were recorded by rotating the polarizers every 15° from the p-polarization direction for all the CuSi samples with different CCu, as plotted in polar plots in figures 5(d) and (e), respectively. For all the obtained curves except the T1500 of Cu0, the angular-dependent transmission curves have two-fold symmetry, indicating optical anisotropy. The maximum and minimum transmission values occur approximately in the directions of s-polarization and p-polarization, respectively, while for the T1500 of Cu0, the obtained angular-dependent transmission curve looks like a circle, indicating an optical isotropy behavior. In addition, at λ = 500 nm, the total trend is that the transmission intensity decreases with the incorporation of more and more Cu, but the Cu0 is much less transparent than the Cu5 in the polarized angular range other than near the p-polarization direction (figure 5(d)), while at λ = 1500 nm, the transmission decreases gradually with increasing CCu (figure 5(e)).
To correlate quantitatively the Cu concentrations and optical anisotropic properties of CuSi composite nanorods in different wavelength regions, we fitted all the transmission T–φ curves at λ = 500 and 1500 nm with the equation Tλ(φ) = Tλ + ΔTλsin2(φ − Δφ). Here Δφ denotes the angular deviation of the symmetry axes from φ = 90°,  is the p-polarized transmission, and
  is the s-polarized transmission. The obtained optical parameters are summarized in table 4. Basically, |Δφ| < 10°, and the small angle deviation could be caused by experiment alignment error in marking the growth direction of the nanorods and/or the polarization directions of the polarizers. To characterize the discrepancy in the degree of anisotropy, we use a parameter called the eccentricity e, which is defined as
  . Here e = 0 means optical isotropy. The larger the e value, the higher the anisotropy. According to the e values listed in table 4 and the plot of e–CCu in figure 5(f), one can see that the CuSi nanorods exhibit different optical anisotropic behaviors in different wavelength regions. Specifically, at λ = 500 nm, the e values in all the CuSi samples are very high, e ≈ 1, indicating their remarkable anisotropic responses to visible light, while at λ = 1500 nm, the e increases exponentially from e ≈ 0 of Cu0, to e ≈ 0.37 of Cu5, to e ≈ 0.70 of Cu15, to e ≈ 0.87 of Cu25 and to e ≈ 1 of Cu50 and Cu75, indicating the significant effect of adding Cu on the anisotropic response to NIR light.
Table 4. The optical parameters obtained by fitting the angular dependent Tλ (λ = 500 and 1500 nm) plots for different CuSi nanorod arrays.
| Sample | λ (nm) | Tλ(φ) = Tλ + ΔTλsin2(φ − Δφ) |
 (nm) (nm) |
 (nm) (nm) |
e | ||
|---|---|---|---|---|---|---|---|
| Tλ (nm) | ΔTλ(nm) | Δφ (deg) | |||||
| Cu0 | 500 | 4.60 ± 0.02 | 8.60 ± 0.04 | 5.0 ± 0.1 | 4.60 | 13.2 | 0.9397 |
| 1500 | 97.9 ± 0.2 | − 0.2 ± 0.4 | 6 ± 3 | 97.9 | 97.7 | ∼0 | |
| Cu5 | 500 | 2.98 ± 0.03 | 14.81 ± 0.05 | 6.3 ± 0.1 | 2.98 | 17.79 | 0.9859 |
| 1500 | 84.5 ± 0.2 | 6.6 ± 0.3 | 4 ± 1 | 84.5 | 91.1 | 0.3737 | |
| Cu15 | 500 | 0.79 ± 0.01 | 6.81 ± 0.02 | 5.6 ± 0.1 | 0.79 | 7.60 | 0.9946 |
| 1500 | 52.8 ± 0.2 | 21.7 ± 0.3 | 4.7 ± 0.4 | 52.8 | 74.5 | 0.7055 | |
| Cu25 | 500 | 0.39 ± 0.01 | 4.56 ± 0.02 | 6.5 ± 0.1 | 0.39 | 4.95 | 0.9969 |
| 1500 | 30.1 ± 0.2 | 31.1 ± 0.3 | 7.7 ± 0.3 | 30.1 | 61.2 | 0.8707 | |
| Cu50 | 500 | 1.62 ± 0.02 | 4.31 ± 0.04 | 0.8 ± 0.3 | 1.62 | 5.93 | 0.9620 |
| 1500 | 4.4 ± 0.2 | 31.2 ± 0.3 | 5.0 ± 0.3 | 4.4 | 35.6 | 0.9923 | |
| Cu75 | 500 | 0.062 ± 0.002 | 0.128 ± 0.003 | − 0.4 ± 0.7 | 0.062 | 0.19 | 0.9453 |
| 1500 | 0.12 ± 0.04 | 4.97 ± 0.07 | 8.1 ± 0.4 | 0.12 | 5.09 | 0.9997 | |
4. Conclusions
Various CuSi composite nanorod arrays with CCu ranging from 0 to 100 at.% were fabricated by an oblique angle co-deposition technique in a two-source electron beam deposition system. The effects of increasing Cu amount during deposition on the morphology, structure, optical and electrical properties were investigated. Morphologically, the nanorods fan out in the direction perpendicular to the vapor flux, resulting in a separation of the nanorods in this direction smaller than that along the vapor flux; with the addition of Cu, the nanorod width w and height h decrease but the nanorod tilting angle β increases. The quantitative analysis on the structure parameters, such as the nanorod height h, width w and thickness δ, as functions of CCu reveals that the Si composition makes a larger contribution than the Cu to the nanorod height and fan-out effect (larger w and δ) during co-deposition. X-ray diffraction reveals that the nanorods evolve from amorphous Si in pure Si nanorods, to the formation of polycrystalline Cu3Si in the composite nanorods with low Cu amount, to the appearance of polycrystalline Cu3Si and Cu in the Cu75 nanorods and finally to polycrystalline Cu in pure Cu nanorods. The obtained CuSi nanorods demonstrate different optical anisotropic behaviors in different wavelength regions: all the nanorod samples show remarkable anisotropic response to visible light with the eccentricity e ≈ 1, while their optical response to NIR light depends strongly on CCu and changes from the near isotropic Si nanorods with e ≈ 0, to e ≈ 0.37 of Cu5, to e ≈ 0.70 of Cu15, to e ≈ 0.87 of Cu25 and to the highest anisotropic Cu50 and Cu75 nanorods with e ≈ 1. In addition, the obtained amorphous Si film has a resistivity of ρ ≈ 4.9 × 10⁴ Ω cm. The addition of 5, 15, 25, 50 and 75 at.% Cu gives rise to electrical conductance enhancement of two, four, five, seven and eight orders of magnitude, respectively, which suggests that the Si-based nanocomposites are great candidates for potential use as Li-ion battery anodes. In fact, the cycling performance of the CuSi composite nanorods (with 62 at.% Cu) has been studied recently [6], where we compared the anode performance of five different Si-based nanorod structures, pure Si, multilayer Cu/Si, Cu side-coated Si, uniform CuSi composite and composition-graded CuSi composite nanorods. We found that both the uniform and graded CuSi composite nanostructures exhibited the best cycling performance. The ability to use composition to continuously tune the optical transmission in different wavelength ranges may find applications in optical coating and optical filters. Furthermore, if the compositions in the nanocomposites were selectively etched, porous nanorods could form, which are promising for applications in sensors and catalysts, and as medical capsules that are able to be loaded with functional materials [42].
Acknowledgment
This work was supported by the US Army Research Laboratory with the contract number of W911NF-10-2-0107.