
Abstract
The modification of individual oxygen functional groups and the resultant optical properties of a graphene oxide suspension were investigated using a controlled photothermal reduction by infrared irradiation. The evolution of the structural and optical characteristics of GO suspensions was obtained from Raman spectra, x-ray photoelectron spectroscopy, optical absorption, and steady state and time-resolved photoluminescence spectroscopy. The results suggest the gradual restoration of sp2 clusters within the sp3 matrix with an increase of the reduction time and power density. The yellow-red emission (∼610 nm) originated from the defect-assisted localized states in GO due to epoxy/hydroxyl (C-O/-OH) functional groups and that of the blue emission (∼500 nm) was ascribed to the carbonyl (C=O)-assisted localized electronic states. With an increase in the reduction time and IR power density, the intensity of the yellow-red emission was found to decrease, with the blue emission being prominent. These experimental findings open up a new dimension for controlling the optical absorption and emission properties of graphene oxide by tailoring the oxygen functional groups, which may lead to the potential application of graphene-based optoelectronic devices.
Export citation and abstract BibTeX RIS
1. Introduction
Graphene, an atomically thin 2D sheet of carbon (sp2 hybridized) [1], has attracted enormous interest because of its intriguing properties such as its very high electron mobility (μ ∼ 200 000 cm2 · V−1 · s−1) [2], high thermal conductivity [3], transparency over the broadband wavelength range (∼97.7%) [4] and flexibility [5]. In spite of having all of these exciting properties, it is not attractive for optoelectronic devices since graphene is a zero band gap semiconductor [6]. Much effort has been made to open up the band gap in graphene structures [7, 8]. The synthesis of cost-effective graphene oxide (GO) and reduced graphene oxide (rGO) have attracted great interest due to their compatibility with various substrates and solubility [9], with some interesting applications such as in supercapacitors [10], Li-ion batteries [11] and transparent conducting electrodes [12]. Moreover, their optical properties make them attractive for applications in photodetectors, light-emitting diodes and nonlinear optical devices [13].
As-synthesized GO shows interesting steady state photoluminescence behavior [14], which is very promising for novel optoelectronic applications. Photoluminescence (PL) emissions from GO have been reported that have covered a broadband from 500 and 800 nm (2.48–3.1 eV) [15, 16] and have also covered the blue region centered around 390 to 440 nm (1.55–2.48 eV) [17, 18]. The blueshift [19, 20] and redshift [15] of the fluorescence have been observed from as-synthesized GO to rGO, with a debatable mechanism in their origin. Chien et al [20] attributed the PL origin to disorder-induced states and the newly formed graphitic domains of sp2 clusters during reduction, whereas Luo et al [15] proposed that the bond distortions may contribute to the fluorescence of GO and rGO. On the other hand, Gokus et al [21] reported similar PL characteristics in oxygen-plasma-treated graphene and assigned them to C=O-related localized electronic states of oxidation sites. In spite of all of the above reports, the exact mechanism of the origin of PL in GO for different synthesis and reduction processes, and the role of individual functional groups, are yet to be established.
Here, we report a novel and simple method for the continuous tuning of optical properties of GO by modifying the oxygen functional groups using controlled infrared (IR) irradiation. To the best of our knowledge, we present experimentally for the first time the role of various oxygenated functional groups individually for the tuning of optical properties of GO. Our results show that the tuning of the ratio of the sp2 to sp3 fractions by the gradual reduction of GO is a powerful way to tailor the optical properties.
2. Experimental
2.1. GO preparation
An aqueous solution of graphene oxide was obtained from graphite powders by oxidation, sonication and centrifugation steps using a modified Hummer's method. The details of the synthesis procedure are reported elsewhere [22], in which KMnO4 was used as an oxidizing agent in the presence of H2SO4. H2SO4 also acted as an intercalating agent for the layered graphene oxide. During the centrifugation steps, large unexfoliated graphite particles and small inorganic particles were removed by low speed and high speed centrifugation, respectively. Supernatant GO solutions prepared by 2000 rpm rotation with a precipitation of 8000 rpm were examined by AFM analysis to confirm the monolayer thickness of the graphene oxide sheets.
2.2. IR-induced reduction of GO
The reduction of as-prepared GO was carried out by incubating the solution with the exposure of a 200 W broadband (wavelength: 800–2000 nm) IR source for different period of times in an ambient condition. The average power density of the IR irradiation was adjustable in the range between 0 and 1.77 W cm−2 by changing the distance between the IR source and samples. As-synthesized brown GO suspensions were exposed at three different irradiated power densities. It was observed that at a distance of 5 cm (0.64 W cm−2), the surface of the specimen gradually turned black after being exposed to IR light for several hundreds of minutes, suggesting the occurrence of reduction.
2.3. Physical characterization
The surface morphology of as-deposited GO was studied using a scanning probe microscope (Veeco Nanoscope III). The micro-Raman spectra of graphene oxide and of successively reduced GO were acquired using a 532 nm excitation from a diode pumped frequency doubled Nd:YAG solid state laser (model GDLM-5015 L, Photop Suwtech Inc., China), a custom-built Raman spectrometer equipped with a SPEX TRIAX 550 monochromator and a liquid nitrogen cooled CCD (Spectrum ONE with a CCD 3000 controller, ISA JOBIN YOVN) detector. The evolution of the oxygen functional groups of the GO suspension was studied using x-ray photo electron spectroscopy (PHI 5000 VersaProbe II, ULVAC-PHI, INC., Japan) with an incident AlKα x-ray of energy of 1486.6 eV. The UV–vis absorption spectrum was obtained using a fiber-probe-based UV–Vis-NIR CCD spectrometer. The steady state photoluminescence (PL) and PL decay of the aqueous GO solution were recorded at room temperature using a LifeSpec II fluorescence lifetime spectrometer (Edinburgh Instruments) equipped with a diode laser with a wavelength of 405 nm (EPL-405) with an average power of 100 μW and a photomultiplier detector.
3. Results and discussions
The IR-irradiation-induced reduction or deoxygenation reaction happens mainly due to the photothermal effect [23], as it is well established that the vibrational excitations (phonons) play major roles for modifying the properties of carbon-based materials. Cote et al [24] reported that GO films can be reduced rapidly using a xenon flash lamp. They also showed that the released heat during the reduction of GO was roughly ten times that necessary for the deoxygenation reaction, which brought about a self-propagating domino-like deoxygenation reaction of the partially heated GO [25]. When the aqueous solution of GO is exposed to IR light, a gradual change of color from brownish-yellow to black can be observed with the variation of time, as shown in figure 1(a), suggesting the occurrence of a controlled gradual deoxygenation reaction.

Figure 1. (a) Photographs of successively reduced graphene oxide by exposure to IR irradiation (0.64 W cm−2); (i) As-synthesized GO: (ii) 1 h, (iii) 2 h, (iv) 3 h (v) 4 h, and (vi) 5 h reduction times. (b) Typical AFM image of as-synthesized graphene oxide and the corresponding height profile; (c) schematic of the structural evolution of reduced GO with IR exposure.
Download figure:
Standard image High-resolution image3.1. Structural characterization
It is apparent from the AFM image and section analysis shown in figure 1(b) that the flakes of 1.8–2.3 nm thicknesses used in this experiment consist of bi- to few-layers graphene oxide [26]. A schematic diagram of the IR-induced structural modification is shown in figure 1(c). The gradually modified structure of as-synthesized GO causes the tuning of optical properties, to be explained later.
Raman scattering is strongly sensitive to the electronic structure and is widely used for studying carbon-based materials. Figure 2(a) shows the Raman spectra of the as-deposited GO, along with that of the progressively reduced graphene oxide at different times. All of the spectra display two prominent peaks that correspond to the well-documented G (1590–1620 cm−1)- and D (1350–1360 cm−1)-bands, respectively. The G-band is assigned to the E2g phonon vibration of the carbon sp2 atoms, while the D-band is the A1g breathing mode of carbon associated with structural defects and disorders. The G-peak of GO and of partially rGO is shifted to higher frequencies, with respect to that of pristine graphene and graphite. The blueshift of the G-peak reveals the chemical functionalization of graphene with different oxygenated functional groups [27].
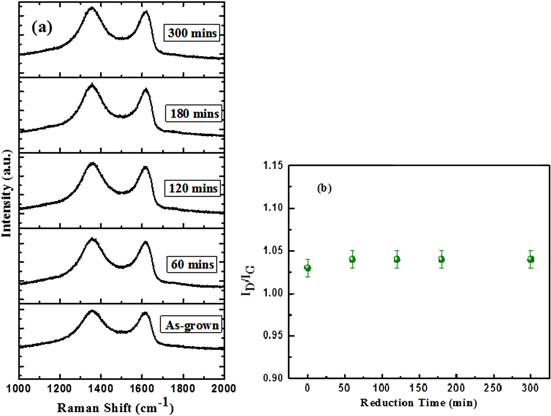
Figure 2. (a) Raman spectra of as-synthesized GO and successively reduced GO showing the evolution of the D- and G-bands; (b) the variation of the D-band to G-band intensity ratio (ID/IG) as a function of the reduction time.
Download figure:
Standard image High-resolution imageFigure 2(b) shows the intensity ratio of the D-band to G-band Raman plots (ID/IG) of the as-grown GO and the successively reduced GO as a function of time. The negligible variation of the intensity ratio indicates that the average sp2 domain size remains almost constant from GO to partially reduced GO, as the ratio is a good indication of the sp2 domain size of the graphite-based materials. In addition to the thermal reduction, which modifies the functional groups from GO, it also removes some carbon atoms in the form of the evolution of CO2 [28]. These two factors do not lead the sp2 domain size of GO to change significantly after partial reduction.
We have studied the gradual deoxygenation of graphene oxide as a function of exposure time to IR radiation using x-ray photoelectron spectroscopy (XPS), as shown in figure 3(a). The deconvoluted peak from the C1s spectra of the as-prepared graphene oxide is attributed to C=C/C-C bonds (284.6 eV), epoxy (C-O)/hydroxyl (C-OH) bonds at 286.6 eV, carbonyl (C=O) bonds at 287.9 eV and carboxyl (C (=O)-OH) bonds at 289.2 eV, which are consistent with the previous reports [29]. The evolution of different chemical bonds in an aqueous suspension of GO, monitored with XPS as a function of irradiation time, is shown in figure 3(b). The result shows that the as-prepared GO contains 52% of sp2 hybridized carbon due to the C=C bonds and 33% of carbon atoms due to the C-O bonds, which originated from the epoxy and hydroxyl groups in the basal plane. The carbonyl groups (11% in GO) and negligible carboxylic groups (4% in GO), which primarily decorate the edges of GO sheets [30]. Figure 3(b) indicates that the atomic % of sp2 hybridized carbon atoms increases with the reduction time, suggesting the restoration of sp2 clusters in the sp3 matrix. For a reduction time of 300 min, the atomic % of the sp2 hybridized carbon atom reaches to 83%, confirming an efficient reduction with the IR exposure time, whereas the atomic % of the C=O bonds decreases rapidly with the increasing reduction time. For 300 min, it becomes only 5%, suggesting most of the oxygen functional groups are removed from the basal plane of GO. However, the functional groups, which are present in the edge of GO sheets (carbonyl and carboxyl), remain almost constant during the reduction process. These interesting XPS results can be useful in explaining the PL emission data, to be discussed later.
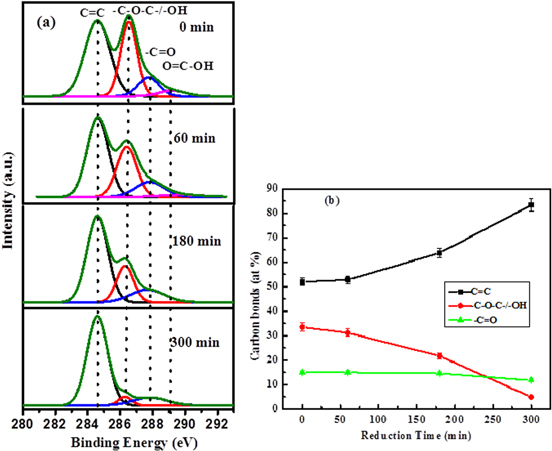
Figure 3. (a) High-resolution C1s XPS spectra of as-synthesized and gradually reduced GO showing different functional groups in the basal plane and edges of GO; (b) the evolution of C=C, hydroxyl/epoxy and carbonyl functional groups as a function of reduction time.
Download figure:
Standard image High-resolution image3.2. Tunable optical properties
The tuning of the optical property of as-prepared GO by varying the exposure time of IR radiation has been studied using UV–vis absorption spectra, and the results are shown in figure 4(a). The absorption peak for the as-prepared GO at 230 nm is ascribed to the plasmonic π-π* (C=C) transition, and the shoulder at around 300 nm is mainly due to the n-π* (C=O) transition [31]. The plasmonic peak (230 nm) is redshifted slowly toward 270 nm (inset of figure 4(a)), and an overall increase in absorption over the whole spectral range is observed; this increase is in agreement with the reported result [32]. The redshift of the plasmonic peak is attributed to the increase of the atomic % of the sp2 hybridized carbon atoms with an increase of reduction time, which is shown by the XPS study. The result indicates that the electronic conjugation is restored with the increased reduction time [33]. The absorption peak at 253 nm for 300 min of IR exposure time suggests that the GO is partially reduced. The evolution of the π-π* plasmon peak depends on two kinds of conjugative effects: one is related to nanometer-scale sp2 clusters; the other arises from the linking of chromophore units such as C=C and C-O. On the other hand, there is a relatively insignificant shift of the shoulder peak at 300 nm with the IR exposure time. This result indicates that the IR wavelength is unable to remove the carbonyl functional groups efficiently from the graphene edges. As the carbonyl functional groups are the most stable ones, they are very hard to deoxidize [34]. This is inconsistent with the XPS evolution of carbonyl functional groups presented in figure 3(b), which show almost a constant concentration of the functional groups with the increase of the photo-reduction time. We also observe the redshift of the 230 nm plasmon peak of the as-prepared GO solution with the change of the power density of the IR irradiation from 0.13 W cm−2 to 1.77 W cm−2, as shown in figure 4(b), indicating the efficient reduction of GO at a higher power.
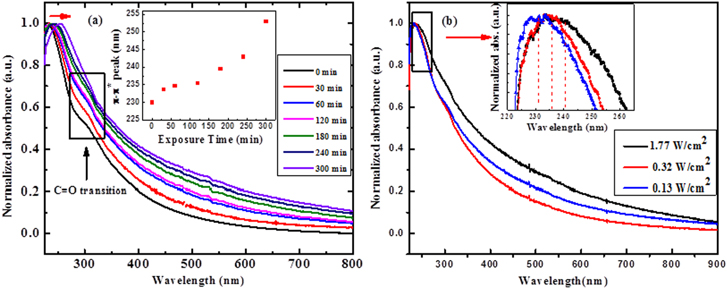
Figure 4. (a) Typical UV–vis absorption spectra of the as-synthesized GO solution and the partially reduced GO, showing the gradual redshift of the π-π* plasmon peak but a negligible change in the n-π* peak. The variation of the π-π* plasmon peak position as a function of exposure time is shown in the inset; (b) The variation of the absorbance peak with the irradiated IR power density. The zoomed-in plot of the π-π* plasmon peak shift is shown in the inset.
Download figure:
Standard image High-resolution imageThe evolution of the normalized photoluminescence emission spectra of the aqueous suspensions of GO with an excitation wavelength 405 nm as a function of photothermal reduction time is shown in figure 5(a). The typical PL spectra of an as-synthesized GO suspension that shows a broad PL spectrum from 400 nm to 800 nm is consistent with our previous observation [16]. On the other hand, the evolution of the PL peak with the variation of irradiated IR power density from 0.13 W cm−2 to 1.77 W cm−2 is shown in figure 5(b).

Figure 5. (a) Photoluminescence characteristics of graphene oxide excited at 405 nm with successive reduction using IR radiation at a power density of 0.64 W cm−2; (b) the shift of PL peak of as-prepared GO as a function of irradiated power density.
Download figure:
Standard image High-resolution imageThe broad PL spectrum is mainly deconvoluted into two Gaussian-like peaks, as shown in figure 6(a). The intense peak (peak-1) is around ∼610 nm, and the weaker one (peak-2) is at ∼500 nm for the as-prepared GO solution. With the increasing time of the IR irradiation, the PL peaks are gradually blueshifted and become narrower, as shown in figures 6(b) to (d). The maximum shift of PL peak is observed with the photothermal reduction for 300 min. The results show that the PL emission can be continuously tuned from the yellow-red region in the as-prepared GO solution to the blue region in the partially reduced GO solution after photothermal reduction using IR exposure for 300 min. Very interestingly, a gradual decrease in the intensity of emission peak-1 and a corresponding increase for peak-2 are clearly observed with the increase of photo-reduction time, as shown in figures 6(b)–(d).

Figure 6. Deconvoluted PL peaks for four different IR exposure times (power density of 0.64 W cm−2) exhibiting two prominent emission peaks; (a) as-prepared GO with IR exposure times of (b) 60 min, (c) 180 min and (d) 300 min.
Download figure:
Standard image High-resolution imageThe shift of the PL peak position and the integrated area of peak-1 and -2 for the GO and successively reduced GO samples over time are shown in figures 7(a) and (b), respectively. The peak position of peak-1 shifted from 610 nm for the as-prepared GO to 570 nm after 300 min of IR irradiation. In contrast, the position of the emission of peak-2 varies only from 500 nm to 490 nm with the increase of reduction time. We did not observe any blueshift of the PL peak with a further increase of irradiation time. This may be due to the fact that after prolonged IR exposure, highly reduced GO starts to precipitate from the aqueous suspension. In figure 7(b), the integrated area of emission peak-1 decreases, whereas the integrated area of peak-2 increases with the reduction time. The result exhibits a strong evidence of the increased sp2 fractions and decreased sp3 fractions as a function of exposure time, in corroboration with the XPS measurement. The PL emission intensity of the partially reduced graphene oxide is lower when compared to the as-synthesized GO. This may be attributed to the decrease in defect density due to the gradual removal of hydroxyl and epoxy functional groups from the as-prepared GO with the increase of the photothermal reduction time.

Figure 7. (a) The evolution of the PL peak position of peak-1 and peak-2 with the variation of reduction time; (b) plot of the integrated area (%) of peak-1 and peak-2 with IR exposure time.
Download figure:
Standard image High-resolution imageThe time-resolved PL measurement has been carried out in order to investigate the origin of the emission peaks in the GO and in the partially reduced GO samples. Figures 8(a) and (b) show the representative PL decay curves of the GO films, which were probed at two different emission wavelengths (Peak-1 and Peak-2) for different irradiation time periods. The PL intensity can be fitted using the following equation.

where τ1, τ2 indicate the lifetime of the PL decay, and A1, A2 represent the corresponding amplitude. The fitting result of peak-1 for the as-prepared GO indicates the radiative lifetime τ1 of 130 ps and τ2 of 1.04 ns. The corresponding decay constant for emission peak-2 is found to be 90 ps and 1.8 ns, respectively. Different radiative lifetimes may correspond to different electron-hole recombination mechanisms. After 300 min of IR irradiation, the PL decay times for the peak-1 emission are found to decrease, as shown in figure 8(a). τ1 and τ2 for the emission peak-1 are extracted to be 0.15 ns and 1.81 ns, respectively, for a 90 min reduction and a 1.26 and 5 ns after reduction of 300 min. On the other hand, the decay time of emission peak-2 remains almost constant over the reduction time period (figure 8(b)), which is inconsistent with the steady state PL measurement results. The τ1 of all of the samples show almost a similar temporal response of approximately 100 ps, which is close to the instrumental response function (IRF) of the measurement set-up. Two different lifetime values in the time-resolved PL results also suggest that emission peaks -1 and -2 arise from two different types of disorder-induced localized states in the heterogeneous structures of the GO and partially reduced GO.
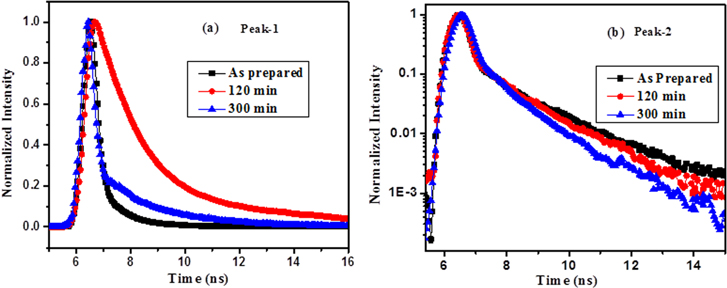
Figure 8. Time-resolved PL spectra of GO under 405 nm excitation showing the decay characteristics of the (a) peak-1 and (b) peak-2 emissions with different reduction times.
Download figure:
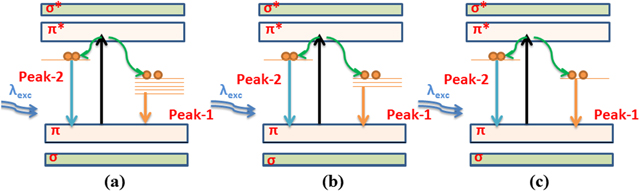
Standard image High-resolution imageThe opening of a band gap is achieved due to the functionalization of the graphene lattice with the oxygen atoms in the GO. In graphene π-π*, bands degenerate at the K-point that coincides with the Fermi level, making it a zero band gap. However, in GO, the π states disappear near the Fermi level because of bonding between the π- and oxygen-related states, causing an electron transfer from carbon to oxygen and sliding the highest occupied molecular orbital (HOMO) state downward, which results in the opening of a band gap [35].
It is also reported that the presence of oxygen functional groups may result in defect states in the π-π* gap [20]. This results in transitions between the disorder-induced localized states, causing a broad emission spectra from 400 nm to 800 nm (3.1 eV to 1.55 eV). The emission of peak-1 around 605 nm (2.04 eV) for the as-prepared GO corresponds to the transition from the disorder-induced localized states due to hydroxyl/epoxy, as schematically shown in figure 9(a). The number of these disorder-induced states decreases gradually during deoxygenation by IR irradiation, resulting in the blueshifts of peak-1 with the reduced intensity, as shown in figures 7(a) and (b). This mechanism is schematically depicted in the proposed band diagram in figures 9(b)–(c).
Figure 9. Schematic band diagram showing the mechanism of the PL emission of (a) As-synthesized GO and of partially reduced GO with (b) moderate and (c) prolonged duration of the photothermal reduction.
Download figure:
Standard image High-resolution image
The PL emission in figure 6(a) also consists of peak-2 around 495 nm, which is almost fixed in position at 2.51 eV, as shown in figure 7(a). It may be assigned due to C=O-related localized electronic states of oxidation sites (schematically shown in figure 9(a)). This relatively lower shift of the emission peak-2 is consistent with the constant concentration of the carbonyl functional groups over a different reduction time, which is in corroboration with the XPS study. It is evident from our results that the tailoring of the above three functional groups (hydroxyl, epoxy and carbonyl) by controlled reduction procedures leads to the tunable optical properties of GO. Our results demonstrate the use of a simple, environmentally benign and controlled IR radiation-induced functional group modification of graphene oxide, which may play very important roles in tuning the optical properties of graphene-based materials for applications in future optoelectronic devices.
4. Conclusion
We have demonstrated the continuous tuning of optical properties of graphene oxide by simply varying the IR irradiation time and power density. The photothermal reduction using IR radiation causes the tailoring of oxygen functionalities of graphene oxide. Raman spectroscopy and XPS indicate the gradual reduction of GO with time. As-grown GO has exhibited a broad PL emission band due to the presence of various carbon species with different oxygen functional groups. With the increase of the IR exposure time and irradiated power density, the yellowish-red emission of GO decreased and blue-shifted gradually, whereas the blue PL emission peak became the prominent one for prolonged reduction. The modified optical properties of functionalized GO leading to varied decay times observed through time-resolved PL measurements also support the premise. This IR-induced photothermal reduction affects the structural properties of graphene oxide, which can be used for tuning the optical properties by controlling the ratio of the sp2 to sp3 fraction. The results indicate the significant potential of simple and controlled optical-induced reduction of GO for future optoelectronic devices.
Acknowledgment
This work is supported by the funding from the GBH project, sponsored by CSIR, Government of India. The use of the XPS facility from the DST-FIST program of the Department of Physics is acknowledged.