Abstract
Polydimethylsiloxane (PDMS) elastomers are extensively used for soft lithographic replication of microstructures in microfluidic and micro-engineering applications. Elastomeric microstructures are commonly required to fulfil an explicit mechanical role and accordingly their mechanical properties can critically affect device performance. The mechanical properties of elastomers are known to vary with both curing and operational temperatures. However, even for the elastomer most commonly employed in microfluidic applications, Sylgard 184, only a very limited range of data exists regarding the variation in mechanical properties of bulk PDMS with curing temperature. We report an investigation of the variation in the mechanical properties of bulk Sylgard 184 with curing temperature, over the range 25 °C to 200 °C. PDMS samples for tensile and compressive testing were fabricated according to ASTM standards. Data obtained indicates variation in mechanical properties due to curing temperature for Young's modulus of 1.32–2.97 MPa, ultimate tensile strength of 3.51–7.65 MPa, compressive modulus of 117.8–186.9 MPa and ultimate compressive strength of 28.4–51.7 GPa in a range up to 40% strain and hardness of 44–54 ShA.
Export citation and abstract BibTeX RIS

Content from this work may be used under the terms of the Creative Commons Attribution 3.0 licence. Any further distribution of this work must maintain attribution to the author(s) and the title of the work, journal citation and DOI.
1. Introduction
Polydimethylsiloxane (PDMS) has been widely adopted as a substrate material for manufacturing lab-on-a-chip and micro total analysis systems [1, 2]. PDMS has become the most commonly employed elastomer for fabricating microfluidic devices. The properties of PDMS and its practical application in microfluidic systems has been discussed in detail [3]. Its primary advantages over other substrate materials include low cost, fast simple fabrication and optical transparency through the visible spectrum down to 240 nm. Its low shrinkage rates and ability to replicate microscale features make it well suited for soft lithography processes [2].
PDMS substrates do have some important limitations, most notably poor chemical compatibility (e.g. use of organic solvents can result in swelling) and low hardness, which prevents its application in some chemical and high pressure applications [3]. PDMS structures, such as in-stream flow restrictions or flow diverting structures, are known to distort under pressure [4] or external force [5]. However for many applications the advantages significantly outweigh the disadvantages.
Recent microfluidic and micro electro mechanical systems (MEMS) have demonstrated that the high elasticity (flexibility) of PDMS offers unique advantages over more traditional rigid substrate materials such as glass, silicon and harder polymers. A increasing number of devices are being reported employing the relative deformability of the low hardness PDMS in order to facilitate flexible microstructures within composite structures. Examples include micropumps employing elastomeric displacement amplification [5–7], PDMS micro valves operated using solid hydraulics [8], flexible micropillar arrays for biological force measurements [9], mechanically adjustable PDMS devices for cell trapping [10] and flexible adaptable fluid lenses [11].
The increasing utilization of the elastic properties of PDMS substrates has led to specific investigations into its mechanical properties. Previous studies of the mechanical properties of PDMS have focused on specific applications including, thin membranes for sensors [12], material elasticity for accelerometers [13], biomedical [14] and PDMS's nonlinear behaviour in both its standard and modified compositions [15–17]. Liu et al [16] have shown that the Young's modulus (elastic modulus) of PDMS membranes changes from being a bulk behaviour above 200 µm thickness to being a dimension-dependent behaviour for thicknesses below 200 µm. This dimensional dependence of thin membranes is due to the reordering of polymer chains during fabrication of thin layers. Liu et al [18] proceeded to demonstrate that for thin PDMS films curing temperature can significantly influence the resulting material properties.
The mechanical effects of varying ratios of pre-polymer base and cross-linking agents have been reported [19]. It was found that the elastic modulus increased with mixing ratio up to a ratio of 9:1 after which the elastic modulus decreases as the mixing ratio continues to increase.
For microfluidic applications PDMS microstructured components are most frequently fabricated with thicknesses greater than 200 µm and using the manufacturers recommended mix ratio of 10:1. Schneider et al [20] reported that tensile testing of bulk PDMS up to a strain of 40% yielded a linear correlation between the elastic modulus and operating temperature, but that applied strain rate had little influence on the measured mechanical properties.
However, the vast majority of reported of microfluidics and microengineering applications of PDMS do not employ standard curing temperatures or durations in their fabrication, and hence the processing-dependent variation in mechanical properties of the PDMS is poorly understood. There are few [14, 20] reported characterizations of the bulk mechanical properties (thickness > 200 µm) of cross-linked PDMS under well defined curing temperature conditions. The 'typical' value of tensile strength provided in the manufacturers data sheet (7.1 MPa) [21] has no defined curing temperature conditions and lies at the upper end of the range of values reported in the literature: (1–9) MPa [16, 18, 20].
Accordingly, we report an experimental study of the bulk mechanical properties of the most commonly employed PDMS for microfluidic applications [22], Sylgard 184 (Dow Corning) [21]. Specifically, we investigate and present quantitative data regarding the relationship between the bulk material properties of Sylgard 184 and curing temperature, thereby contributing fundamental design information for passive, pressure driven, microfluidic devices and emerging active elastomeric MEMS devices.
2. Fabrication
In order to investigate the material properties of Sylgard 184 two mold types were manufactured. Both were designed in accordance with the respective American Society for Testing of Materials (ASTM) standards for tensile and compressive testing of rubber and elastomeric materials. Likewise, the compression test mold samples satisfy the ASTM criteria for elastomeric hardness testing.
2.1. Manufacture
Tensile test pieces where manufactured to the ASTM D412 Type C standard which specifies a dumbbell shaped test structure, whose wider end sections are clamped into the test apparatus while the narrower central neck region is tested. The test piece was cast from a three-part mold consisting of 2.0 mm thick polished aluminium top and bottom plates constraining a 3.0 mm thick Poly(methyl methacrylate) (PMMA) piece (figure 1). The PMMA piece was manufactured using a laser cutter (Trotec, Speedy 300), with a vector optimized cutting path to avoid failure-inducing indents or notches within the critical neck region. A minor modification to the ASTM geometry used for the mold was the inclusion of an overflow/bubble-trap region at one end of the dumbbell shape, allowing addition of an excess of PDMS to ensure full filling of the mold and removal of bubbles that had been introduced into the PDMS while casting. Any cured excess PDMS in the overflow region was then removed with a scalpel prior to testing.

Figure 1. Central pieces for the tensile test mold for ASTM D412-C (left) and compressive test mold for ASTM D575-91 (right).
Download figure:
Standard image High-resolution imageThe compressive test pieces were manufactured in accordance with ASTM D575-91. This was achieved via the fabrication of a multi-part mold consisting of 2.0 mm polished aluminium top and bottom plates constraining the central PMMA mold-piece (figure 1). As with the tensile test mold a minor modification to the ASTM geometry incorporated an overflow and bubble-trap region into the uppermost layer of the PMMA mold. After curing the overflow regions on both sets of test pieces were easily removed using a razor blade.
2.2. PDMS preparation
Sylgard 184 silicone elastomer is supplied as a two-part liquid component kit, a pre-polymer base (part A) and a cross-linking curing agent (part B), that when mixed together is curable at both room temperature (RT = 25 °C) and elevated temperatures (RT > T > 200 °C) [21]. For this study the manufacture of PDMS was conducted in accordance with the manufacturer's recommendations. Thus all PDMS test pieces fabricated for tensile, compression and hardness testing were mixed at the recommended ratio of 10 parts base to 1 part curing agent. To ensure standardization and repeatability across all test samples, the mixing process was performed using a commercial flocculator (SW5, Stuart Scientific). All samples were thoroughly mixed for a duration of 1 min at a speed of 195 rpm.
In order to fabricate bubble free test samples the mixed uncured PDMS was thoroughly degassed in a vacuum dessicator at low pressure for 30 min using a roughing pump. The degassed PDMS mixture was then poured into the PMMA molds, which were then clamped shut. The filled molds were then suspended vertically for 30 min to allow any remaining bubbles in the uncured PDMS to migrate upwards to the bubble-trap area of the mold.
2.3. Curing
The curing time and temperature conditions investigated were as recommended by Dow Corning [21] 25 °C, 100 °C, 125 °C and 150 °C, with an additional cure temperature of 200 °C at the upper limit of Dow Corning's suggested working temperature range. For the purpose of this study we will assume these recommended curing conditions result in fully cured samples. Temperatures above 200 °C were not tested as it has been reported that thermal decomposition of PDMS commences at temperatures in excess of 200 °C [18].
The samples were all cured using a digitally controlled oven allowing precise control of the operating temperature (UT6 P, Heraeus Instruments GmbH, Germany). While curing at elevated temperatures (>RT) heat propagation through the mold inevitably results in a stabilization period during which the temperature of the curing PDMS approaches the required curing temperature. For higher curing temperatures this becomes increasingly important as the propagation time can actually exceed the recommended curing time.
In order to compensate the curing times for heat propagation effects, the core temperature rise was characterized for each mold. Modified molds containing a thermocouple probe (TK2000, Charvin Arnoux) were employed to measure the increase of internal PDMS temperature with time. The thermocouples were located in the critical neck region, for tensile test pieces, and centrally located for compressive and hardness test pieces.
The time to reach the desired curing temperature was recorded and the results for tensile and compressive molds are presented in figure 2. The oven was preheated to the desired temperature prior to introducing the samples. From the heat propagation data it was determined that after 13 min for the tensile mold and 18 min for the compressive mold the core temperatures had effectively reached the required curing temperatures. Hence the curing times employed for the subsequent tests reported in this study were corrected by adding additional periods of 13 min and 18 min, for the tensile and compressive samples respectively, to the Dow Corning recommended curing times (see table 1). The cured PDMS samples were allowed to cool for 1 h at laboratory room temperature (22 °C) prior to mold removal and inspection.
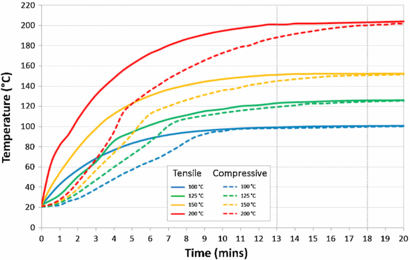
Figure 2. Heat propagation through tensile and compressive PDMS test samples at oven temperatures of 100 °C, 125 °C, 150 °C and 200 °C. Dotted vertical lines indicate selected additional curing times of 13 min (tensile) and 18 min (compression).
Download figure:
Standard image High-resolution imageTable 1. Temperature and cure duration (including heat propagation offset) for tensile and compressive PDMS Sylgard 184 test samples.
| Temperature (°C) | Dow Corning recommended curing duration | Corrected tensile curing duration | Corrected compressive curing duration |
|---|---|---|---|
| 25 (RT) | 48 h | 48 h | 48 h |
| 100 | 35 min | 48 min | 53 min |
| 125 | 20 min | 33 min | 38 min |
| 150 | 10 min | 23 min | 28 min |
| 200a | – | 18 min | 24 min |
a Dow Corning do not provide a recommend curing time at 200 °C. Experimental testing of the durations listed above were found to result in well cured test pieces.
The criteria used to manufacture the test samples are presented in table 1. The manufacturer's recommended curing temperatures and durations are presented as well as the values corrected for heat propagation used to fabricate the tensile and compressive test samples.
3. Experimental procedure
The optically transparency of cured PDMS enabled all samples (tensile and compressive) to undergo a visual inspection to identify possible tears, bubbles or other visually detectible defects that could affect the mechanical integrity of the samples. All samples which underwent mechanical testing were free of visual defects. In order to ensure consistency of testing all samples were tested within 2 h of the end of their curing time.
3.1. Tensile testing
Tensile testing of the samples was performed according to ASTM D412 on a universal testing machine (Hounsfield, Universal 10 kN). Crosshead velocity was 254 mm min−1. Tensometer data was recorded using in-house, non-commercial, data logging software. To ensure uniform pressure distribution across the elastomer sample when secured by the jaws of the tensometer, PMMA support tabs (25 mm × 18 mm × 5 mm) were fabricated and attached on both sides of the PDMS test samples using double-sided adhesive tape.
The ASTM process for tensile testing of material properties is the standard employed for comparison of mechanical properties of different materials. For the majority of materials this is sufficiently accurate. However, elastomers can display elastic behaviour up to very high strain levels. At strain levels below 40% [20] the linear behaviour allows the Young's modulus to be calculated via Hooke's law: E = σ/ε, where σ is the applied stress and ε is the resultant strain. Beyond this linear region higher order nonlinear material models such as the Mooney–Rivlin and Ogden models must be employed [15].
Schneider et al [20] demonstrated that for silicone elastomers the strain occurring in the wider end section of the test pieces can result in overestimates of strain in the test section by up to 100%. To accurately obtain the mechanical properties of elastomers from standard experimental test procedures the strain occurring in the wider end section of the test pieces must be taken into account. They show that for strain values below 40% a purely geometric correction factor can be calculated, dependent on the geometry of the specific test structure, which can be used to correct the total strain values to obtain the true strain of the narrow central test region. Using ANSYS Workbench 13.0 we simulated the ASTM D412 Type C elastomer test piece at strain values below 40% to obtain this correction factor, using the previously reported methodology [20]. For the ASTM D412 Type C geometry we calculate a correction factor of 0.40 which will be used to obtain corrected values of strain.
Young's modulus, maximum tensile strength and elongation at break were calculated using the tensile test data from the stress–strain region below 40%. Samples were tested consecutively and the average ambient conditions during testing were 21 °C and 39% relative humidity.
3.2. Compressive testing
Compressive testing of the samples was performed according to ASTM D1229-03 (2008) (low temperature) on a universal testing machine (Avery Denison, T42U). Crosshead velocity was set to maximum (20 mm min−1). Compression testing techniques are known to include some inaccuracies due to variation of the cross sectional area and barrelling of the test pieces [23] as the test load increases. This is primarily due to high friction between the test sample surfaces in contact with the testing plates, which results in deviation from uniform axial compression stress states. Indeed, initial tests resulted in premature failure in a 'starburst' mode as result of excessive friction between the PDMS test cylinder and the base platform. In all subsequent tests excessive friction and the resultant barrelling was prevented by applying a drop of machine oil to the parallel surfaces of the PDMS cylinder immediately prior to testing.
During operation the dial gauge was filmed using a static video camera to record the applied load at the point of failure. Samples were tested consecutively and the average ambient conditions during testing were 20 °C and 39% relative humidity.
3.3. Hardness testing
Hardness tests were conducted using a hand-held Durometer (Shore Instruments, Type A-2) in accordance with ASTM D2240-05 (2010) type A. Hardness measurements were recorded as soon as complete indentation had occurred to mitigate against the relaxation of elastomeric material that can occur between 5 s and 15 s after indentation [24], this process was repeated and averaged across the sample surface to ensure homogenous hardness measurements.
4. Experimental results and discussion
As previously discussed, mechanical properties for each of the tensile, compressive and hardness tests were tested for samples cured at temperatures of 25 °C, 100 °C, 125 °C, 150 °C and 200 °C. In total 60 PDMS test pieces were used for experimental testing. All errors specified are representative of a 95% confidence interval.
4.1. Tensile
The influence of curing temperature on the tensile strength of Sylgard 184 PDMS, was determined by averaging the data from each of six test samples for every cure temperature, as presented in figure 3. The strain values presented have been corrected using the correction factor discussed in section 3.1. The stress/strain curves, as anticipated, display the typical linear elastic region up to stain values of 40% (see figure 4) followed by a nonlinear region before failure. The data shown also indicates that the maximum strain of the samples is inversely proportional to the curing temperature.

Figure 3. Averaged tensile engineering stress/strain curves for PDMS samples cured at temperatures of 25 °C, 100 °C, 125 °C, 150 °C and 200 °C.
Download figure:
Standard image High-resolution image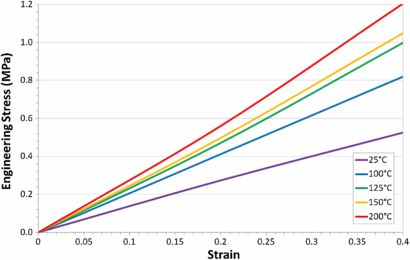
Figure 4. Detail of averaged tensile engineering stress/strain curves up to 40% strain for PDMS samples cured at temperatures of 25 °C, 100 °C, 125 °C, 150 °C and 200 °C.
Download figure:
Standard image High-resolution imageThe Young's modulus of the Sylgard 184 samples for each curing temperature was calculated for the linear elastic region (<40% strain) using Hooke's law as presented in table 2, along with elongation at failure, failure load and ultimate tensile strength. The Young's modulus of the test samples was found to be linearly dependent on their curing temperature within the temperature range tested, see figure 5. However, the ultimate tensile strength (UTS) is highest for PDMS test samples cured at 125 °C.

Figure 5. Relationship between curing temperature of Sylgard 184 and the resultant Young's modulus.
Download figure:
Standard image High-resolution imageTable 2. Variation of tensile test data with curing temperature.
| Temperature (°C) | Average elongation (mm) [uncorrected] | Average failure load (kN) | Young's modulus (MPa) | Ultimate tensile strength (MPa) |
|---|---|---|---|---|
| 25 | 93.1 | 92.34 | 1.32 ± 0.07 | 5.13 ± 0.55 |
| 100 | 76.4 | 112.5 | 2.05 ± 0.12 | 6.25 ± 0.84 |
| 125 | 66.2 | 137.7 | 2.46 ± 0.16 | 7.65 ± 0.27 |
| 150 | 63.4 | 94.32 | 2.59 ± 0.08 | 5.24 ± 0.82 |
| 200 | 49.5 | 63.18 | 2.97 ± 0.04 | 3.51 ± 1.11 |
4.2. Compression
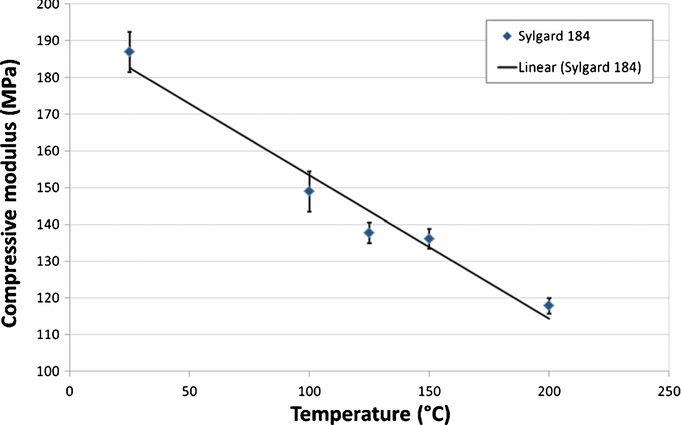
We investigated the dependence of temperature on the compressive strength of Sylgard 184 PDMS. As with the tensile testing the stress/strain curves broadly display the typical linear elastic region, up to stain values of approximately 55% (see figure 6) followed by a nonlinear region before failure. Slight variations in the gradients of tested samples for strain values below 55% are likely to result from slight barrelling of the sample while still deforming elastically. Figure 7 shows that the compressive modulus (Ec) of cured test samples reduces linearly with increasing curing temperatures. However, the ultimate compressive strength (UCS) of the test samples decreases with increasing curing temperature, see table 3.

Figure 6. Averaged compression engineering stress/strain curves of PDMS samples cured at temperatures of 25 °C, 100 °C, 125 °C, 150 °C and 200 °C.
Download figure:
Standard image High-resolution image
Figure 7. Relationship between curing temperature of Sylgard 184 and the resultant compressive modulus.
Download figure:
Standard image High-resolution imageTable 3. Variation of compressive properties of Sylgard 184 with curing temperature.
| Temperature (°C) | Compressive modulus (MPa) | Ultimate compressive strength (MPa) |
|---|---|---|
| 25 | 186.9 ± 5.39 | 51.7 ± 9.60 |
| 100 | 148.9 ± 5.47 | 40.1 ± 4.30 |
| 125 | 137.7 ± 2.82 | 36.8 ± 3.84 |
| 150 | 136.1 ± 2.68 | 28.4 ± 4.46 |
| 200 | 117.8 ± 2.17 | 31.4 ± 2.04 |
4.3. Hardness
Hardness of cured PDMS samples was investigated in accordance with ASTM D2240-05 (2010) type A. Four PDMS samples were tested for each temperature and the hardness of each sample was tested in eight different locations. The hardness of the samples varied linearly with increasing curing temperature (see figure 8).

Figure 8. Relationship between curing temperature of Sylgard 184 and the resultant hardness (Shore A).
Download figure:
Standard image High-resolution image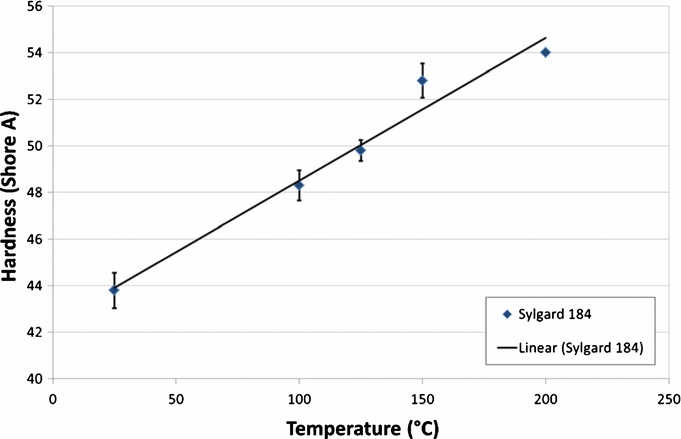
4.4. Shear and bulk moduli
We proceed to derive the additional mechanical properties of shear modulus and bulk modulus for the cured PDMS test samples. Equation (1) relates the Young's modulus to both the shear and bulk moduli via Poisson's ratio (ν). A definitive value for the Poisson's ratio of Sylgard 184 is not readily available in the literature, with values ranging from 0.45–0.5 [25, 26]. However, there are a number of reports which suggest that an accurate value for PDMS's Poisson's ratio, for strains below 45% is ∼0.5 [27–29] with values of 0.499 being employed in order to avoid incorrect calculation of infinite moduli. Here we employ the commonly accepted approximation of 0.499 in all calculations (results presented in table 4) but it is important to note that small variations in the value of Poisson's ratio employed can result in the calculation of significantly different values of both Shear and Bulk moduli.

Where: E = Young's modulus, G = shear modulus, ν = Poisson's ratio and K = bulk modulus.
Table 4. Tensile test results across temperature and corrected cure duration.
| Temperature (°C) | Shear modulus (MPa) | Bulk modulus (GPa) |
|---|---|---|
| 25 | 0.44 ± 0.02 | 2.20 ± 0.11 |
| 100 | 0.68 ± 0.04 | 3.42 ± 0.17 |
| 125 | 0.82 ± 0.05 | 4.11 ± 0.20 |
| 150 | 0.86 ± 0.03 | 4.32 ± 0.22 |
| 200 | 0.99 ± 0.01 | 4.95 ± 0.25 |
4.5. Summary
We have presented experimental data describing the variation in material properties of Sylgard 184 with curing temperature. Within the elastic region of the engineering stress–strain relationship (for strain below 40%) we found that the Young's modulus of the samples undergoing tensile testing was linearly dependent on their curing temperature within the temperature range investigated. An increase in the curing temperature from 25 °C to 200 °C more than doubled the Young's modulus. Under compression testing we found that the Compressive modulus of the samples was approximately two orders of magnitude higher than the Young's modulus and decreased linearly with curing temperature, within the elastic region. The measured hardness of the samples also increased linearly with increasing curing temperature. Additionally, from the experimental data we calculated the Shear and Bulk moduli. Table 5 summarizes the data.
Table 5. Summary of the influence of curing temperature on the mechanical properties of Sylgard 184.
| Temperature (°C) | E (MPa) | UTS (MPa) | Hardness (Shore A) | Ec (MPa) | UCS (MPa) | G (MPa) | K (GPa) |
|---|---|---|---|---|---|---|---|
| 25 | 1.32 ± 0.07 | 5.13 ± 0.55 | 43.8 ± 0.76 | 186.9 ± 5.39 | 51.7 ± 9.60 | 0.44 ± 0.02 | 2.20 ± 0.11 |
| 100 | 2.05 ± 0.12 | 6.25 ± 0.84 | 48.3 ± 0.65 | 148.9 ± 5.47 | 40.1 ± 4.30 | 0.68 ± 0.04 | 3.42 ± 0.17 |
| 125 | 2.46 ± 0.16 | 7.65 ± 0.27 | 49.8 ± 0.45 | 137.7 ± 2.82 | 36.8 ± 3.84 | 0.82 ± 0.05 | 4.11 ± 0.20 |
| 150 | 2.59 ± 0.08 | 5.24 ± 0.82 | 52.8 ± 0.73 | 136.1 ± 2.68 | 28.4 ± 4.46 | 0.86 ± 0.03 | 4.32 ± 0.22 |
| 200 | 2.97 ± 0.04 | 3.51 ± 1.11 | 54.0 ± 0.08 | 117.8 ± 2.17 | 31.4 ± 2.04 | 0.99 ± 0.01 | 4.95 ± 0.25 |
6. Conclusion
We have investigated the curing temperature dependency of the fundamental mechanical properties of Sylgard 184 PDMS within the range of standard fabrication processes. Specifically we have performed a series of tensile, compressive and hardness tests, to standards ASTM D412, ASTM D1229-03 and ASTM D2240-05 respectively, to examine the effects of curing temperature on material properties over a range of curing temperatures from 25 °C to 200 °C. From these tests we have determined the resultant ranges of Young's modulus, ultimate tensile strength, compressive modulus, ultimate compressive strength and hardness.
We observed a linear relationship between the Young's modulus and the curing temperature, resulting in a doubling of the Young's modulus (E) from 1.32 MPa to 2.97 MPa with an increase in the curing temperature from 25 °C to 200 °C. In contrast, under compression, we observed that the compressive modulus was approximately two orders of magnitude greater than the Young's modulus and decreased linearly with curing temperature, from 186.9 to 117.8 MPa, over the same temperature range.
Through our investigation of the effects of curing temperature of Sylgard 184 on its material properties we hope to provide quantitative data for researchers designing sensors and actuators employing Sylgard 184 PDMS as an integral engineering substrate material. The significant difference between the tensile and compressive moduli of the cured samples should assist in the design of future devices employing PDMS materials in compressive as well the more commonly employed tensile modes.
Acknowledgments
The authors would like to acknowledge the help and support of Pete Thomson during the experimental stage of this work and Dr Phil Green for material's science discussions and kindly reviewing data.