
Abstract
In this paper a model is presented that describes the distribution of adhesion values typically experimentally observed for different MEMS devices that have been fabricated in the same way. This spread is attributed to the fact that different devices differ in the details of their surface roughness, even if these surface roughnesses are modeled as coming from the same 'parent' stochastic process.
Using Monte Carlo simulations, the effect of surface roughness and relative humidity has been evaluated in detail, both on the expected mean value of the surface interaction energy between the MEMS surfaces, and the expected spread on this value from device to device.
By comparing the new model to existing literature reporting this experimentally observed spread, we have found excellent agreement between the experimental spread observed, and the spread calculated with the theoretical model using Monte Carlo simulations.
This work paves the way to detailed adhesion failure predictive modeling. It may be used to assess the reliability of MEMS designs that rely on contacting surfaces for their operation, but have a limited restoring force available to separate the surfaces when in contact.
Export citation and abstract BibTeX RIS

Content from this work may be used under the terms of the Creative Commons Attribution 3.0 licence. Any further distribution of this work must maintain attribution to the author(s) and the title of the work, journal citation and DOI.
1. Introduction
It has long been recognized that (auto-)adhesion failures, also called stiction in the MEMS community, pose both a yield and a reliability hazard [1]. Significant modeling of the adhesion force and the surface interaction energy, at different levels of complexity, have brought us close to a good understanding of the adhesion forces in MEMS. Adhesion is typically caused by capillary condensation, molecular van der Waals forces, electrostatic forces, Casimir forces, H-bonding, direct metallic contact, and the gluing force of third bodies [2–4]. The key factor determining the magnitude of the adhesion of otherwise similar surfaces in a common environment is the surface roughness of the contacting bodies. It is the surface roughness that determines how much of the area of the surface is really in intimate contact (figure 1).
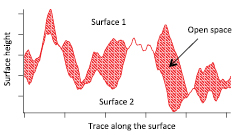
Figure 1. Contacting rough surfaces. The colored area represents the space between the contacting surfaces. Only the parts of the surfaces that are very close to the other surface contribute significantly to the overall observed adhesion.
Download figure:
Standard image High-resolution imageSeveral key publications have addressed the details of this surface roughness effect on adhesion, ranging from assuming (relatively) simple plastic [5] or elastic contact [6] to the introduction of a completely new contact mechanics framework such as in [7]. The objective of all these approaches is, in one way or another, to find the distribution of the distance between the contacting surfaces. By knowing how the different forces behave as a function of the separation distance, and how much (percentage) of the surface there is at every separation distance, the total adhesion force may be calculated.
What has been missing so far in the theoretical descriptions is the fact that, in practice, a large spread of the measured adhesion values is found, even for similar devices under identical environmental conditions. That the adhesion is a distribution has been recognized by several authors [8–10]. This notion is extremely important when one wants to do an a priori yield or reliability assessment of a certain MEMS device or MEMS technology. If the adhesion is a distribution of values, it does not suffice to know one number for the adhesion to predict whether a certain device will be viable for production or survive in the field. Instead, the details of the distribution should be known so that statements can be made of the type 'there is such-and-such a chance that a device will have an adhesion higher than such-and-such'.
In this paper the question is addressed of how adhesion distributions of 'identical' devices with surface roughness come about, how to model them, and how to measure them. The approach is validated by comparing the modeling results to an existing set of measurement data from the MEMS literature. It will be shown that the model presented is not only useful for addressing adhesion as such, but is also the missing link for an adhesion reliability predictive model. This model can be used for the prediction of field stiction failures in a known environment.
2. Theory
2.1. Differences between different contacting rough surfaces with an identical statistical description
For the modeling shown in this paper, it is assumed that all properties of the contacting MEMS surface are identical except their exact surface roughness. In MEMS processing, the surface roughness depends on the materials and the processing (deposition, lithography, etching, etc) that these materials have been through. Its quantitative indicators (Ra, Rq, etc.) typically vary little from place to place, as long as the same measurement conditions (same selected structure, same measured area) are taken. Of course the local details can be different. Therefore a 'parent' stationary stochastic process (where the basic parameters of the 'noise' do not change), from which individual realizations are taken, is a natural choice. In reality, other differences may be present, caused by e.g. nonuniform processing of different MEMS wafer areas. However, the devices are then not 'identical'.
The simplest model of a rough surface is that of a statistical height variation described by a height distribution function (describing the amplitude of the roughness) and an autocorrelation function (describing the steepness of the slopes of the surface). We neglect the fact that the surface roughness process is nonstationary (the 'fractal-like' behavior) at different length scales. The surface roughness model can be used in a plastic deformation model to find the properties of the contact and the adhesion, as presented in [5]. Recent work by Ardito et al [11] shows that this approach can be remarkably accurate when compared to experimental results, given the simplifications compared to a real contact. Starting the modeling from the assumption of fully elastic contact also gives good results, but makes the calculations more complicated [6]. The surface interaction energy typically changes by orders of magnitude with roughness and relative humidity. The good results with different modeling approaches show that the exact contact mechanics model used seems to be less important than having the surface roughness and interacting surface force models right. Here the simplest contact mechanics approach, being the fully plastic case, will be considered.
Modeling the surface roughness as a stochastic process with a Gaussian amplitude distribution h(z) for the height z and an autocorrelation function RXX(x) has the advantage that the concepts and terminology of stochastic process theory can be used. Every rough surface possible, given the constraints of the process, is a realization of that process. Different 'identical' MEMS devices have different surfaces, which all correspond to the same stochastic process (figure 2).
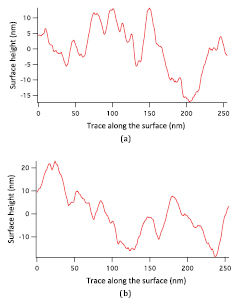
Figure 2. Different surfaces with the same statistical parameters can be modeled as different realizations of the same stochastic process. (a) Realization 1 and (b) realization 2.
Download figure:
Standard image High-resolution imageThe contact of two rough surfaces 1 and 2 can be modeled as a contact between a single rough surface and a perfectly flat, infinitely hard one, by mathematically transferring the properties of the second surface to the first one: the autocorrelation functions are added (and divided by two for normalization), and the height distribution becomes  [5]. The contact then becomes equivalent to a bearing area (figure 3), where the hardness H determines the minimum area the flat contact needs to be to sustain the applied load without yielding [12]. The distance a between the height of the bearing area and the mean surface height is not identical for all surface realizations, although the actual bearing area magnitude, which is solely dependent on the hardness and the load, is the same for all realizations.
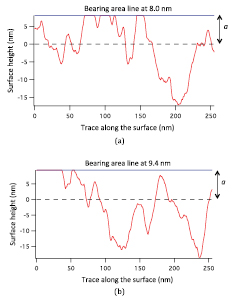
Figure 3. Identical bearing line magnitude for the two surfaces of figure 2: the removed part (defining the bearing line) constitutes 40 nm. The vertical axis shows the distance of the rough surface from the contact. The contact takes place at height a above the mean surface height which is defined as 0 nm high. (a) Realization 1 and (b) realization 2.
Download figure:
Standard image High-resolution imageTwo aspects of this difference between realizations are the cause of the adhesion variations that we see in 'identical' MEMS:
- every realization happens to have a different amount of surface area at a certain distance from the contact line;
- the difference in bearing area height a for different realizations also causes differences; if a is very low, there is a greater chance of encountering a lot of extra surface area very close to the bearing area line.
To assess the differences in adhesion caused by the differences between the surface realizations, several types of surface with different parameters have been simulated. All have a Gaussian amplitude distribution, and an exponentially decreasing autocorrelation function.
A typical stochastic process to generate the 'MEMS-like' surfaces, with which figures 2–5 were simulated, has a height standard deviation of 3 nm (adjusted to this value for every realization), a correlation length of 10 nm, and a total surface length of 256 nm. Note that these are the values for the two 'surfaces combined into one'. To completely define the problem, a bearing area (or line, in our 1D model) needs to be chosen, and then the full contact geometry is determined. Figure 3 was calculated with a bearing line of 40 nm. In figure 4 the calculated 40 nm bearing line heights, a, of 1000 realizations are shown, sorted in increasing height. This is the cumulative distribution function of the bearing line heights. We find that the lowest bearing line is found around 1.3 standard deviations from the mean, while the highest is almost seven standard deviations away. This shows the significance of keeping an eye on the individual realizations of the rough surface stochastic process! The larger the total apparent surface contact in comparison with the correlation length, the smaller the case-to-case deviations become. For very large areas, the Gaussian height distribution itself is the only function that determines the height of the bearing area line. The width of the distribution for different ratios of surface realization length versus correlation length is given in figure 5, which shows this effect. The bearing height distribution standard deviation will not simply saturate at high contact length over correlation length ratios. This can be seen from the following argument: when the correlation length is much longer than the total contact length, the surface becomes 'flat'; only the 'mean' of that surface is in every realization at a different place, given a single parent distribution. If we do not take this into account, we indeed saturate, but it has no physical meaning, as it just means that every surface mean height is in a different place, not that the surface is rough. Here this effect has been taken into account, by subtracting the constant (horizontal straight line) term. That is why the standard deviation starts to drop again.
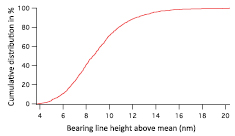
Figure 4. Surfaces sorted by increasing bearing line height: the distance a of the bearing line to the mean shows a large spread of a factor 4–5.
Download figure:
Standard image High-resolution image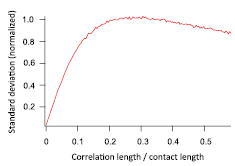
Figure 5. Bearing height line distribution (normalized to maximum encountered standard deviation = 1) for different ratios of total surface length versus correlation length show that the variation diminishes for very 'long' apparent contact length for a perfect Gaussian distribution with an exponentially decaying correlation function.
Download figure:
Standard image High-resolution imageWe have to note that the ratio between real (the bearing line/area) and apparent surface contact length/area (being the total area seen to be in contact from a macroscopic point of view) also plays a major role. We will return to this issue when we link the theory to experimental data in section 3.2. For now it suffices that this is the reason that a total contact length (in the simulations 256 nm) has been defined above in addition to a bearing line length.
2.2. Adhesion comes into play
To understand the adhesion caused by capillary condensation and van der Waals molecular forces, we have to calculate how they are influenced by the different realizations of the surface roughness, and the corresponding differences in distance distribution of the area between the surfaces.
The details of the adhesion modeling are described in an earlier paper [5]. Capillary condensation is present for every part of the apparent contact where the distance between the surfaces is less than two times the Kelvin radius. The Kelvin radius is given as rK = 0.54 nm/log(RH) at atmospheric pressure and 20 °C [13]. The relative humidity (RH) in this equation is given as the fractional water vapor pressure (from P/Psat = 0 to P/Psat = 1). As the total interaction energy caused by water everywhere between the surfaces is 1.4 × 10⁻³ J m−2 [13], the interaction energy due to capillary condensation can be calculated when the ratio of 'wetted' area to total area is known [5], figure 6.

Figure 6. The surface interaction energy due to capillary condensation can be calculated when the wetted area is known. The graph illustrates the height distributions of the respective surfaces. Adapted from [5], copyright IOP Publishing.
Download figure:
Standard image High-resolution imageThe effect of the molecular van der Waals forces is taken into account by calculating the surface interaction energy as AH / 24πz2, with AH the Hamaker constant of the contact material, and z the distance from the contact line [13]. At a very short distance, the van der Waals force becomes repulsive due to electron shell deformation, so a standard minimum distance of 0.165 nm is used. This means that the flat bearing line contact is taken into account in the model as this standard minimum distance of one atomic spacing. No contribution in the 'retarded regime' is taken into account further away than 20 nm. The value of the Hamaker constant used for the simulations is 4 × 10⁻¹⁹ J, which is more or less a worst-case value for nonpolar molecules in air. The real attraction is most probably lower, as we will also see in the discussion of the comparison of the model with experimental results in section 3.2. The higher value has been used here on purpose. Besides being the worst-case value, the high value also shows very clearly the interaction between the van der Waals and capillary adhesion.
For a discussion of the details and limitations of these models, see [5]. Here they are used to calculate the magnitude of the capillary condensation-induced adhesion energy, and that of the van der Waals force, for different surface realizations and contact pressures.
2.3. The adhesion distribution
Two routes may be followed to assess the adhesion distribution caused by the statistical variations between different realizations. One is to take a given contact line length, corresponding to a certain externally applied force between the surfaces, and then simulate the different adhesion magnitudes for the different realizations. The other approach is to assume no external force, but to use the adhesion itself as the driving force for obtaining the bearing area. In the latter case, we have to iteratively find the correct surface interaction energy, as the bearing line height a changes with the adhesion. Both cases are evaluated here with illustrative numerical values.
Figure 7 shows the adhesion distribution caused by stochastic variations for different given bearing lines and different adhesion contributions for the 256 nm long, 3 nmrms surface roughness, 10 nm correlation length surface with a bearing line of 11 nm (roughly 5% of the surface in direct contact). We see that the adhesive force is indeed different for different surface profiles generated by the same stochastic process. With increasing relative humidity (shown are RH levels of 10, 50, 80 and 90%) the capillary force becomes more and more long-range, causing a higher dependency of the average adhesion on the exact height of the bearing line. Although the adhesion distribution centered around a certain bearing line height is not so large, the distribution spanning all realizations is very large, predicting a wide spread of the adhesion values around the mean for any humidity. In figure 7(d) we see the cut-off of the capillary adhesion at 143 mJ m−2, corresponding to water everywhere between the surfaces.
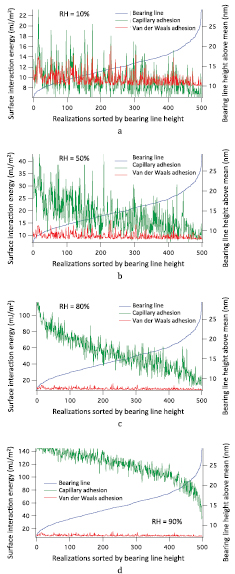
Figure 7. The surface interaction energy due to capillary and van der Waals attraction for 500 surface roughness profiles has been generated by the same stochastic process. Although all surface profiles are individual realizations of the stochastic process, they can be sorted by increasing bearing line height to show that the bearing line height has, on average, an effect on the adhesion. In particular, the capillary adhesion, which becomes long-range for high humidity, goes down with increasing bearing line height. (a) Low humidity, (b) intermediate humidity, (c) high humidity and (d) very high humidity.
Download figure:
Standard image High-resolution image2.4. Results from the theory: adhesion as a function of surface roughness and relative humidity
Figure 8 shows the capillary and van der Waals adhesion effect as a function of relative humidity for different contact line lengths, corresponding to the situation in which different loads are applied externally. The adhesion 'base levels' change with contact line length, but the variation in adhesion scales correspondingly. The capillary adhesion transition from low to high adhesion does not depend on the bearing line length. Parameters: 256 nm surface length, 3 nmrms surface roughness, 10 nm correlation length, ten realizations. The standard error indicated corresponds to one standard deviation. The reader may notice that the error bars in figure 8 and following tend to sometimes go over the 0.14 J m−2 line; this is an artifact of the graphing program, which assumes equal error bars on both sides of the mean.
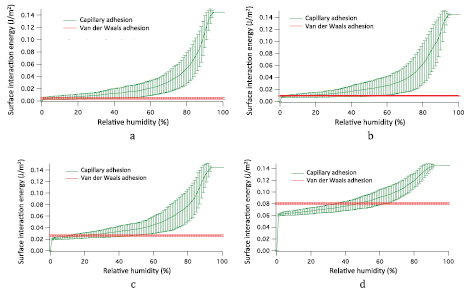
Figure 8. Capillary and van der Waals adhesion as a function of bearing line length, illustrative of the effect of an externally applied load: (a) 3 nm bearing line, (b) 10 nm bearing line, (c) 30 nm bearing line, and (d) 100 nm bearing line.
Download figure:
Standard image High-resolution imageFigure 9 shows the effect of van der Waals and capillary adhesion for different surface roughness values with a constant bearing line length of 10 nm. As expected, for low surface roughness contact, a much lower relative humidity is required to fill an appreciable part of the surface and cause high capillary adhesion. This transition from low to high adhesion shifts towards higher relative humidity values for rougher surfaces. Visible is the adhesion spread from realization to realization, which is a significant fraction of the mean of the expected adhesion in every point, except at very low or very high humidity. Parameters: ten realizations, 10 nm bearing area.
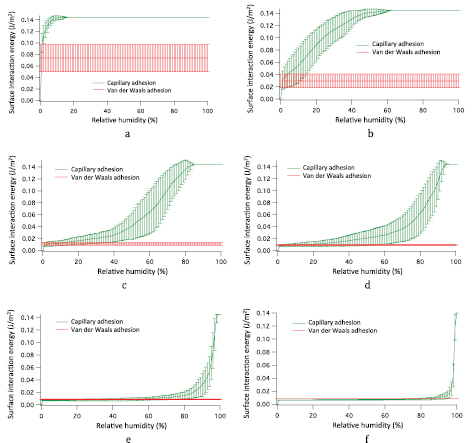
Figure 9. Adhesion variation as a function of relative humidity for a constant bearing line length and different surface roughness values: (a) 0.1 nm surface roughness, (b) 0.3 nm surface roughness, (c) 1 nm surface roughness, (d) 3 nm surface roughness, (e) 10 nm surface roughness, and (f) 30 nm surface roughness.
Download figure:
Standard image High-resolution imageFigure 10 shows the same type of results as figure 9, but now for the calculation without a priori bearing line. Instead, the bearing line is found in conjunction with the surface interaction energy. This is done by (1) calculating the energy it takes to fully plastically deform the asperities to arrive at the bearing line height, and (2) equating this with the surface interaction energy caused by the adhesive forces. This energy required for the plastic deformation of the surface until a certain bearing area is obtained is given by [4]. This is done by noting that the force F at any height x is F(x) = H ⋅ Ab(x), where H is the (height-independent) hardness of the surface and Ab(x) the bearing area. Ab(x) increases as the bearing line is chosen closer and closer to the mean surface height.
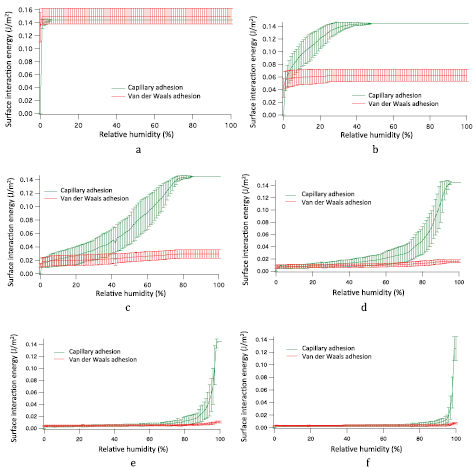
Figure 10. Adhesion variation as a function of relative humidity where the contact is governed by the plastic contact model. The adhesion force and contact geometry have been iteratively determined by using equation (1). (a) 0.1 nm surface roughness, (b) 0.3 nm surface roughness, (c) 1 nm surface roughness, (d) 3 nm surface roughness, (e) 10 nm surface roughness, (f) 30 nm surface roughness.
Download figure:
Standard image High-resolution imageThe integral of F(x) over space, coming from +∞ pressing to a certain bearing area at height a gives the deformation energy Ed(a) that it costs to deform the surface up to a bearing line height a as defined in section 2.1:

Note that equation (1) is not apparently contact size independent. The bearing height a depends on the size of the apparent contact length/area. This will be discussed in more detail in section 3.2, but for all the simulations in figures 7–10, 256 nm was chosen as the apparent contact length. For the simulation, the hardness H of silicon was chosen as 13 GPa. Arguably, only the surface layer is important, which may also be SiO2. As the hardness of silicon oxide is of the same order of magnitude, it does not change the results much.
2.5. Discussion of the theoretical results
From the simulation results of section 2.4, first of all we find the expected notion that the adhesion goes up with the relative humidity level, and that the transition from low to high adhesion takes place at lower and lower humidity if the surface roughness decreases. Whereas in figure 9 the contact area was kept constant, in figure 10 it increases with the amount of adhesion, in turn increasing the van der Waals contribution as well at high humidity levels. For low surface roughness values, this contribution can become a significant fraction of the humidity-induced adhesion. This is very visible e.g. in figures 10(b) and (c).
The most important result in the context of this paper, though, is the fact that we find an adhesion of which the standard deviation σ is roughly one half to one quarter of the mean adhesion over most of the range. This means that for a certain situation we can assume that 99.8% of the adhesion values encountered will be no more than 2.5 (mean + 3σ) times the average value being measured, and that a sample of ten measurements already gives a first estimate, both of the mean adhesion and the spread around the mean. This gives a good indication of the adhesion spread to expect in a batch of similar devices. The bad news is that this implies that a MEMS designer has to calculate with worst-case adhesion values that are a few times higher than the expected average value. The industry is used to the 6-sigma approach [14], in which it is assumed that values outside 6-sigma will hardly ever occur. This may be a valid road to follow here too.
However, a second important point is that, for typical MEMS surface roughness values, a situation may occur during operational life where the adhesion approaches the maximum. A typical example is a device that has spent considerable time in a warm, humid environment, after which it is suddenly cooled down, forcing the RH value in the cavity inside the MEMS package to increase (cold air saturates with less water than warm air). This will cause a maximum adhesion of 0.14 J m−2 due to the RH level approaching 100%, independent of the surface roughness, plus a significant fraction of this value due to van der Waals (figure 10). The latter becomes more important as the surface gets less rough. Excessively high surface roughness and a fully hermetic package may be of help here.
The graphs also suggest that these dangerous situations are not attained under typical ~50% humidity levels, except with really smooth surfaces. Therefore, environmental testing is a prerequisite when developing a high-reliability MEMS device with contacting surfaces.
This new adhesion variability analysis provides a profound insight into the adhesion distribution of identical MEMS devices coming from a single manufacturing process. Note that several aspects have not yet been taken into account. The mode of contact (elastic, plastic, a combination of the two) may have some influence on the outcome of the simulation. However, as the adhesion changes over orders of magnitude, the detailed calculation of the deformation and contact is not too relevant, as long as it gives numbers that are of the right order of magnitude. A more important omission is the fact that typical MEMS surfaces are not clean on the atomic level, and contain many third-body species, such as hydrocarbon contamination. Typically, this contamination increases the hydrophobicity, thereby preventing some of the capillary condensation from taking place. At the same time, this contamination layer is expected to be relatively soft, compared to the silicon or silicon oxide contact material used in the simulation. Therefore, the contact area may increase for typical, slightly contaminated surfaces, compared to the calculation results shown in figure 10. Lastly, it has been shown that adhesion of oxygen plasma cleaned SiO2 native oxide surfaces may show yet another effect due to plastic deformation: chemical bonds may be created across the interface when the two surfaces are crushed together, increasing adhesion. Upon repeated contact, the contribution of these chemical bonds presumably diminishes in relevance [15]. Although this last effect warrants much further study, the principles laid down in this paper regarding variability of adhesion are equally valid in a situation with significant cross-contact chemical bonding, which may be taken into account separately (with a very short distance range force) if required.
3. Comparison of the theory with measurements from the literature
3.1. Introduction to the measurement method
To illustrate the principles laid down above, we will compare the theory to experimental MEMS adhesion data available in the scientific literature. The problems that arise here are that (1) the apparent contact area is not accurately known because the local shape of the devices near the contact point is not known well, and (2) the surface height distribution function is not exactly Gaussian, especially in the all-important tails of the distribution. However, we will make the comparison anyway, and use the apparent surface area as a fit parameter. We also have to convert the experimental surface properties to 1D (extending the model to two 2D of course also works, but is much more computationally intensive).
Several studies (to be discussed later) have been reported where adhesion was measured on multiple MEMS devices simultaneously on the same wafer in a cantilever beam array (CBA) configuration. These CBA measurements are suited to checking the predictions of the adhesion variability model described above, as they are inherently probing multiple realizations at the same time. Not all authors have been aware of the relevance of the statistical variation though, so for the papers where only the mean value of adhesion is given, the standard deviation was inferred from the corresponding (interferometric) images of the adhered beams themselves.
The CBA technique is well known, and analyzed and explained in a host of papers (for a good analysis see e.g. [16]), hence the results will be used here without further discussion of the technique itself. Note that microscopic interferometry is usually employed to assess the nonsticking length of the beams, from which the surface interaction energy is determined. Beams that have a considerable length over which the beams adhere ('s-shaped beams') are more suitable than beams that are stuck only at the tip ('arc-shaped beams'), as in the latter case only the surface properties of a very small spot determine the overall outcome of the measurement.
The CBA measurements reported fall into different categories. In the oldest papers, an array of beams with increasing length was used, and the transition from adhering to not adhering was used to calculate the work of adhesion [17, 18]. These beams are almost always arc-shaped and hence, from a statistical point of view, less desirable. Also, the assessment of the sticking beams was typically performed in a scanning electron microscope (SEM) under vacuum, so that the capillary condensation part of the adhesion was mostly absent.
As more and more of the conditions governing adhesion became known, the measurements have become more sophisticated. An extra electrode under the beams is used to actuate the beams downward, so that they can be made to touch the surface underneath during operation. In this way the 'in-use stiction' is probed, instead of the 'release-related stiction'. The latter is heavily dominated by the aggregation of impurities in the drying fluid ('coffee stains'), and is more a yield problem than a reliability hazard. It has been largely overcome by the use of supercritical CO2 drying [19] and the creation of SAM (self-assembled monolayers) coatings in the liquid phase [20]. Most studies have targeted the antistiction properties of add-on layers, such as SAM, Teflon-like [21] or atomic layer deposition (ALD) coatings [22]. In particular, the stability of SAM-coatings under high-humidity and high-temperature stress has been comprehensively studied [23].
Modern comprehensive studies include a roughness measurement, actuation to get the beams in contact, multiple beams of the same kind to obtain statistics, and a humidity and temperature controlled environment. A good early example is the work of de Boer et al [23], while a newer, very insightful study is described by Xue et al [24]. The latter have varied both humidity and surface roughness in their CBA measurements, which makes their study ideal for verification of the model presented in the current paper. Therefore the Xue et al [24] data have been used as the basis for our comparison.
3.2. Theory of the measurement method
An important question is which part of the contact area of a stuck beam of a CBA governs the adhesion properties. Clearly, the adhesion properties of the far end of the beam, far away from the point where the beam comes into contact, will have little influence on the shape of the beam.
If we look in 2D, the real area of contact, AR, is related to the adhesive force FN and the hardness H as [25]

The fraction of the surface in actual contact is the ratio of the real area AR and the apparent contact area AC. AC represents the total area that appears to be in contact from a macroscopic point of view. When the flat surface is brought in from a distance ∞ to the rough surface with surface height distribution function h(x), units (1 m−1), it will crush into this surface, plastically deforming it, down to position a, which is the position where the bearing area is large enough to sustain the load. The larger AC, the larger the amount of surface available far away to make the flat plane stop at a high value of the bearing area height a. Based on equation (2), we can describe the position a as the fraction of the area that is really in contact, that is, the ratio of AR and AC, as

Equation (3) shows that the bearing area height line a is a function of the ratio of AR and AC. This means that the adhesion value measured is not independent of the apparent surface area. For lack of a better measure, we will use the ratio AR/AC as a fit parameter of the model, where we previously just fixed the total contact line length at 256 nm. For simplicity we will adhere to the assumption of a Gaussian distribution of surface height, though.
A final note should be made on the interpretation of uncertainties reported in the literature. Typically a number of beams are measured from which a mean adhesion value and its standard deviation are derived by investigating the length the nonadhering part of the beam. This is not the same standard deviation as the one modeled in the current paper. Here, the standard deviation is derived from the distribution that describes the possibility of a single measured beam having a certain adhesion value, while in the experimental papers, all measurements are used to obtain a single mean, and a single standard deviation of the mean (the standard error) describing the precision with which the mean is known. This reported standard deviation goes down with an increasing number of beam measurements, while the one that is the subject of the current paper obviously does not. To obtain the distribution of the measured adhesion values, we have to go back to the original data: either by (1) using the individual adhesion values determined by the authors, by (2) multiplying the standard deviation of the mean obtained by them by the square root of the number of beams measured, or by (3) extracting it from the interferograms of the CBAs themselves.
3.3. Comparison of the new adhesion distribution model with the experimental data of Xue et al [24]
Figure 11 shows an example of the interferograms of the CBA measurements as reported by Xue et al [24]. Adhesion clearly increases with relative humidity, and the spread of the adhesion between the beams causes a corresponding spread in the 'detachment length' s over which the cantilever beams are free from the substrate.

Figure 11. CBA measurements as a function of humidity reported by Xue et al [24], 2008 Measurement and modeling of adhesion energy between two rough micro electrical (MEMS) surfaces J. Adhes. Sci. Technol. 22 429–55, copyright Taylor & Francis Ltd. (www.informaworld.com), reprinted with permission of the publisher. (a) 90% RH, (b) 80% RH, (c) 70% RH, (d) 45% RH.
Download figure:
Standard image High-resolution imageFigure 12 shows the surface interaction energy measured by Xue et al as a function of humidity for three different surface values of roughness. The uncertainties given in this figure have to be multiplied by √n, with n the number of beams used for the measurement point. As most of the time not all 26 beams in the experiment were useable, √n is maybe around 4 (private communication with the first author), with which we have to multiply the quoted uncertainty to describe the distribution of the individual adhesion values.
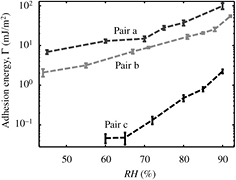
Figure 12. Surface interaction of silicon cantilever beams with an effective roughness (one surface assumed flat) of 1.5 nm (pair a), 3.2 nm (pair b) and 5.7 nm (pair c) respectively, measured by Xue et al [24] 2008 Measurement and modeling of adhesion energy between two rough micro electrical (MEMS) surfaces J. Adhes. Sci. Technol. 22 429–55, copyright Taylor & Francis Ltd. (www.informaworld.com). The standard deviation reported in this figure has been adjusted in figure 13 to reflect the uncertainty in the individual adhesion values, instead of the uncertainty of the mean value given in this figure 12, a procedure required as explained in section 3.2 of the current paper. Reprinted with permission of the publisher.
Download figure:
Standard image High-resolution imageTable 1 shows, extracted from their data, the effective surface roughness, the relevant contact length, and the correlation length. The correlation length is not explicitly given in the paper, they quote the areal density of asperities η (in 1 μm−2) instead. If we assume that two neighboring asperities fall just outside the correlation length, the correlation length can be estimated as 1/√ η to go from 2D to one.
Table 1. Surface and adhesion parameters of Xue et al [24].
| Effective equivalent surface roughness Rq (nmrms) | Correlation length (nm) | Effective contact length for proper fit (μm) | |
|---|---|---|---|
| Pair a | 1.7 | 121 | 1.75 |
| Pair b | 3.4 | 212 | 2.8 |
| Pair c | 5.7 | 143 | 10 (no good fit) |
Also important here is the value of the Hamaker constant AH, governing the magnitude of the van der Waals forces. In air, typical values are between 1 × 10⁻²⁰ J and 4 × 10⁻¹⁹ J. However, the measured values in water (which is the case when capillary condensation is present as well) are around ten times lower; for silicon, see for example [26]. In the current simulations we find the best fit when the Hamaker of the material of the surfaces, with water as the medium in between, is 4 × 10⁻²¹ J, indeed reflecting this lower interaction.
Figure 13 shows how these data fit in the model described above. Based on these results it has to be concluded that even the very simple contact mechanics model based on plastic deformation describes the measurement data quite well. Both the measured average surface interaction energy value and its spread from device to device correspond favorably with the simulation: the adhesion spread from device to device shows a good visual agreement between theory and measurement (figures 13(a) and (b)). The exact contact mechanics model used appears to be less important than the effect of humidity and the spread in adhesion values caused by the statistical differences between nominally identical surfaces.

Figure 13. Comparison of the measurement results of Xue et al [24] with the current model. (a) 1.7 nm effective roughness, (b) 3.4 nm effective roughness, (c) 5.7 nm effective roughness. Taken from Xue et al 2008 Measurement and modeling of adhesion energy between two rough microelectrical (MEMS) surfaces J. Adhes. Sci. Technol. 22 429–55, copyright Taylor & Francis Ltd. (www.informaworld.com). Reprinted with permission of the publisher.
Download figure:
Standard image High-resolution image
In the case of figure 13(c), with more surface roughness, the agreement between the model and the measurements is not good. Only at very high humidity do the model and the measurements coincide. It is important to notice that at these low interaction levels, the exact shape of the surface roughness distribution functions starts to play a role: it is highly probable that the Gaussian distribution with exponential autocorrelation function used for the current model does not describe the far tails of the real experimental distribution well, while this is where the contact takes place for very rough surfaces under light loading conditions. Determining these surface roughness properties experimentally, or using a multi-lengthscale model is expected to give a better fit in this case.
4. Conclusions
In this paper, we have seen that a simple plastic contact mechanics model for rough surfaces, combined with Monte Carlo simulation of rough surfaces drawn from the same stochastic process, provides an excellent way to describe the adhesion between rough MEMS surfaces. Both the mean value and the device-to-device spread of the surface interaction energy fit the experimental data from literature well. Only at very high surface roughness does the description break down, as a simple Gaussian distribution of surface heights with an exponential autocorrelation function is then insufficient to describe the highest points of the surface where the interaction takes place.
Acknowledgments
This work was sponsored by the Dutch funding agencies FOM in the 'fundamental aspects of friction' program under ref. no. 129, and the NWO-STW in the 'vidi' program under ref. no. 10771.