
Abstract
A three-dimensional constitutive model for shape memory alloys (SMAs) is developed along the lines of the Stebner–Brinson (SB) implementation of the Panico–Brinson model. Plastic kinematic hardening behavior is simulated in addition to elastic deformation and phase transformation. A series of finite element simulations is carried out using this model to investigate the localization effects of the stress and strain field on NiTi plates with structured arrays of pores. The application of this model on porous architectures provides insight into how geometric features influence the mechanics of the structure. The incorporation of plastic deformation shows a marked decrease in the maximum stress levels; these results are more consistent with experimental data as compared to the original SB model. Furthermore, the new results demonstrate that clustered pores lead to more distributed stresses and transformation compared to a dispersed configuration of pores, indicating the importance of pore geometry in determining the stress and strain distribution. The improved model provides a practical tool toward design and optimization of porous SMA structures.
Export citation and abstract BibTeX RIS
1. Motivation
Porous shape memory alloys (SMAs) have drawn increasing attention in the past years due to their unique properties as well as their potential for applications in foam architectures. The thermo-mechanical behaviors of SMAs, such as superelasticity and the shape memory effect, have enabled many unique applications of SMAs in the aerospace and biomedical engineering fields, such as remote deployment, actuation, and sensing devices [1–4]. Moreover, the foam architecture of porous SMAs has provided additional beneficial properties [5–7]; one important realization is the porous SMA-bone implant. The porous structure allows for a high strength and tailorable modulus as well as bone tissue ingrowth and vascularization [5, 8, 9]. SMA foam structures have also been observed to possess superior energy dissipation capacity and damping behavior in shock absorbing devices [10].
Advanced processing technologies have made it possible to create various types of porous SMA structures, including amorphously porous foams and structures with architectured arrays of micro-channels [11–13]. But these techniques still lack quantitative analyses and designs needed for applications due to irregularities in foam size, shapes, and complex distribution of pores. Recently, x-ray tomography has been applied to provide three-dimensional (3D) structural information about porous SMAs [14] that can be used for numerical analysis, permitting a direct comparison between experiments and theoretical prediction. However, deformation mechanisms around the pores are still poorly understood, thus reinforcing the need for efficient numerical tools to analyze and design porous SMA structures.
In the past decades, extensive numerical simulations and theoretical models have been developed to study the complex pore structures of SMAs. However, in most of these studies, reorientation, which is a key factor for non-proportional loading in the porous structures, has been neglected [7, 15]. Additionally, most investigations focus the response of certain microstructures with specific pre-determined architectures instead of arbitrary configurations of pores. Recently, the Stebner–Brinson (SB) implementation of the Panico–Brinson SMA constitutive model [16] was proposed to characterize the coupled elastic and transformation behavior of SMAs with high accuracy, including the effects of reorientation [17]. With the aid of this framework, finite element studies examined several simplified arrays of pores and the isolated and coupled mechanics of elastic and transformation fields [18]. This investigation provides a good understanding of the design and optimization of porous SMA structures. However, localized plasticity was neglected in this model, which is important [19–22] even at low macroscopic loads due to stress localization near and between the pores [18, 23, 24]. Therefore, in this study, a combination of plasticity and reorientation is used to guide the design and optimization of SMA foams based on a model that incorporates orientation, reorientation, and plasticity.
In this work, the SB model is extended by incorporation of kinematic hardening theory to account for plastic strain at high localized stresses. Following this, a series of finite element studies is conducted on two-dimensional (2D) NiTi plates with idealized arrays of pores. This newly developed framework is an elastic-transformation-plastic constitutive model of SMAs. The paper is organized as follows: section 2 provides a brief review of the elastic-transformation-plastic constitutive model; section 3 describes the simulation details with results presented in section 4; section 5 consists of the discussion of results; and conclusions and future scope are examined in section 6.
2. The elastic-transformation-plastic constitutive model
The modified elastic-transformation-plastic constitutive model of SMAs is based on the SB model [17], which is a 3D SMA constitutive model that simulates elastic deformation, phase transformation, and reorientation [16]. For convenience, hereafter, we will refer to the new elastic-transformation-plastic model as the 'modified SB' model and the previous as the 'original SB' model. The base elastic and transformation/reorientation behaviors of the constitutive model are retained from the original SB model, as detailed in references [17, 18]. In this section, we will elaborate on the new plastic behavior implementation first then include the framework of the overall model.
Kinematic hardening plasticity is adopted in this model, as it is experimentally observed that the center of the yield surface experiences a motion in the direction of the plastic flow [25]. The basic assumptions and definitions are introduced as follows [25, 26]. The relevant stress in plastic deformation measured from the center of the yield surface  is defined as the stress difference between the deviatoric stress
  and the back stress
  . Back stress indicates the center of the yield surface in deviatoric stress space, with an initial value of zero:

The von Mises yield surface satisfies the Huber–von Mises yield condition, i.e.:

where  is the uniaxial equivalent yield stress, which is a constant for kinematic hardening model. The normal to the von Mises yield surface can be written as:

which satisfies:

because the stress must remain on the yield surface during active plastic loading.
The plastic part of the strain rate is normal to the von Mises yield surface and thus parallel to  scalar measurement of the equivalent plastic strain rate is therefore written as:

The kinematic hardening constitutive model is integrated in a rate form, and the increment of the scalar multiplier  is defined as:

where  is the strength coefficient in kinematic hardening plasticity and,
  is the Lame parameter.
Outlined above is the algorithm used for plastic deformation, which is integrated into the framework of the original model as the modified SB model. In this modified model, the strain is composed of elastic and inelastic constituents, where the inelastic strain can be further divided into transformation and plastic strains. The transformation strain is also subdivided into orientation and reorientation strains. Equation (7) shows the relationship between all the strain components:

Similar to the original SB model, two internal variables  and
and  govern the evolution of phase transformation and inelastic strains in the model and represent the volume fractions of oriented (σ), i.e., 'detwinned,' and self-accommodated (SA), i.e., 'twinned,' martensite. The total strain
  and absolute temperature
  drive the process as control variables. The model is formulated as an expression of Helmholtz free energy considered through the Clausius–Duhem inequality and assumed evolution laws (equation set 9). The driving forces (equation set 8) and Kuhn–Tucker conditions (equation 11) are derived, including those for the coupled plastic strain [16, 17].
Driving forces:
Evolution equations:
Limit functions ( ) (including kinetic relations):
Kuhn–Tucker conditions:

where subscript α takes on the values  .
.
It is pointed out that the limit function of plasticity is equivalent to the von Mises yield criterion in plasticity. During computation, the limit function of plasticity is first checked and, if not satisfied, the calculation proceeds in the order of reorientation, orientation, and self-accommodation. A detailed flowchart of the algorithm is presented in figure 1. Although plastic flow and transformation can happen simultaneously within the framework, concurrency is not adopted in the current algorithm, since we lack exact experimental data to verify the proportions, process, and mechanisms of such a split. The current limitation to sequential deformation behaviors can be addressed with relevant experimental data.

Figure 1. Algorithm of the elastic-transformation-plastic model.
Download figure:
Standard image High-resolution imageA user subroutine VUMAT [26] is written based on the model and then implemented into Abaqus/Explicit, which will be used in the following simulations.
3. Simulation details
The material properties and kinetic tuning parameters used in the simulations are listed in table 1. In addition to the common parameters used in the original SB model, two more parameters are introduced due to plasticity: the yielding stress  and strength coefficient
  . The values of model parameters from the original SB publication [18] are retained in this work, which represent reasonable values for commercially available NiTi [17]. A comparison of the superelastic response of the modified and the original SB models running for a uniaxial test on a single element is shown in figure 2. Finite element (FE) samples created for Abaqus simulation of localized response near pores are very similar to that used previously [18]. It is assumed the through-thickness deformations are uniform, and 2D plane stress simulations are adopted. As depicted in figure 3, the basic specimen is a rectangular plate of 25 mm gauge length and 3 mm width. Uniform arrays of pores (one, two aligned, 2 × 2 array, and 4 × 1 dispersed array) with diameters of 0.5 mm are placed at the central part of the sample. For the pore arrays, the distance between the pore centers is chosen to be 1 mm, which describes a locally constant porosity case. To avoid numerical error due to the free boundaries of pores, the pores are modeled as parts in Abaqus with a material property similar to air. The plates are constrained with rollers on one end, and axial displacement controlled extensions of 1 mm are applied at the other end at a rate of 0.1 mm s−1. Since the temperature is set at 300 K, which is higher than the austenite finish temperature (288 K, see table 1), these specimens are expected to display a superelastic response.
Table 1. Material properties and kinetic tuning parameters of simulation.
| Property | Value | Parameter | Value |
|---|---|---|---|
| E | 70 GPa | Yre | 40 MPa |
| υ | 0.4 | Hσ | 200 J kg−1 |
| ρ | 6.45 g cm−3 | Cf | 100 MPa |
| Ms | 258 K | Cr | 100 MPa |
| Mf | 248 K | Ar | 0 MPa |
| As | 278 K | K | 3000 MPa |
| Af | 288 K | ||
| CA,M | 5.5 MPa K−1 | ||
| εmax | 0.05 | ||
| σ0 | 600 MPa |
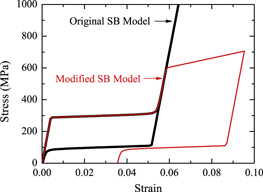
Figure 2. Comparison of superelastic response of the modified and original SB model.
Download figure:
Standard image High-resolution image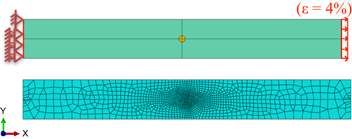
Figure 3. The model of the single pore SMA plate and the boundary conditions used in the simulations (top) as well as the mesh resulting from seeding 30 nodes about the pore (bottom). See section 3 for further details.
Download figure:
Standard image High-resolution imageA non-uniform mesh is created in Abaqus, where the mesh is finer around the pores and coarser away from pores. The elements are predominantly four-node plane stress elements (CPS4R) but are also composed of some three-node plane stress elements (CPS3R) due to the irregular geometrical shape. Mesh refinement is performed to ensure convergent results.
4. Results
4.1. Monolithic model
A monolithic plate specimen is first examined to obtain a baseline for the pore-free case. As expected, the distribution of axial and transverse stresses as well as true strains are all uniform, as is the evolution of the martensitic volume fraction. Simulations are run with both the modified SB model and the original SB model VUMAT for comparison, with a detailed discussion presented in section 5.2.
4.2. Single pore model
Axial and transverse stress and strain distributions of the single pore plate with the modified SB constitutive model are presented in figure 4. Stress and strain distributions and localization due to the presence of the single pore defect are clearly seen. Also, the strain field is observed to have a wider distribution throughout the plate as compared to the more concentrated stress field.
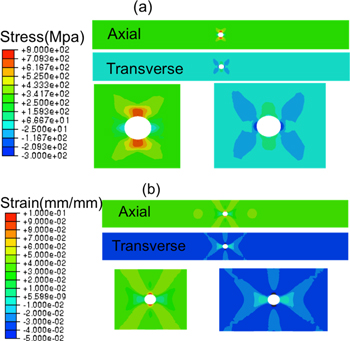
Figure 4. Axial and transverse stress (a) and strain (b) distributions in the single pore plate with the modified SB model at maximum load.
Download figure:
Standard image High-resolution imageFigure 5 shows the distribution of each strain component viz. orientation, reorientation, and plastic strain in the single pore plate using the modified model. It is observed that orientation strain is the most widely diffused, while the reorientation and plastic strains are localized. Reorientation strain reflects the zone experiencing non-proportional loading, and although small in magnitude, it plays an important role for those near-pore elements. As expected, plastic strain is also very localized and has a large magnitude for elements at the top and bottom of the pore. Figure 6 depicts the extent of phase transformation in the single pore plate. Slow and homogeneous transformation can be seen away from the pore, while the transformation around the pore is fast and non-uniform.
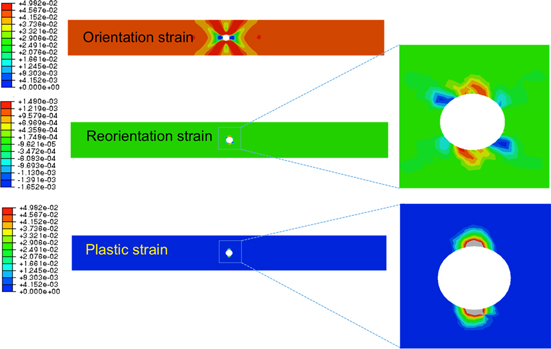
Figure 5. Decomposition of orientation, reorientation, and plastic strain in the single pore plate with the modified SB model at maximum load.
Download figure:
Standard image High-resolution image
Figure 6. Oriented martensitic volume fraction evolution in the single pore plate with the modified SB model (total time equals to 10).
Download figure:
Standard image High-resolution image4.3. Two-pore model
In the two-pore model, two pores are horizontally placed with a spacing of 1 mm, measuring from pore centers. The axial and transverse stresses and strains are shown in figure 7 and a snapshot of the transformation field in figure 8 (a), along with snapshots of other pore array cases. By comparing the fields around the pores with the single pore result (figure 4), it is found that there is clear interaction between the pores (figure 7). Using the concepts of superposition from linear elasticity, an artificial 'superposition' result for the stress field in the two pore case is demonstrated in figure 9. The coupled, nonlinear nature of the stress and phase transformation responses in figures 7 and 8 are clear. For example, there is a larger band of elevated stress arching over and below the interacting pores in figure 7, which is missing in the superposition approach. Additionally, the very high stress region between the pores seen in the superposition in figure 9 is artificial, whereas figure 7 indicates a type of mutual shielding effect between the two pores. This comparison underscores the importance of nonlinear coupling in porous SMA response.
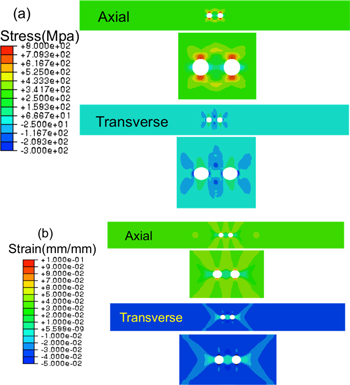
Figure 7. Axial and transverse stress (a) and strain (b) distributions in the two-pore plate with the modified SB model at maximum load.
Download figure:
Standard image High-resolution image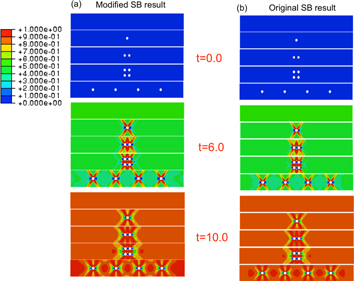
Figure 8. Oriented martensitic volume fraction evolution in the five plates with the modified SB model (a) and the original SB model (b) (total time equals to 10).
Download figure:
Standard image High-resolution image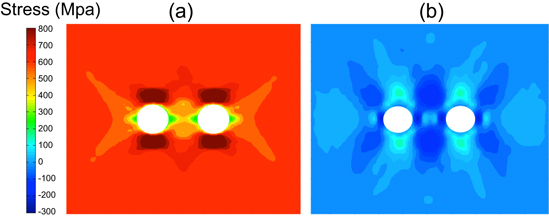
Figure 9. Artificial linear superposition result of two pores from the single-pore simulation results: (a) axial stress and (b) transverse stress. Contrast with figure 8.
Download figure:
Standard image High-resolution image4.4. 2 × 2 pore array
For the 2 × 2 pore array, the spacing between the pores measured from pore centers is 1 mm, both in the horizontal and vertical directions. Again, axial, transverse stress, and strain fields as well as the transformation process are reviewed (figures 10 and 8 (a)). A simple linear superposition result of the single pore case for this geometry is displayed in figure 11. Again, a much stronger interaction and shielding effect is observed in the fully coupled calculations for the 2 × 2 pore sample (figure 10), compared to the linear superposition result (figure 11). In figures 8 and 10 a strong interaction between the pores is seen, with a resultant intensification of the local fields vertically between the pores.

Figure 10. Axial and transverse stress (a) and strain (b) distributions in the 2 × 2 pore array plate with the modified SB model at maximum load.
Download figure:
Standard image High-resolution image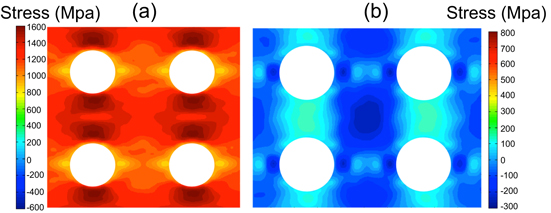
Figure 11. Artificial linear superposition result of four pores from the single-pore simulation results: (a) axial stress and (b) transverse stress. Contrast with figure 11.
Download figure:
Standard image High-resolution image4.5. 4 × 1 pore array
A finite element model with four dispersed pores along the length instead of four clustered pores is also simulated for comparison. A very weak coupling between the pores is observed from the stress and strain distribution (figure 12). As expected, the behavior around each pore is not very different from the single pore result and very similar to a linear superposition result (not shown).

Figure 12. Axial and transverse stress (a) and strain (b) distributions in the 4 × 1 dispersed pore array plate with the modified SB model at maximum load.
Download figure:
Standard image High-resolution image5. Discussion
5.1. Comparison between simulation and experimental results for single pore NiTi plate
The stress and strain fields of the single pore NiTi plate with the modified SB constitutive model are shown in figure 4. Digital image correlation (DIC) [27] experiments on a single pore specimen with the same dimensions and loading were performed [28] as a direct examination of the simulation results. The axial and transverse strains from DIC are exhibited in figure 13, with the same viewport as the FE result. Of particular note is the strain field of three nodes that lie in three typical locations (marked as 1, 2, and 3 in figure 13) around the pore. Region 1 is a location with very high axial strain deformation and very low transverse strain on the strain field map just below the pore, radiating outwards at 45°. Farther away in region 2, which lies directly below the pore, is a region of low axial strain. Region 3, also lying in the 45° radiation line from the pore but farther away than region 1, is a location with moderate strain intensity. Both experimental and simulation results support these observations, as is shown in figure 13.

Figure 13. Axial and transverse strain distributions in the single pore plate obtained from the DIC (above) and the modified SB model (below) at maximum load.
Download figure:
Standard image High-resolution image5.2. Comparison of the modified and original SB constitutive model
To understand the impact of plasticity in the modified model, the simulation results are compared with the original model. Figure 14 shows the stress and strain distributions of the same single pore plate using the original SB model, at the same scale as in figure 4 for better comparison. While the overall deformation and stress patterns are very similar, the maximum stress is much lower, and the maximum strain is larger in the modified model, in accordance with realistic material behavior, in particular localized plasticity. This conclusion is also supported by the results of other samples.
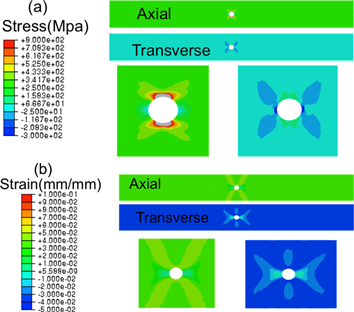
Figure 14. Axial and transverse stress (a) and strain (b) distributions in the single pore plate with the original SB model at maximum load.
Download figure:
Standard image High-resolution image5.3. Comparison of phase transformation evolution
Figure 8 (a) displays the martensitic volume fraction in the five new simulation geometries at three loading steps. There are some common features across the five cases: the scales of transformation are almost the same in the bulk away from defects, and the transformation proceeds quickly near the defects themselves. There is also a trend of increased heterogeneity with an increasing number of defects throughout the loading.
As a comparison, figure 8 (b) shows the results from the same steps using the original SB model. They resemble the new results very strongly at first glance; however, some important differences exist—the percentage of transformation from the modified model is larger than the original result (most obvious in the 4 × 1 pore array plates at t = 10.0, as shown in figure 8). This result occurs because in the modified model, the stress is less localized and more distributed, leading to broader transformation. This result is important for fully porous SMAs, as it implies a more uniform state of transformation can be achieved with proper pore distribution.
5.4. Comparison of stress, strain, and localization
Maximum stress is a very important variable in the design and optimization of porous SMA structures. Figure 15 shows the locus of the maximum stress for each model along the von Mises stress–strain response. The red boxes mark the maximum stresses in modified models, and black ones mark the original results. It is observed that the maximum stresses have been greatly reduced by using the modified model with plasticity. The maximum stresses in the five samples are also reordered with the inclusion of plasticity—the single pore sample, which possesses the largest maximum stress among the five with the original model, now has a smaller maximum stress compared to the two-pore sample and the 2 × 2 array sample. With the modified model, the geometry with the largest maximum stress is the two-pore sample. Therefore this simulation tool can be used to optimize geometric layout of pores for optimal transformation and minimizing plasticity effects.
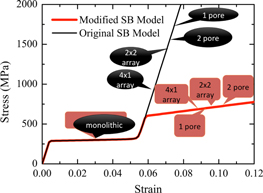
Figure 15. Comparison of maximum von Mises stress at maximum load with modified (red) and original (black) SB model in the five plates.
Download figure:
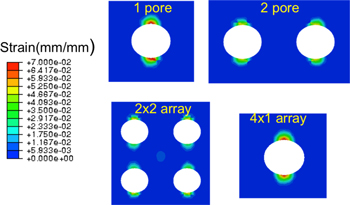
Standard image High-resolution imageThe axial plastic strain distribution is examined visually in figure 16 and tabulated in table 2, including the area fraction of plastic zone per pore. As shown in the figure, the maximum plastic strain in isolated pore structures is higher because clustered pores provide a better distribution of the load and reduce localization. At the same time, there is a larger area fraction of plastically deformed material about each pore in clustered pores due to the more distributed strain fields.
Figure 16. Comparison of plastic strain distribution in the porous plates with modified SB model at maximum load.
Download figure:
Standard image High-resolution image
Table 2. Comparison of maximum plastic strain and area fraction of material with plasticity per pore.
| Specimen | Maximum plastic strain | Plastic zone per pore (area fraction) |
|---|---|---|
| Monolithic | 0 | 0 |
| 1 pore | 7.524% | 0.477% |
| 2 pores | 5.630% | 0.515% |
| 2 × 2 array | 5.805% | 0.582% |
| 4 × 1 array | 7.169% | 0.452% |
6. Conclusions
In this paper, an elastic-transformation-plastic constitutive model of SMAs is created by incorporating kinematic hardening theory into the original SB model. The newly developed framework is verified by comparison of simulation results to experimental DIC strain field results. The model is then applied to a series of Abaqus simulations in 2D NiTi plates with different configurations of pore arrays. The conclusions drawn from this work help provide a deeper insight into the underlying transformation mechanisms of porous SMA structures and provide a tool to aid in the design and optimization of pore architectures in SMAs.
First, the modified model with plasticity provides more accurate results, especially with respect to predicting realistic hardening and maximum stress as well as a more dispersed stress concentration state as compared to the original SB model. Additionally, the studies show a complex nonlinear interaction effect between pores rather than a mere superposition. No direct trend is observed between the maximum stress and the volume fraction of pores, suggesting that the geometric configuration of pores is of paramount importance. It is also observed that clustered pores can lead to more broadly distributed stress states, while dispersed pores can lead to locally higher plasticity effects.
Finally, it is important to note that only limited applications of this model have been demonstrated. More cases need to be explored to fully understand the mechanics in SMA foams, the influence of length scales of pores and spacing, and more complex sample geometries and loading methods. A constitutive model that characterizes simultaneous transformation and plasticity is also being addressed in an upcoming work in the immediate future.
Acknowledgments
PZ and AS acknowledge the funding through fellowships from the Predictive Science and Engineering Design Cluster at Northwestern (PSED). The authors also gratefully acknowledge Mr Partha Paul for proofreading the original manuscript.