

Abstract
A MEMS squeezer able to compress single living cells underwater until rupture was designed and tested. The relatively large motion range of the device in aqueous media (~2.5 µm) allows provoking cell disruption while measuring cell mechanical properties before and after membrane rupture. An AC driven electrothermal micro actuator with mechanical amplification pressed single cells against a reference back spring. Deformations of the cell and the reference spring were measured with nanoscale resolution using optical Fourier transform techniques. The motion of the reference spring divided by the cell deformation provides the cell stiffness relative to the reference spring constant. An abrupt change in the cell stiffness and the appearance of cracks indicated the cell wall rupture force was reached. A total of 22 baker's yeast cells (Saccharomyces cerevisiae) were squeezed with the micro device. The average force necessary to rupture the cell membrane was 0.47 ± 0.1 µN. Before rupture the cells had an average stiffness of 9.3 ± 3.1 N m−1; the post-rupture stiffness dropped to 0.94 ± 0.57 N m−1. Cell hysteresis was also measured: cells squeezed and released before reaching the rupture force showed residual deformations below 100 nm, while cells squeezed past the rupture force and then released showed residual deformations between 490 and 990 nm.
Export citation and abstract BibTeX RIS
1. Introduction
Cell mechanobiology is the study of the relation between cell mechanics and biological functions. It is known that mechanical loads experienced by a cell can influence cellular processes such as cell differentiation and migration [1]. Moreover, a cell's mechanical properties are often related to its biological state [1]. For example, the conversion of fibroblasts from sessile to motile states is associated with a dramatic reduction in cell stiffness [2]. Many studies have reported changes in cell Young's Modulus and stiffness associated with diseases including diabetes [3] and cancer [4]. For example, increased stiffness of red blood cells in malaria [5] and sickle cell anemia compromises those cells' ability to squeeze through small capillaries contributing to the pathology of these diseases [6]. Leukemia-derived T-lymphocytes have an elastic modulus only about half of normal T-lymphocytes [7]. Also, decreased stiffness of metastatic cancer cells [5] may contribute to their invasiveness [8]. Thus measurements of cell stiffness may provide a sensitive tool for early diagnosis of such diseases. Another important mechanical characteristic of a cell is its membrane rupture force threshold. Cell lysis or membrane disruption may be carried out experimentally to allow the retrieval and analysis of intracellular molecules such as DNA and proteins [9] but it is also a mode of cell death in response to developmental or pathological processes wherein it is associated with changes in cell stiffness [10]. Microfluidic devices have been designed specifically to provoke cell lysis. Kim et al [11] used a micro fabricated spinning chamber filled with micro-beads to cause the disruption of mammalian cells (CHO-K1), bacteria (Escherichia coli), and yeast cells (Saccharomyces cerevisiae).
There are several well established techniques for measuring single cell mechanics such as micropipette aspiration [12], atomic force microscopy (AFM) [13], optical tweezers [14], and microplate compression [15]. All of these techniques perform an off-plane interaction between the cell and the actuation [16]. Micropipette aspiration is the most common and measures global properties of the cell (higher contact area), while AFM provides cell wall local measurements with resolution on the order of nanometers. One commonly tested cell is S. cerevisiae (baker's yeast) which is a eukaryotic simple cell, robust, and easy to cultivate [17]. Studies have investigated the mechanical properties of this type of cell using different methods [15, 18–22]. For example, Smith et al [15] measured a yeast cell stiffness of approximately 11 N m−1 using the microplate compression, while Arfsten et al [22] reported an average cell spring constant of 0.32 N m−1 performing AFM nanoindentation. Results from the microplate compression indicated a rupture force between 50 and 250 µN and a breaking strain of more than 50% [15, 20, 21]. On the other hand, an AFM cantilever driven by a robotic nanomanipulator measured a cell penetration force in the 0.09–0.23 µN range [18]. This significant rupture force difference is likely due to the much lower contact area of the AFM probe.
Micro-electro-mechanical systems (MEMS) are micro fabricated devices that can sense and/or provide motions in the micro and sub-micro scale. Recently, MEMS have been investigated as a promising complementary tool for measuring the mechanical properties of single living cells [16, 23]. The main advantages of using MEMS over the non-MEMS techniques are their larger force range (higher flexibility) and their well-defined load and contact area conditions [16]. Moreover, MEMS can provide an in-plane single cell test system, mid to high displacements range, and all the advantages derived from microfabrication such as batch production, low energy demand, quick response, and chip integration [16]. MEMS can also directly stimulate (push or pull) the cell with no need of functionalizing beads (e.g. magnetic or optical beads) [23]. A number of different processes are available to manufacture MEMS. For example, polysilicon multi-user MEMS processes (PolyMUMPs) is a surface micromachining process that produces MEMS with moving structural layers located a few microns above the fixed substrate [24]. PolyMUMPs has two moving polysilicon layers (POLY 1 and POLY 2) with minimum in-plane feature sizes of 2 µm and thicknesses of 1.5–2 µm. Such processes can be used to fabricate microscopic actuators of different working principals such as thermal, electrical, and electro-magnetic.
MEMS designs have been used to measure mechanical characteristics of single cells, below we give examples for a number of cell types. Serrel et al [25] used a micro fabricated cell stretcher mechanically driven by an off-chip micro manipulator to test a single cell. The authors reported the linear force response of a hamster fibroblast (~50 µm size) up to 1.3 µN. Yang and Saif [26–28] used an off-chip piezo actuator to indent multiple monkey fibroblasts (~35 µm size). The cells showed a linear force response up to 0.4 µN when the fibroblasts started deforming plastically and showed hysteretic response during unloading. Zhang et al [29] used an on-chip electrothermal chevron actuator to compress one NIH3T3 fibroblast (~16 µm size) in cell medium by 25% of the cell initial size. Canine kidney cells were stretched by an on-chip electrostatic MEMS device in biological media [30]. The cells (~20–40 µm size) showed stiffness on the order of 0.1 N m−1. Subsequent work [31] included measurements of hysteresis and viscoelasticity of the cells. Cardiac myocytes (~20 µm size) forces in the range of 10–200 nN were measured using a micro fabricated pillar array [32, 33]. A monolithic MEMS microgripper consisting of an electrothermal actuator and electrostatic sensors was used to squeeze porcine aortic valve interstitial cells (PAVICs) [34]. A 15 µm PAVIC cell was deformed by 15% by a gripping force of 100 nN. The authors reported cell rupture. Mouse zona pellucida oocytes and embryos (~50–60 µm size) were mechanically characterized by a MEMS two-axis cellular force sensor [35]. A micropipette attached to the electrostatic sensor was used to indent the cells up to their rupture while normal and tangential forces were measured.
While there exists a large body of work regarding MEMS devices for mechanical interrogation of cells of various species, reported data for mechanical properties of yeast cells comes predominantly from milliscale (microplate compression) or nanoscale (AFM) techniques discussed above. The goal of this paper is to implement on-chip MEMS devices specifically for yeast cells in order to compare the measurements with existing techniques. Yeast cells are relatively smaller (in the 5–8 µm range) compared to some other MEMS tested species discussed above, which raises additional challenges with manipulation, squeezing and measurement resolution. In this study, mechanical properties of single yeast cells (S. cerevisiae) were measured by an on-chip PolyMUMPs MEMS squeezer in aqueous media. An electrothermal actuator with a two stage mechanical amplification was designed to achieve a longer motion range underwater. A total displacement of approximately 2.5 µm and a force range of 0.01–1 µN were achieved. Displacement measurements were performed by a FFT image analysis algorithm with a resolution on the order of 10 nm. Rupture force, stiffness, and hysteresis were measured for a total of 22 cells tested individually on a microchip. This study aims to serve as a proof of concept of this MEMS design as a cell mechanics measuring tool of nanoscale resolution.
2. Chevron electrothermal actuator
Electrothermal actuators are MEMS devices that output micro motions due to thermal expansion caused by Joule heating. They are less efficient than electrostatic actuators but are robust and can produce both large output forces and displacements when mechanically amplified [36]. Electrothermal actuators are commonly designed in a V-shape (chevron) configuration due to the motion amplification of the material expansion that they provide [29, 37, 38]. For example, Zhang et al [29] designed and tested a polymer V-shaped electrothermal actuator able to achieve relatively high displacements (~3 µm) even in liquids where the performance drops due to the higher heat loss. To maximize the performance the polymer used had high thermal expansion and low thermal conductivity.
In this study, two identical PolyMUMPs chevron electrothermal actuators were used to drive the cell squeezer mechanism. The designed chevron has 150 µm long poly- silicon (POLY 1) beams with 2 × 2 µm of cross section suspended 2 µm above the substrate. The beams are anchored at one end and meet at the center at a small angle θ of 6° (see figure 1). A current (few milliamps) is passed through the beams from anchor to anchor causing Joule heating and thermal expansion of the beams. The small angle of the beams produces a geometrical amplification of the thermal expansion (upwards motion on figure 1). A pin-link kinematic model indicates that the theoretical amplification factor is 1/tan θ (~10× in this case).
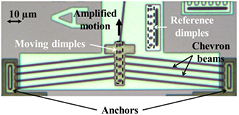
Figure 1. PolyMUMPs chevron type thermal actuator with optical dimples for displacement measurements.
Download figure:
Standard image High-resolution imageIn water even low DC voltages (~3 V) cause electrolysis that leads to bubble formation. This can be avoided by using high frequency AC signals in which the RMS power works as a DC input for frequencies higher than the system thermal cut-off [39]. The temperature rise of the chevron in air at 6 V DC is approximately 300 °C and the resultant motion is on the order of 1 µm. In water at 6 V RMS the ~20× higher thermal conductivity reduces the maximum temperature rise significantly (~15 °C) and the output motion is below 0.10 µm [40]. Using 1 MHz sine wave actuation, the chevron actuator can be driven up to 12 V RMS underwater producing approximately 0.35 µm of displacement. Input AC voltages higher than 12 V RMS leads to bubble formation at the beams possibly caused by boiling water. The motion of the actuator can be measured from microphotographs of periodic structures such as combs or dimples (see figure 1) using a Fourier based phase detection algorithm explained in section 4.
3. MEMS squeezer
Figure 2 shows the PolyMUMPs cell squeezer with: (A) 2 chevron electrothermal actuators, (B) mechanical amplification, (C) optical combs or dimples, (D) jaws and (E) back spring. Because the maximum displacement of the chevron actuator underwater is 0.35 µm, a mechanical amplifier (B) was implemented to increase this motion. It was designed as a 6° V-shaped bent beam amplifier with a theoretical kinematic amplification of ~10×. The final downwards motion is the squeezer motion or input motion, Xin (see figure 2). The jaws (D) were manufactured using the PolyMUMPs double layer (POLY 1 + POLY 2, 3.5 µm thick, 2 µm above substrate). The jaws have stepped spacings from 4.5 to 8.5 µm (see figure 3(a)) to permit squeezing of different cell sizes. If we approximate the yeast cells as oblate spheroids with approximately circular cross sections, then cells with diameters from 4.5 to 8.5 µm can be clamped at their mid-section at different locations on this particular jaw design (see figure 3(b)).
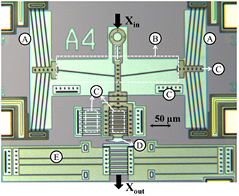
Figure 2. PolyMUMPS cell squeezer: (A) chevron actuators, (B) mechanical amplifier, (C) optical structures (combs/dimples), (D) jaws, (E) back spring.
Download figure:
Standard image High-resolution image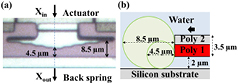
Figure 3. (a) Top view: photograph of stepped jaws with back spring at the bottom. (b) Side view: illustration of cells in contact with the jaws.
Download figure:
Standard image High-resolution imageFigure 4 shows SEM images of the jaw (POLY 1 and 2, double height structure). Note the vertical striations (figure 4(b)) indicating sidewall roughness. Miller et al [41] reported peak surface roughness of PolyMUMPs of ~30–100 nm, but no sidewall roughness was given for PolyMUMPs. The presence of these sharp asperities on the jaw sidewalls may increase the local contact stress and their effects are considered in the discussion section.
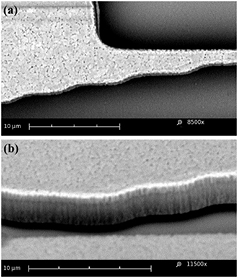
Figure 4. SEM images of the cell test location. (a) Top view: surface roughness of polysilicon. (b) 45° view: note vertical striation of the sidewalls.
Download figure:
Standard image High-resolution imageThe back spring (E) is a two stage folded accordion type suspension which has selective compliance to avoid motion on the horizontal direction (as in figure 2). The optical combs or dimples (C) allow nanoscale measurements of both the input motion Xin and the back spring motion Xout. The cell deformation is given by the difference in motion Xin − Xout and the cell force is given by the back spring motion multiplied by the back spring stiffness: Fcell = Xout * kback. The cell stiffness kcell is the ratio of the two (kcell = Fcell/(Xin − Xout)). The back spring should be chosen such that its stiffness is approximately equal to the cell stiffness to be measured [42]. If the back spring is very stiff then Xout is too small to measure accurately, if the back spring is very soft then Xin − Xout is too small. Two different back spring lengths were used: one soft and one stiff. FEM simulations showed that their stiffnesses were 0.43 and 0.92 N m−1 respectively.
4. Experimental set up
4.1. Cell preparation and placement
Baker yeast cells (S. cerevisiae) were prepared by mixing yeast and sugar in 15 ml of filtered water at 38 °C in the ratio indicated on the product's package. The solution was left to stand for 24 h. Then 0.12 ml of the cell culture was diluted in 20 ml of filtered water. A small drop (~4 µl) of methylene blue was added to the diluted solution in order to allow visual differentiation of viable and non-viable cells under the microscope. A small drop (~4 µl) of the diluted solution was placed on a 5 × 5 mm MEMS chip near the squeezer structures using hand pipetting. The drop was left to stand for 5 min so that the cells settled down on the chip surface. The entire chip area was then flooded with a dilution solution (20 ml of filtered water plus 4 µl of methylene blue, same concentration of the cell solution). Micropipettes (FivePhoton™, inner tip diameter: 3 µm, outer tip diameter: 5 µm) were attached to a Hamilton™ pipette holder which was mounted on a Zaber™ XYZ micro-positioning system. The micropipette was driven to the selected viable cell and the cell aspirated onto the pipette by applying negative pressure. The aspiration pressure was kept low to avoid sucking the cell into the pipette and damaging the cell. The cell was then brought to the size matching jaw stage and released by removing the aspiration pressure.
4.2. Data acquisition
For all tests the chevron actuators were driven by a function generator (Keysight™ 33210A 10 MHz) in series with a voltage amplifier (Thorlabs™ HVA200). AC sinewaves of 1 MHz were generated and the voltage amplified by a factor of ~15 to drive the device. The high frequency input avoids water electrolysis and the RMS voltage of the signal works as a DC source activating the thermal actuators [39]. In each test the driving voltage was incremented several times by a fixed voltage step until the final voltage was reached. Then, the voltage was incrementally reduced by the same steps to zero volts. A Point Grey™ color CCD camera (1280 × 960 pixels) attached to a Wentworth™ Probe station microscope, acquired an image at every voltage step. For the configuration used (25× objective, 2× zoom), the measured pixel size of the images is 144 nm. All the apparatus used in this process (function generator, electrical amplifier, oscilloscope and microscope camera) were automatically controlled by a LabVIEW algorithm. Between each voltage change and the image acquisition there was delay of 0.25 s.
The maximum applied voltage and voltage step depended on the test performed. Some cells were compressed below their rupture limit while others were compressed beyond their breaking point. For the first group, the voltage ranged from 0 to 6 V RMS with a voltage step of 0.6 V RMS. For the latter, the voltage ranged from 0 to 12 V RMS with a step of 1.2 V RMS. Non-ruptured cells were all squeezed with soft back springs of 0.43 N m−1 so that larger displacements (Xout) could be reached with lower forces. Ruptured cells were pushed against both soft and stiff back springs of 0.43 and 0.92 N m−1.
4.3. Image analysis
The camera images taken during the experiments captured moving and fixed optical periodic structures (combs or dimples). The moving structures are attached to the actuators (chevrons and squeezer) and to the back spring; and the fixed reference structures are attached to the substrate (see figures 1 and 2(C))). The images were cropped to the region of interest (ROI) around the periodic structures and the ROI was then column averaged to produce a 1D pixel light intensity profile which is a waveform with a defined wavelength (10 µm in this case) and phase. Based on the technique developed by Yamahata et al [43] a fast Fourier transform (FFT) is performed on the pixel intensity profiles and returns the phase shift of each picture in relation to the first. The phase shift is multiplied by the spatial wavelength to calculate the displacement. See an illustration of the analysis procedure in figure 5. The motion of the reference structure is subtracted from the motion of the moving parts (actuator and back spring) to remove frame vibrations. This method was shown to have a resolution on the order of 10 nm underwater [44].
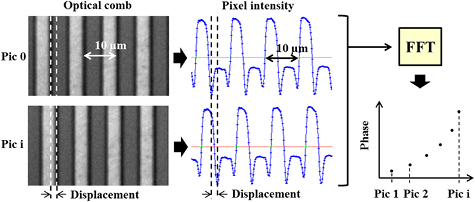
Figure 5. Summary of the data analysis procedure (combs rotated 90° from figure 2(C)).
Download figure:
Standard image High-resolution image5. Chevron and squeezer performances
The displacements of the chevron and the squeezer (Xin) were measured by the method described in the last section in experiments with no cells placed in the jaws. All measurements were done underwater with AC 1 MHz sinewave inputs up to 12 V RMS. Figure 6 shows the measured displacement of the chevron. The average of three trials is shown with the error bars showing the standard deviation. The data showed a repeatability of ±6 nm and fit to a parabolic relationship with an R2 of 0.998. The quadratic relation between displacement and voltage was expected since Joule heating is proportional to electrical power or voltage squared.

Figure 6. Chevron electrothermal actuator performance underwater (average of 3 trials). Parabolic relation with voltage as predicted.
Download figure:
Standard image High-resolution imageOne concern with the use of thermal actuators is the temperature increase at the cell test location. In a previous study, simulations showed that the temperature increase in the center bar end of a single unamplified chevron squeezer was 0.45 °C at 6 V RMS and 2 °C at 12 V RMS [40]. A FEM model was used to predict the temperature distribution and displacement of the device as shown in figure 7. The model used temperature dependent parameters (polysilicon: heat capacity, thermal expansion coefficient, thermal conductivity, and electrical conductivity; water: thermal conductivity) retrieved from [45, 46]. The results showed that there is a negligible temperature increase (<0.01 °C) at the new test location. This is due to the large distance between the cell test location and the heat generators (chevron arms). Therefore, the cells do not experience induced temperature changes during the tests.

Figure 7. FEM simulation of the device at 6 V RMS. Color indicates temperature increase in degrees Celsius (Max ΔT = ~25 °C). Displacement exaggerated by 10×.
Download figure:
Standard image High-resolution imageFigure 8 shows both the simulated and measured chevron and the squeezer (Xin) displacements plotted versus applied voltage squared. The measurements are the average of three trials, with the error bars not visible at this scale. The squeezer motion showed a repeatability of ±5 nm. The difference between FEM and measurements was ~13% for the chevron and ~8% for the squeezer. The amplification factor can be calculated from the slopes of the fits: the measured amplification was 7.4, compared to ~9 from FEM model.

Figure 8. Chevron and squeezer performance underwater, simulated and measured data.
Download figure:
Standard image High-resolution image6. Cell measurements
6.1. Cell stiffness in low force tests
Yeast cells had their stiffness measured in tests with no cell rupture. Cells were placed in the jaws and squeezed three times in succession. Figure 9 shows one such test with low voltages, below the rupture force. Figure 9(a) shows the cell when the maximum deformation is reached (see movie in the supplementary material) (stacks.iop.org/JMM/27/025002/mmedia). Figure 9(b) shows the plotted data of force versus deformation up to 0.27 µN and cell deformation ~55 nm. The data show the average of three trials and error bars show the standard deviation of the three trials. Note that repeated manipulation of the cells can affect their mechanical properties. However over the short test sample (n = 3), no drift was observed. The individual 1st, 2nd and 3rd trials typically varied 2–7% from the average of the three trials. The average slope stiffness change versus trial number was below 1%, indicating no net trend or drift to the three trials. The stiffness of the cell can be determined from the slope: 5.4 ± 0.1 N m−1 (±1.9%) in this case. Seven different cells were tested with low force and they showed a pre-rupture stiffnesses from 3.5 to 6.8 N m−1 with an average of 4.7 ± 1.2 N m−1 (see table A in the supplementary material). The measured stiffnesses were smaller than but comparable to values reported by Smith et al [15] who measured ~11 N m−1 using microplate compression. The effect of cell size on stiffness was also investigated: cell size was estimated by fitting an ellipse (±0.2 µm) to the cell contour. Major diameters ranged from 6.5 to 7.6 µm (average = 7.0 ± 0.4 µm); minor diameters ranged from 5.0 to 5.7 µm (average = 5.3 ± 0.3 µm). Over this range of cell sizes, no correlation was found between stiffness and cell diameters, area or aspect ratio.
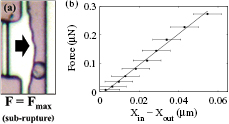
Figure 9. (a) Microphotograph of the maximum deformation of a cell being tested with low force (test #2 in table A). (b) Average of three trials of the force versus deformation cell test data.
Download figure:
Standard image High-resolution image6.2. Effect of jaw placement on stiffness
The cell may be positioned in different locations within the jaw and this may affect the measured stiffness. The same cell was tested in two different positions, one closer to the centerline. For example the same cell located 0.3 µm and 4.8 µm from the centerline resulted in measured stiffnesses of 7.7 ± 0.9 N m−1 and 6.9 ± 0.8 N m−1 respectively. Six cells were tested at two different locations with similar results: increasing the centerline offset resulted in a measured stiffness drop. On average each 1 µm of centerline offset decreased the measured stiffness by ~3% (compared to ~8% measurement uncertainty). This drop is likely due to rotational compliance of the suspension. The offset cell applies a torque which slightly rotates the jaws. This effect is small (a few percent) compared to the measurement uncertainty and could be counteracted with a stiffer double armed amplifier.
6.3. Rupture force and stiffness change
To measure cell rupture force and stiffness change yeast cells were squeezed once up to the maximum (V = 12 V RMS). Figure 10 shows microphotographs of one such test where rupture occurs in the middle frame; note the dark crack in the cell (see movie in the supplementary material). Figure 11 plots force versus deformation of one ruptured cell. As only a single trial could be conducted for burst tests, the displacement error bars indicate measurement uncertainty from the optical techniques and the force error bars indicate the displacement uncertainty multiplied by the back spring stiffness. The maximum force in this case was 0.65 µN and rupture occurred at ~0.4 µN with a ~110 nm discontinuity in the deformation. The measured slopes were 7.5 ± 0.7 N m−1 (±9%) before rupture and 0.28 ± 0.04 N m−1 (±14%) after. In this test the stiffness dropped by 95%. In total, 9 different cells were tested past rupture and had their stiffness and rupture forces measured (see table B in the supplementary material). The average pre and post-rupture stiffnesses were 9.3 ± 3.1 N m−1 and 0.94 ± 0.57 N m−1 respectively. Figure 12 plots pre and post-rupture stiffness. The average pre-rupture stiffness was ~10× higher than post-rupture indicating severe damage to the cell. All nine cells turned blue due to intake of methylene blue after the test indicating that they became non-viable. An average cell rupture force of 0.47 ± 0.10 µN was measured. The pre-rupture stiffness of ruptured cells was higher than the stiffness of the cells tested with low force: an initial non-linearity of cell stiffness was reported by Yang and Saif [28] who used a MEMS device to evaluate the force response of fibroblasts.

Figure 10. Yeast cell (a) before compression. (b) When rupture occurs. (c) At maximum compression (test #11 in table B).
Download figure:
Standard image High-resolution image
Figure 11. Force versus deformation for pre and post-rupture data (test #16 in table B). Back spring k = 0.43 N m−1.
Download figure:
Standard image High-resolution image
Figure 12. Cell stiffness before and after cell disruption.
Download figure:
Standard image High-resolution image6.4. Hysteresis analysis of disrupted and non-disrupted cells
To measure cell hysteresis, yeast cells were measured both on compression and on release. Cells tested below their rupture force showed a residual deformation <100 nm while ruptured cells showed residual deformations >400 nm. Figure 13(a) shows the plotted force versus deformation for the low force with a residual deformation of <50 nm. Figure 13(b) shows the data of a ruptured cell that showed a residual deformation of >900 nm. The error bars in figures 13(a) and (b) are calculated as per figures 9 and 11 respectively. The area under the curve of these graphs is the energy loss during cell compression. For the cell tests shown in figures 13(a) and (b) the calculated energy loss was 0.003 pJ and 0.485 pJ respectively. The ~160 fold increase in energy loss for a 2–3 fold increase in maximum force is further evidence that the cell wall was ruptured. Similar results were seen for all tested cells (see tables A and B in the supplementary material). Ruptured cells had on average 12× the residual deformation of un-ruptured cells. The average residual deformation for ruptured and non-ruptured cells was 0.72 ± 0.18 µm and 0.06 ± 0.02 respectively. Ruptured cells had on average ~80× the energy loss of un-ruptured cells, 0.553 ± 0.165 pJ for the ruptured and 0.007 ± 0.002 pJ for the non-ruptured. Figure 14 compares the average force versus deformation data of the five lowest maximum force tested (no rupture) with the five largest maximum force tested, with error bars indicating standard deviations. Similar behavior was shown by Yang and Safir [28] that reported plastic deformation of fibroblasts after damaging the cells with a compression force of ~0.4 µN.

Figure 13. Comparison of hysteresis of two cells. (a) Low force, no rupture and residual deformation of <50 nm (test #3 in table A). (b) High force, rupture and residual deformation of >900 nm (test #16 in table B).
Download figure:
Standard image High-resolution image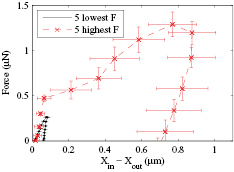
Figure 14. Force versus deformation curve of ruptured (dashed red line) and non-ruptured cells (solid black line). Curves are the average of the five highest and five lowest maximum forces (see tables A and B).
Download figure:
Standard image High-resolution image
7. Discussion
An average cell rupture force of 0.47 ± 0.10 µN was measured. Previous microplate compression studies reported baker's yeast rupture between 50 and 250 µN [14, 19, 20] while a penetration force in the range of 0.09–0.25 µN was measured using AFM [17]. This difference is likely due to the much larger contact area of the microplate compared to the AFM. In this study, the contact area is higher than the AFM but lower than the microplate. The burst forces in this study are between AFM and microplate compression reported values. However the values reported here are two orders of magnitude smaller than microplate compression values. This force ratio is far larger than the ratio of contact areas due to the non-linear relationship between the contact forces and area. In the large deformation of microplate compression (d1 ~50% [15, 20, 21]), a detailed membrane model is required to model the bursting of the cells: Smith et al [47] shows an exponential dependence of force on deformation. The deformations in this study are much smaller (d2 ~ 2% at burst). At the smaller deformation of AFM studies, Hertzian or Hertz–Sneddon contact mechanics can be used [18, 22]. In a Hertzian model force F scales with deformation d as: F α d3/2 and pressure P scales with deformation d as P α d1/2. As a rough estimate the ratio of forces between this work and microplate compression would be expected to be on the order (d1/d2)3/2 = 120×. The estimated pressure ratio should be closer: (d1/d2)1/2 = 5×. SEM images of the polysilicon sidewall (figure 4) showed nanoscale striations that could increase local contact pressure and cause cells to burst at lower pressures.
The MEMS device presented in this study is based on an earlier design [42]. The previously published work squeezed cells while the device in this study ruptures cells. Our previous work was able to measure stiffness of both viable and non-viable yeast cells. However, the non-viable cells were made so by external chemical means (exposing them to methanol) prior to testing. The previous work used an electrostatic actuator which had a short range of motion and did not demonstrate cell rupture or hysteris. The device in this work uses a thermally actuated and amplified squeezer that is capable of applying much larger deformation, causing cell rupture by purely mechanical means. The new setup allows for a ~8× larger range of motion and 6× larger cell deformations. This has two benefits: Firstly, the relative error in displacement measurements is decreased and precision increased: the average % error in measured cell stiffness is 2× smaller compared to our previous work. Secondly, the input mechanical energy is increased: the device reported here can apply 4–6× more mechanical strain energy.
8. Conclusions
We have described the design and testing of a MEMS device able to measure mechanical properties of single living cells underwater. The device successfully measured cell stiffness, rupture force and hysteresis of single cells on a microchip. This design amplified the chevron motion that is diminished by the high thermal conductivity of the water. The polysilicon structure reached a relatively high displacement range with average motion repeatability below 10 nm. The squeezer final displacement was long enough to compress single baker's yeast cells beyond their breaking point. Cells showed a linear force response before and after rupture. The visualization of cracks on the cell wall and the sharp stiffness drop (approximately 10×) were clear evidences that the cell was disrupted. Ruptured cells showed much stronger hysteretic behavior resulting in evident plastic deformation. Future work will include changing the working media to study its effect on cell mechanics, and comparing cell mechanical properties of: different species, same species but different growth phases (cell age), and normal and abnormal mammalian cells. Since mammalian cells are less stiff than yeast cells due to the lack of cell wall, adjustments in the back spring design should be done in order to decrease its stiffness. Since MEMS can be batch produced and operated in several parallel arrays, this may represent a clinically useful diagnostic tool in future embodiments.
Acknowledgments
This work was funded by the NSERC—Natural Sciences and Engineering Research Council of Canada, and fabrication services were obtained through CMC—Canadian Microsystems Corporation. B Barazani is funded by the Brazilian Federal Entity: National Council for Scientific and Technological Development (CNPq).