

Abstract
Tungsten inert-gas (TIG) welding uses an electric arc between a tungsten cathode and a metal anode to partially melt the anode workpiece, forming a weld pool. Metal vapour emanating from the weld pool has important effects on the arc welding process. An axisymmetric computational model of the arc and weld pool is used to examine the transport and influence of iron vapour on an argon arc plasma. In contrast to previous studies that use approximate and incomplete treatments of diffusion, the present model incorporates the combined diffusion coefficient method, which takes into account all important driving forces. The influence of metal vapour is first examined for an arc current of 400 A. Metal vapour is predicted to be present in high concentrations above the anode and near the cathode tip, and in a lower concentration in the arc column. The presence of metal vapour in the arc is found to lead to a substantial reduction in arc temperature (up to 1600 K) and current density, resulting in a significant decrease in the weld pool depth and volume. It is shown that ordinary diffusion leads to iron vapour transport upward from the anode region along the arc fringes and into the recirculating convective flow, which carries the iron vapour to the cathode region. Here the upward diffusion driven by the electric field and temperature gradient traps the iron vapour below the cathode tip, leading to a high concentration in this region. The influence of arc current is investigated in the range from 150 to 400 A. The results obtained for standard welding currents of 150, 200 and 250 A also predict significant concentrations of iron vapour in the arc, with the concentration increasing with current in the arc column and near the anode. The concentration near the cathode tip is lower at 400 A because the temperature and electric field diffusion coefficients are lower at the higher temperatures present near the cathode. Spectroscopic measurements of atomic chromium emission for argon TIG welding of a chromium anode are presented and compared to predictions of the code. The measurements show the presence of metal vapour in both the cathode and anode regions, in agreement with the model.
Export citation and abstract BibTeX RIS
1. Introduction
Tungsten inert-gas (TIG) welding, also known as gas-tungsten arc welding, is widely used for welding of stainless steel and other metals. TIG welding uses a tungsten cathode and a metal anode workpiece, with an electric arc is formed between to melt the workpiece, creating a weld pool. During TIG welding, an inert shielding gas such as helium, argon or a helium–argon mixture is used to protect the workpiece from oxygen. Metal vapour is formed by vaporization of the molten metal in the weld pool. However, because the cathode is made of tungsten (or, to be precise, tungsten doped with about 2% of a rare-earth oxide such as lanthanum oxide) and in general does not melt due to its high melting temperature, formation of metal vapour from the cathode can be neglected. This is in contrast to metal inert-gas/metal active-gas (MIG/MAG) welding, in which the upper electrode is a metal wire that produces large amounts of metal vapour [1–5].
Early studies indicated that metal vapour played a negligible role in the cathode region and the arc core in TIG welding [6, 7]. For example, the vapour produced from a copper anode in an argon TIG arc was found to only influence the plasma temperature distribution near the anode, with the copper vapour only reaching regions of the arc close to the anode workpiece [8]. Farmer et al [9] measured temperature distributions in argon TIG arcs with both a water-cooled copper and a stainless-steel anode, and found little difference, with metal vapour only observed within 1 mm of the anode surface. The measurements and modelling of Gonzalez et al [10] showed that the presence of iron vapour resulted in a reduction of the temperature of an argon arc by about 1000 K within 2 mm of the anode in a 20 mm-long arc with 90 A arc current. Computational modelling of the metal vapours produced from stainless steel workpieces for argon and helium arcs likewise predicted that the vapour would remain confined to the region close to the anode workpiece [11–15].
A review of the influence of metal vapour on TIG arcs concluded that metal vapour only influenced the region near the anode, with the metal vapour produced from the weld pool being confined close to the anode by the strong downward flow in the centre of arc and then swept radially outwards as the flow is diverted in this direction by the anode [1]. However, a subsequent experimental study [16] provided evidence, through both emission spectroscopic measurements of the arc and electron-dispersive x-ray (EDX) measurements of the composition of the cathode after welding that metal vapours produced in TIG welding in helium were transported upwards to the cathode. This behaviour was recently reproduced by computational modelling, which showed that cataphoresis (diffusion driven by an electric field) led to upward transport of the metal vapours [17, 18]. The model treats TIG welding including all diffusion driving forces (ordinary diffusion, thermal diffusion and cataphoresis); this was facilitated by the use of the combined diffusion coefficient method [19–21], which greatly simplifies treatment of diffusion in plasmas in local thermodynamic equilibrium (LTE) by allowing species to be combined into their parent gases.
These results have motivated us to revisit the transport of metal vapour in argon TIG welding, to assess the influence of all diffusion driving forces. Almost all previous modelling studies of metal vapour in argon TIG welding have used approximate treatments of diffusion that only take into account ordinary diffusion (e.g. [10, 13–15]). Note that preliminary results of a study that considers different diffusion driving forces have been presented [22].
The details of our computational model are presented in section 2. The properties of a pure argon TIG arc are compared to that of an arc containing iron vapour in section 3. Results are presented for a relatively high arc current of 400 A to ensure a large concentration of metal vapour in the arc. The mechanisms of iron vapour transport are then examined in section 4. Calculations for different arc currents are presented in section 5 to provide an understanding of the effect of arc current on iron vapour generation and transport in the plasma. Comparisons with previous work and experiment will be provided in section 6. Concluding remarks are provided in section 7.
2. Methodology
2.1. Mathematical model
The mathematical model solves a set of coupled partial differential equations for conservation of mass, conservation of momentum, conservation of energy and continuity of current due to the applied electric field. Because of the inclusion of metal vapour, an additional mass conservation equation for metal vapour also needs to be solved. In the present calculation, transient terms in the governing equations are omitted and steady-state conditions are assumed for the welding process. The set of governing equations is presented below. Several of the governing equations are applicable for the whole computational domain, while others are restricted to the fluid (plasma and weld pool) regions or only the plasma region. These details are noted after the respective equation. The thermophysical properties refer to those of the region being considered; those in the plasma are calculated considering both argon and iron vapour.
Conservation of mass:

where  is the mass density,
  is the velocity.
Conservation of momentum:

where  is the pressure,
  is the viscous stress tensor,
  is the current density,
  is the magnetic field strength induced by the current and
  is the gravitational acceleration. The equation is only applicable to the plasma and liquid metal regions. The influence of gravity in the plasma is small when the arc current is larger than about 30 A [23], but the term is included for completeness. The viscous stress tensor
  is given by
where  and
and  are the velocity and position components respectively and
  is the viscosity. The azimuthal component of the magnetic field strength
  is required to calculate the
  term and is obtained using
where  is the permeability of free space.
Continuity of current:

where  is the electric potential and thus current density is expressed as

Conservation of energy:
where  is the enthalpy,
  is the electrical conductivity,
  is the thermal conductivity,
  is the specific heat at constant pressure,
  is the enthalpy of iron vapour,
  is the enthalpy of argon,
  is the sum of the mass fractions of iron vapour species,
  represents the electron charge,
  is the Boltzmann constant,
  is the net radiative emission coefficient, The third, fourth and fifth terms on the right-hand side are only considered in the plasma region.
Conservation of metal vapour mass:

where  is the average mass flux of iron vapour species relative to the mass-average velocity
  . This equation is only solved in the plasma region. For the present work, in which only one type of metal vapour is included, the mass fraction of argon is calculated using
  after solving equation (9).
The treatment of diffusion is critical in the accurate prediction of thermal plasma properties. The combined diffusion coefficient method, which takes into account the effects of ordinary diffusion, and diffusion due to the pressure gradient, temperature gradient and the applied electric field, has been demonstrated to provide an accurate treatment for metal vapour diffusion in a plasma under the local chemical equilibrium assumption; it is equivalent to a full multicomponent treatment under these conditions [20, 21].
The mass flux  is determined using the combined diffusion coefficient method [21]:
where  is the number density of the gas mixture,
  and
and  are the average masses of heavy species of iron vapour and the shielding gas argon, and
  is the sum of the mole fractions of argon gas species.
  is the combined ordinary diffusion coefficient,
  is the combined pressure diffusion coefficient,
  is the combined electric field diffusion coefficient and
  is the combined temperature diffusion coefficient. The combined diffusion coefficients represent respectively the diffusion due to mole fraction gradients, pressure gradients, the applied electric field and temperature gradients, and are calculated taking into account ambipolar effects.
2.2. Boundary conditions
Details of the external boundary conditions were given by Park et al [18]. Here we present details of the internal boundary conditions between the plasma and electrodes. Note that the methods are the same as used by Park et al, but they included some of the internal boundary conditions as terms in equations (1), (8) and (9), while we have removed them from the equations and specify them in this section.
A metal vapour source term  is applied to the plasma control volumes immediately above the anode on the right-hand side of equations (1) and (9), where
  is the area of the control volume at the metal workpiece surface,
  is the volume of the plasma control volume adjacent to the metal surface and
  is the vaporization mass flux of iron based on the Hertz–Knudsen–Langmuir equation [24]:
Here  is the mass of an iron atom,
  is the temperature at the metal surface and
  is the plasma temperature adjacent to the metal surface. The metal vapour pressure
  is expressed by the Clausius–Clapeyron equation as
where  is atmospheric pressure,
  is the mole fraction of iron in workpiece and equals to one in this work when pure iron workpiece is used,
  is the ideal gas constant,
  is the molar heat of evaporation of iron and
  is the boiling temperature of iron.
Heat fluxes between the arc and electrodes are treated using the methods presented by Lowke et al [25, 26]. The heat flux to the anode is given by

where  represents electron current density, assumed equal to the total current density and
  is the anode work function. At the cathode, the electron current is given by the Richardson equation, and any difference between the total current obtained from equations (6) and (7) is assigned to the ion current, which heats the electrode. While different treatments of the thermionic cathode have been adopted by some researchers [27–29], the method adopted here has been demonstrated to accurately predict arc and cathode temperature distributions for a wide range of arc currents and cathode angles [25]. As described by Sansonnens et al [30], the work function of the rare-earth dopant of the tungsten cathode is used in the Richardson equation, while that of tungsten is used to determine the thermionic cooling.
Additional terms are required in the energy conservation equation because of the formation of metal vapour. A source term representing the enthalpy transferred to the plasma by the metal vapour side is added to the plasma control volumes immediately above the anode and a source term representing the latent heat of vaporization of iron is subtracted from the anode control volumes immediately below the plasma.
2.3. Computational model
Calculations are conducted with an axisymmetric model, with a tungsten cathode and pure iron workpiece anode as shown in figure 1. The cathode diameter is 3.2 mm, the cathode tip angle is 60° with a truncated tip plateau radius of 0.3 mm. A fixed arc length of 3 mm is used. The computational domain is 31.6 mm × 43.0 mm, with 82 × 169 mesh points in the radial and axial dimension, respectively. In particular, the mesh size near the anode is 0.1 mm and that in the cathode region is 0.05 mm, in order to treat the regions adjacent to the electrode using the LTE-diffusion approximation [26]. The finite-volume method [31] is used to solve the sets of governing equations simultaneously, with the pressure–velocity coupling treated using the SIMPLEC algorithm [31, 32].

Figure 1. Geometry of the two-dimensional computational model.
Download figure:
Standard image High-resolution imageArgon shielding gas flows in from the top boundary at 500 cm3 s−1 guided by a virtual nozzle with diameter 14 mm. Open boundary conditions are applied at the top and side walls to allow free movement of gas into and out of the system, with velocity gradients set to zero and pressure  and temperature
  . Iron vapour was only allowed to flow outwards at these boundaries. The geometry and some the properties of the electrode materials illustrated in figure 1 and table 1; the other properties (density, specific heat, thermal conductivity, electrical conductivity, viscosity and surface tension) are given by Park et al [18].
Table 1. Geometry and electrode property details.
| Cathode tip angle (degree) | 60 |
| Cathode diameter (mm) | 3.2 |
| Cathode material | Tungsten doped with 2% La2O3 |
| Cathode (tungsten) work function (V) | 4.52 |
| Cathode dopant (La2O3) work function (V) [33] | 2.63 |
| Arc length (mm) | 3 |
| Workpiece material | Iron |
| Workpiece thickness (mm) | 10 |
| Shielding gas | Argon |
| Nozzle diameter (mm) | 14 |
| Workpiece melting temperature (K) | 1811 |
| Workpiece boiling point (K) | 3135 |
| Anode work function (V) | 4.65 |
| Arc current (A) | 150–400 |
| Gas flow rate (cm3 s−1) | 500 |
Note that the weld pool surface is assumed to be a flat. This assumption is reasonable in TIG welding without the use of filler wire, although at higher currents some depression of the weld pool surface may occur due to the pressure exerted by the arc. Further, the arc is assumed to be stationary, unlike real weld processes; this assumption is made in almost all simulations of TIG welding and facilitates comparison with experiments, which also use a stationary arc.
It is assumed that the arc plasma is in LTE. The thermodynamic and transport properties of mixtures of argon and iron vapour were obtained using the methods presented by Murphy [1, 34]. The net emission coefficients with a 1 mm absorption length were taken from Cram [35] for argon and Menart and Malik [36] for iron vapour. The net emission coefficients of gas mixtures were calculated using a mole-fraction average, as recommended by Gleizes et al [37]. The electrical conductivity and net emission coefficients for different mixtures of argon and iron vapour are shown in figure 2.

Figure 2. Temperature dependence of (a) electrical conductivity and (b) net emission coefficient of argon, iron vapour, and mixtures containing 0.1 mol%, 1 mol%, 10 mol%, and 30 mol% iron vapour, respectively.
Download figure:
Standard image High-resolution imageThe influence of iron vapour on electrical conductivity is complex and is worthy of discussion. The electrical conductivity is approximately proportional to the electron density and inversely proportional to the collision cross-sections for the species present. Iron vapour atoms ionize at a lower temperature than argon, so the electron density and therefore the electrical conductivity is higher at low temperatures. At high temperatures, the iron vapour ions have a higher degree of ionization than those of argon. The Coulomb potential describing interactions between charged particles is proportional to the degree of ionization of each of the interacting particles, so the collision cross-section is larger for iron vapour. This becomes the dominant factor above about 15 000 K.
A total of 150 000 iterations are performed to ensure convergence and that the arc properties are stable.
The model has been extensively used for modelling of argon arcs both without and with metal vapour, and has been validated against measurements of arc temperature distributions and weld pool dimensions [1, 13, 38]. Note that in almost all previous models of argon arcs that consider metal vapour, the metal vapour diffusion treatment has been inaccurate, taking into account only ordinary diffusion using an approximate expression. The model, with the full treatment of metal vapour diffusion given in equation (10), has been validated against experimental measurements for a helium arc with stainless steel SUS 304 workpiece [18].
3. Influence of iron vapour at high current
To investigate the effect of metal vapour on the arc welding process, calculations for an iron–argon mixture were compared to those for pure argon TIG welding. Other metal vapours such as chromium and manganese, which will also be present in the case of welding of stainless steel, are neglected to simplify the problem [18]. The results are therefore strictly applicable to a pure iron rather than a steel workpiece. A relatively high arc current of 400 A is used for this comparison to ensure that a substantial amount of metal vapour is present in the arc; results for lower currents are presented in section 5.
We present results both in the form of contour plots, showing the distribution of properties in two dimensions, and in plots of radial and axial distributions of properties. The radial distributions are presented for three different axial locations in the arc, (a)  , 0.3 mm below the cathode, (b)
  , in the vertical centre of the arc and (c)
  , 0.3 mm above the anode. Here
  is a dimensionless number,
  is the distance from anode surface and
  is the arc length (
 ).
).
Figure 3 compares the temperature distribution in the arc plasma neglecting and including the influence of iron vapour (i.e. for pure Ar and Fe–Ar mixtures). The presence of iron vapour leads to a decrease of 1600 K in the peak temperature (Tmax). The iron vapour mole fraction, shown in figure 4, reaches about 0.08 above the centre of the workpiece and 0.33 adjacent to the cathode, and is also significant (about 0.03) on the arc axis midway between the electrodes.
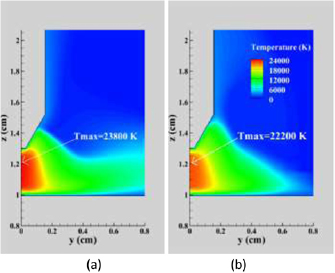
Figure 3. Distribution of temperature in a vertical cross-section for (a) pure Ar and (b) Fe–Ar mixture.
Download figure:
Standard image High-resolution image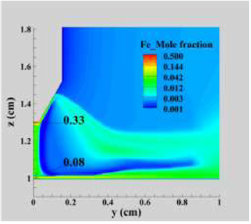
Figure 4. Distribution of iron vapour mole fraction in a vertical cross-section (logarithmic scale).
Download figure:
Standard image High-resolution imageThe presence of metal vapour leads to a substantial increase of the radiative loss from the plasma, with the peak value increasing from 25 300 to 69 800 W cm−3. Figure 5 shows the radial distribution of temperature and radiative loss with and without metal vapour at  . A significant decrease of arc temperature (1600 K on axis) and increase of radiative loss (14 000 W cm−3 on axis) are identified when iron vapour is included. The increased radiative loss is due to the presence of the metal vapour near the arc axis. As shown in figure 2(b), the addition of even a small amount of iron vapour increases the net emission coefficient, which enhances the radiative cooling of the arc.
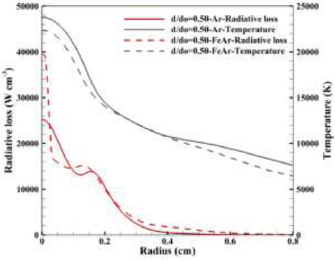
Figure 5. Distribution of radiative loss and temperature in the radial direction for pure Ar and Fe–Ar mixture at axial position  .
.
Download figure:
Standard image High-resolution imageWhen iron vapour is present, there is a very large increase in radiative cooling in the radii <0.03 cm region, corresponding to the increased metal vapour concentration in this region. At radii from 0.03 cm to 0.1 cm, the radiative cooling for the iron vapour case falls below that for pure argon because the iron vapour concentration is negligible and the temperature is lower. At larger radii, the temperature is similar because the radiative loss is now similar. It is interesting to note a second peak in radiative loss at around 0.15 cm; this corresponds to a plateau in the dependence of net emission coefficient on temperature that commences at 15 000 K (see figure 2(b)). This plateau is a consequence of the strong ionization of argon occurring at this temperature [38].
Figures 6(a) and (b) show the influence of iron vapour on the distribution of current density in the radial and axial directions, respectively. From  the current density is reduced on axis by the presence of iron vapour. In contrast, from
  the current density is increased when iron vapour is included. Figure 6(b) shows that iron vapour leads to increasingly large increases in current density as the cathode is approached. These trends are a consequence of the dependence of electrical conductivity on temperature and metal vapour concentration, which were shown in figure 2(a). At the lower temperatures occurring near the cathode, the presence of metal vapour increases the electrical conductivity, whereas in the higher temperature regions of the main arc column, both the presence of iron vapour and the associated decrease in temperature reduce the electrical conductivity.

Figure 6. Distribution of current density for pure Ar and Fe–Ar mixture (a) in the radial direction at three axial locations ( ), (b) in the axial direction at a radius of 0.005 cm.
Download figure:
Standard image High-resolution imageAt radii greater than R = 0.2 cm, the presence of metal vapour increases the current density at all axial positions, with the region in which the current density is greater than zero close to the anode at  expanding from R = 0.33 cm to R = 0.39 cm. This is again a result of the increased electrical conductivity at low temperatures associated with the presence of metal vapour.
Figure 7 shows the temperature distribution and flow streamlines in the weld pool for calculations neglecting and including the influence of metal vapour in the arc. The presence of metal vapour decreases the weld pool depth by a factor of 1.5, from 0.65 to 0.4 cm, but the radial extent is essentially unchanged, and the flow pattern is similar. The weld pool volume is decreased by 37%, from 1160 mm3 to 847 mm3, by the presence of metal vapour.
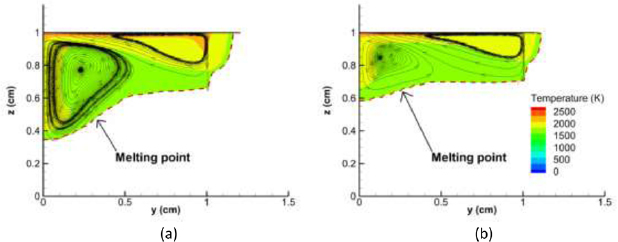
Figure 7. Distribution of weld pool temperature and streamlines in a vertical cross-section for (a) pure Ar and (b) Fe–Ar mixture.
Download figure:
Standard image High-resolution imageFlow in the weld pool is driven by four main forces: the Lorentz ( ) force, buoyancy, the Marangoni force and the drag force of the plasma on the weld pool surface. Buoyancy, the drag force and, in the usual case in which surface tension decreases with increasing temperature, the Marangoni force all lead to liquid flows that are upwards near the axis and outwards near the surface of the weld pool [13]. The Lorentz force, in contrast, drives flow downwards near the weld pool axis.
As shown in figure 7, the overall flow pattern is similar with and without the presence of metal vapour. The increased depth of the weld pool for the pure argon arc is a consequence of the higher current density near the arc axis, leading to an increased Lorentz force in the weld pool. The Marangoni force causes a radially outward flow in both cases, so the radial extent of the weld pool is similar in both cases.
In summary, the presence of metal vapour in argon TIG welding has significant effects on the properties of the arc and the weld pool. The metal vapour leads to increased radiative cooling of the arc and results in reduced current density and arc temperature in the centre of the arc column, which affects the weld depth.
4. Mechanisms for iron vapour transport
As noted in section 1, previous modelling studies of argon TIG arcs have predicted that the metal vapour produced from the weld pool remains close to the workpiece and is swept radially outwards by the convective flow. However, as found by Park et al [17, 18] in their studies of helium TIG arcs, when a full treatment of diffusion that all driving forces are incorporated into the model, then diffusion of metal vapour upwards through the arc to the cathode is predicted, in accordance with measurements.
Park et al [18] showed that in the helium TIG arc the main driving force for upward diffusion of metal vapour is the electric field between the cathode and anode; this effect is known as cataphoresis [39]. Park et al pointed out that cataphoresis will be weaker in an argon arc than a helium arc since its strength increases with the difference in ionization energy and atomic mass of the gases involved. The ionization energy of argon (15.8 eV) is much closer than that of helium (24.6 eV) to that of iron (7.90 eV); similarly, the atomic mass of argon (39.95 amu) is much closer than that of helium (4.00 amu) to that of iron (55.85 amu). In this section, we examine the relative importance of each of the diffusion driving forces on the distribution of iron vapour in the argon TIG arc. The presence of iron vapour leads to large changes in the arc properties, as shown in section 3, so clarifying the transport mechanisms leading to the presence of iron vapour in the arc is important.
The four driving forces considered in the combined diffusion coefficient method are associated with mole fraction gradients, temperature gradients, the applied electric field and the pressure gradients. The corresponding diffusion coefficients in equation (10) are  ,
,  ,
,  and
and  respectively. The effect of each diffusion driving force is investigated by comparing results obtained by including and neglecting different combinations of the driving forces, as shown in table 2. The influence of
  is not considered as it has been shown to have a negligible effect in welding arcs because of the very small pressure gradient [1]. An arc current of 400 A is used for all calculations in this section.
Table 2. Definition of different combinations of diffusion treatment.
specification  Diffusion term Diffusion term |
 |
 |
 |
 |
|---|---|---|---|---|
| Combined diffusion | On | On | On | On |
| No E diffusion | Zero | On | On | On |
| No T diffusion | On | Zero | On | On |
| No E or T diffusion | Zero | Zero | On | On |
| No E or T or O diffusion | Zero | Zero | Zero | On |
Figure 8 shows the distributions of iron vapour mole fraction when different combinations of diffusion driving forces are considered. In all cases, a large iron vapour concentration occurs near the anode surface, extending radially to beyond R = 0.8 cm.
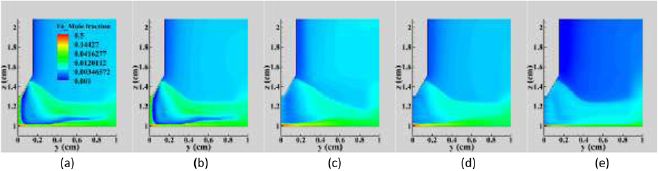
Figure 8. Distribution of iron vapour mole fraction in a vertical cross-section for the Fe–Ar case calculated (a) with full combined diffusion coefficient treatment, (b) with electric field diffusion neglected, (c) with temperature diffusion neglected, (d) with electric field and temperature diffusion neglected and (e) with electric field, temperature and ordinary diffusion neglected.
Download figure:
Standard image High-resolution imageWhen the full 'combined diffusion' method is applied (figure 8(a)), iron vapour is transported from the arc fringes near the anode surface (R ⩾ 0.8 cm) upwards, eventually reaching the cathode. There is a band of iron vapour (mole fraction around 0.02) extending from the arc fringes near the anode surface to about 0.2 cm above the cathode tip. Iron vapour becomes concentrated near the cathode tip, reaching a maximum mole fraction of 0.33. In the arc column, the iron vapour mole fraction is predicted to be much lower, around 0.03. There is also some iron vapour (mole fraction <0.005) at large radii and vertical positions above the cathode tip.
When electric field diffusion is neglected ('No E diffusion'—figure 8(b)), a small decrease in the iron vapour near the cathode tip to mole fraction of 0.28 is observed, though there is no significant effect on the iron vapour distribution near the anode surface or in the arc fringe region. This shows that the electric field diffusion plays only a small role in iron vapour transport in the argon arc. This is different from that in helium, where the electric field diffusion is important in carrying metal vapours upwards in a TIG arc. The main reason is that the difference in ionization energy and atomic mass of the gases involved in an argon arc is smaller than that in a helium arc, as noted above.
When temperature diffusion is neglected ('No T diffusion'—figure 8(c)), significant changes to the iron vapour distribution are predicted. The iron vapour near the cathode tip drops to mole fraction of 0.01 and the iron vapour concentration close to the cathode surface is also reduced. This is accompanied by a large reduction in the central regions of the arc column and a spreading out of the band of iron vapour that extends from the arc fringes near the anode surface to about 0.2 cm above the cathode tip.
When both electric field and temperature diffusion are neglected ('No E or T diffusion'—figure 8(d)), the iron vapour concentration near the cathode tip drops to almost zero, and there is almost no iron vapour close to the cathode. This suggests that electric field diffusion tends to hold the iron vapour near the cathode. There are minor changes in the distributions of iron vapour near the anode surface as well as in the arc fringes.
When all diffusion driving forces are neglected ('No E or T or O diffusion'—figure 8(e)), the iron vapour concentration in the arc fringes is significantly reduced. Compared with the 'No E or T diffusion' results, the further neglect of ordinary diffusion eliminates upward diffusion of iron vapour from the weld pool, so high iron vapour concentrations are only observed close to the anode surface (figure 8(e)). Nevertheless, iron vapour is present in the arc fringe region and in the arc column in low concentrations, which demonstrates that convective flow plays a role in iron vapour transport from the weld pool surface towards the cathode.
To understand the results, it is useful to consider both the streamlines and the combined diffusion coefficients. Figure 9 shows the streamlines in the computational domain, superimposed on the iron vapour mole fraction distribution. Iron vapour is carried upwards away from the anode surface by convective flow. The flow then transports the iron vapour inwards and downwards. Some of this iron vapour reaches the cathode region, and some reaches the region of relatively high vapour mole fraction that extends about 0.2 cm above the cathode tip to the arc fringes near the anode surface.

Figure 9. Flow streamlines superimposed on figure 8(a).
Download figure:
Standard image High-resolution imageFigure 10 shows the combined diffusion coefficients, all of which are strongly dependent on temperature and iron vapour concentration [1]. The direction of diffusion of iron vapour driven by each driving force can be ascertained from equation (10) and figure 10. Ordinary diffusion is always in the direction of decreasing iron vapour mole fraction. Temperature diffusion is in the direction of decreasing temperature, while electric field diffusion is in the direction of the electric field (i.e. towards the cathode) for temperatures below 17 000 K. In the centre of the arc column, where the temperature is greater than 20 000 K for all cases considered, the combined temperature diffusion coefficient  and combined ordinary diffusion coefficient
  are close to zero; only electric field diffusion has an appreciable effect, which, as has been shown above, is nonetheless small. At larger radii, where the temperature falls between 10 000 and 15 000 K, only the combined temperature and combined ordinary diffusion coefficients are large for iron mole fraction down to 0.01 and lower. Near the arc fringes, where the temperature falls between 8000–10 000 K, the combined temperature and combined electric field diffusion peak. When the temperature falls to around 5000 K, only the combined ordinary diffusion coefficient is non-zero.

Figure 10. Dependence on temperature of combined (a) ordinary diffusion coefficient, (b) temperature diffusion coefficient and (c) electric field diffusion coefficient for different mixtures of iron and argon; percentages are mole percentages.
Download figure:
Standard image High-resolution imageThese results give the following overall understanding of the process by which iron vapour reaches the cathode region and the arc column. The iron vapour is formed from vaporization of the molten regions of the anode and is swept radially outwards by the convective flow. In the absence of diffusion, a small amount of vapour becomes entrained in the recirculating flow and reaches the cathode region, but almost all of the vapour is convected away from the arc. When diffusion is included, ordinary diffusion leads to iron vapour transport away from the anode into the recirculating flow, increasing the concentration of vapour in regions other than near the anode. The convective flow is much weaker close to the cathode, decreasing to zero very close to the cathode. Iron vapour that is close to the cathode tip is therefore removed from the convective flow, and electric field and temperature diffusion transport the iron vapour upwards towards the cathode. A balance is developed between these driving forces and ordinary diffusion, which acts downwards when the concentration of metal vapour decreases away from the cathode. This balance maintains the concentration of iron vapour near the cathode tip higher than downstream in the arc column. Temperature diffusion is largely responsible for the region of negligible (<0.001) iron vapour mole fraction between the two regions of higher concentration (the region near the arc axis and the region extending radially outwards and downwards from about 0.2 cm above the cathode tip). The combined temperature diffusion coefficient is large in this region, and temperature diffusion acts away from the arc axis to regions of lower temperature.
It should be noted that the flow streamlines depend on the arc current and input gas flow rate and will also be affected by the presence of a nozzle around the cathode. The current computational model uses a virtual nozzle at the top of the computational domain to guide the shielding gas, though the nozzle does not extend to the cathode tip region. Nevertheless, our calculations show that recirculation is always present, leading to the transport of metal vapour from the anode region towards the cathode region, so metal vapour is expected to reach the cathode tip in all cases.
5. Influence of arc current
In this section, the influence of arc current on a TIG arc when iron vapour is included is examined. The arc current is particularly important, since as well as influencing the arc properties, it affects the temperature of the weld pool and therefore the amount of iron vapour produced. In section 3, a high arc current of 400 A was used to ensure that iron vapour had an easily observable influence. Here we consider more standard welding currents of 150, 200 and 250 A, and compare the results with those for 400 A. The other initial and boundary conditions, including the gas flow rate 500 cm3 s−1, remain unchanged.
Figure 11 shows the distribution of iron vapour mole fraction for different arc currents. The iron vapour mole fraction immediately above the workpiece and in the arc column increases with current, with a large increase in mole fraction occurring when the current increases from 250 to 400 A. This higher metal vapour mole fraction near the workpiece leads to increased values of the ordinary diffusion coefficient (figure 10(a)) and a larger mole fraction gradient, leading to stronger transport of the metal vapour into the recirculating flow.
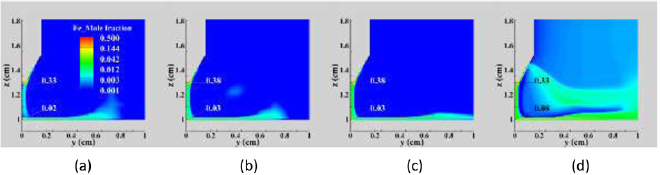
Figure 11. Distribution of iron vapour mole fraction in a vertical cross-section for the Fe–Ar arc (a) 150 A, (b) 200 A, (c) 250 A and (d) 400 A.
Download figure:
Standard image High-resolution imageIn all cases, there is a relatively high concentration of iron vapour around the cathode tip, with the highest concentration occurring just below the tip. In contrast to the trend seen near the workpiece, the iron vapour mole fraction near the cathode tip is slightly reduced when the current increases from 250 to 400 A. This is a consequence of the higher temperature near the cathode tip in the 400 A case. This reduces the electric field and temperature diffusion coefficients and increases the ordinary diffusion coefficient in this region, reducing the confinement of the metal vapour near the cathode tip.
At high currents, the increased plasma flow speed driven by the higher j × B force leads to an increased radial speed near the anode surface, sweeping metal vapour further away in the radial direction as shown in figure 11(d).
Figure 12 shows the distribution of temperature at different arc currents. With the increase of arc current from 150 to 400 A, the arc maximum temperature increases steadily from 15 000 K to over 22 000 K.

Figure 12. Distribution of temperature in a vertical cross-section for the Fe–Ar arc (a) 150 A, (b) 200 A, (c) 250 A and (d) 400 A.
Download figure:
Standard image High-resolution imageFigure 13 shows the radial distribution of temperature and radiative loss at  . It can be seen that a much higher temperature region is formed for R < 0.2 cm for the 400 A case; this is also evident in figure 12(d). However, the temperature drops more rapidly for R > 0.35 cm due to the higher concentration of iron vapour in that region (figure 11(d)); for the lower arc currents there is little iron vapour at R > 0.35 cm.
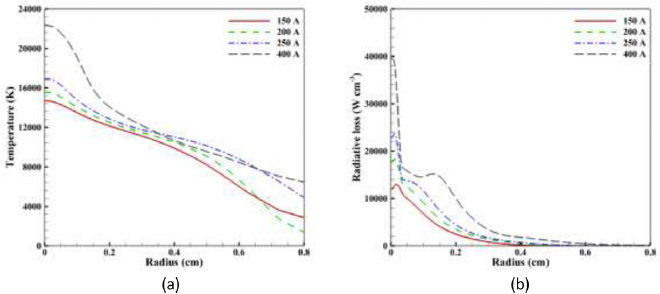
Figure 13. Radial distribution of (a) temperature and (b) radiative loss at  for the four arc currents.
Download figure:
Standard image High-resolution imageIncreasing the arc current leads to an increase of radiative loss in the arc. A particularly significant increase of radiative loss is identified when arc current increases from 250 to 400 A, due to higher iron vapour concentration and hotter arc. A second peak of radiative loss for the 400 A is observed around R = 0.15 cm due to argon ionization, as was discussed for figure 5. This second peak is not observed for the lower currents since the temperature around R = 0.15 cm is below the argon ionization temperature.
The size of the high-temperature plasma region (T ⩾ 10 000 K) increases with arc current except at 400 A (figures 12 and 13(a)). At lower currents, the increased ohmic heating ( ) with arc current dominates. At 400 A, the increased metal vapour mole fraction increases the radiative losses (figure 13(b)), which counteracts the increased ohmic heating at larger radii. Near the arc axis, the ohmic heating dominates so the arc temperature here is highest at 400 A.
The radial dependence of the radiative loss (figure 13(b)) is consistent with the strong dependence of the net emission coefficient on temperature (figure 2) [4]. In the 400 A case, the local minimum in radiative loss at R = 0.13 cm (also apparent in figure 5) is due to the decreased net emission coefficient at the corresponding temperature; this is in turn related the ionization of argon, with Ar+ becoming the dominant species above 15 000 K [38].
6. Comparison with measurements
Our results predict that iron vapour is present in significant concentrations not only near the anode workpiece, but also in the arc column and near the cathode tip. While the iron vapour mole fraction near the anode and in the arc column is predicted to largest for a high arc current of 400 A, it is also predicted to be present at more standard welding currents of 150, 200 and 250 A. Indeed, the iron vapour mole fraction near the cathode tip is predicted to be higher at 200 A and 250 A than at 400 A.
As noted in section 1, measurements and recent models of helium TIG welding of stainless steel have shown that metal vapour not only exists near the weld pool, but is also present in the arc column and near the cathode tip [14, 16, 18].
Previous measurements of argon TIG welding have found metal vapour near the pool surface, for example for a copper anode [8, 40], an iron anode [10] and a stainless-steel anode [9]. In all but the last case, it was found that the arc temperature near the anode surface decreased when metal vapour was present. In [9], the metal vapour concentration was very low, possibly due to the fact that the stainless steel was in the form of a cylindrical plug inserted into a water-cooled copper plate and so may have been cooler than a stainless-steel plate. However, in no case metal vapour was reported near the cathode region.
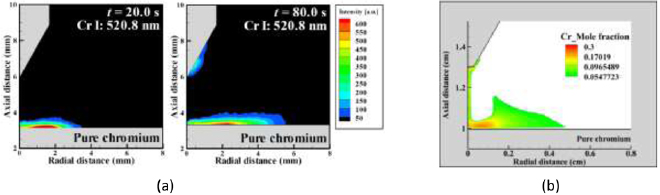
We have performed emission spectroscopy measurements of argon TIG welding of pure chromium. A high-speed camera and a monochromator were used to image the Cr I line radiation at 520.8. An Abel inversion was performed to give the radial dependence of emission intensity. The continuum radiation at 510.0 nm was subtracted from this signal. Further details of experimental procedures and image processing techniques are given by Tanaka et al [41]. Measurements were performed for a stationary 150 A arc.
Figure 14(a) shows the distribution of chromium vapour in an argon arc after 20 s and 80 s welding time, respectively. After 20 s welding time, chromium vapour was observed above the anode within a radius of 3.5 mm, and no chromium vapour was found near the cathode tip. However, by extending the welding time to 80 s, the presence of chromium vapour was observed near the cathode tip as well as above the anode. Chromium vapour above the anode extended to a radius of 5.5 mm, indicating an enlarged weld pool.
Figure 14. Distribution of chromium vapour during argon TIG welding of pure chromium (a) experiment image (b) simulation results.
Download figure:
Standard image High-resolution image
Measurements were also attempted for an iron anode using the Fe I line at 537.1 nm. In this case, no iron vapour was detected at any location in the arc; this is most likely due to the weakness of the emission line. This is consistent with results obtained for helium TIG welding using the same spectral lines, in which the Fe I emission intensity was much lower than that of Cr I [41].
To directly compare the predictions of our model with the measurements, we performed calculations for argon TIG welding of pure chromium by replacing the properties of iron by those of chromium in the anode and in the arc. The converged steady-state simulation results represent the conditions of the extended welding time of 80 s in the experiment, by which time the metal vapour distribution was stabilized. Results are presented in figure 14(b). The simulations predict the presence of chromium vapour above the anode, near the cathode tip and in the arc column.
In the experiment, no chromium vapour is observed in the arc column. Further, the maximum emission intensity in the cathode region is above the tip, and the maximum emission intensity near the anode is at a radius of about 2 mm. The model predicts the presence of chromium vapour in the arc column, and that the maximum chromium densities are below the cathode tip and near the anode at radii of less than 2 mm. The discrepancies are mainly due to the fact that chromium will be mainly in the form of ions at temperatures above about 8000 K, and these ions are not detected in the measurements. Hence, the measurements will only detect chromium in the cooler regions away from the arc axis. A further reason for the differences between the measurements and the predictions of the model is that sensitivity of the image processing technique used in the measurements is limited to 50 au, and the predicted chromium mole fraction in the arc column is relatively small.
7. Conclusions
We have examined the transport of metal vapour in an argon TIG welding arc using an axisymmetric computational model that includes the tungsten cathode and iron anode in the computational domain. Unlike previous studies of metal vapour in such arcs, we have used the combined diffusion coefficient method, which takes into account ordinary diffusion and diffusion driven by gradients of pressure and temperature and by the electric field, and which is equivalent to a full multicomponent diffusion treatment. Apart from one preliminary calculation, previous studies have employed only approximate approaches and have only considered ordinary diffusion.
We have presented a detailed comparison of results obtained including and neglecting the presence of iron vapour for a relatively high arc current of 400 A. Unlike previous studies, which predict that metal vapour is confined to the region near the anode, we find that metal vapour becomes concentrated near the cathode tip and is also present in the centre of the arc column.
The presence of metal vapour leads to a large reduction of the arc temperature compared to the values predicted for a pure argon arc. The main reason for this is found to be the large increase in radiative cooling, which is a consequence of the larger net emission coefficient for iron vapour. The presence of iron vapour also leads to a considerable change in the current density distribution, with an increase near the cathode and a decrease in other regions. The decreased current density near the anode leads to a decrease in heat transfer to the anode and a shallower weld pool.
The mechanisms of iron vapour transport were investigated by comparing results obtained omitting some of the diffusion driving forces. Both diffusion and convection are found to contribute to the iron vapour transport in the arc plasma. The convective flow tends to sweep the iron vapour radially outwards. However, some of the metal vapour diffuses upwards into the recirculating flow region; this is mainly due to ordinary diffusion. The recirculating flow carries the iron vapour to the cathode region. Here, the diffusion driven by the electric field and temperature gradient traps the metal vapour at the cathode tip, causing its concentration to build up until ordinary diffusion is large enough to transport the metal vapour into the downwards convective flow induced by the plasma jet. These mechanisms differ considerably from the case of helium TIG welding, in which diffusion driven by the electric field transports metal vapour directly upwards from the weld pool towards the cathode.
The influence of the arc current was examined by comparing results obtained at 150, 200, 250 and 400 A. More iron vapour is produced at the highest current; however, the concentration near the cathode tip is predicted to be smaller because the temperature and electric field diffusion coefficients are smaller at the higher arc temperatures near the cathode.
We have presented measurements of atomic chromium line emission in a 150 A argon TIG arc with a chromium anode that show the presence of chromium vapour near the cathode as well as the anode. A comparison with the predictions of the model for these conditions shows reasonable agreement, with the discrepancies explained by the fact that the measurements cannot detect chromium in the higher temperature regions since the chromium will be ionized.
In summary, the present study demonstrates the importance of metal vapour in argon TIG welding, showing that metal vapour influences all regions of the arc plasma, not just that near the weld pool surface. The presence of metal vapour also reduces the weld pool depth and volume, and so has an important effect on the welding process.
Acknowledgments
JX thanks the CSIRO Research Plus Postdoctoral Fellowship scheme for support of this work and Dr Fiona F Chen of CSIRO for helpful discussions and assistance in data analysis. HP acknowledges the support from the Fundamental Research Program (No. PNK6350) of the Korea Institute of Materials Science (KIMS). KT, MS and MT acknowledge the support of the Structural Materials for Innovation of the Cross-ministerial Strategic Innovation Promotion Program (SIP) of Japan Science and Technology Agency.