

Abstract
The present study focuses on the utilization of green silver nanoparticles, as they are preferred for sensing applications due to their environmentally friendly nature. We have examined the optical and electrochemical sensing behavior of silver nanoparticles from Agaricus bisporus (AgNP-AB) towards Hg(II) ions. The AgNP-AB was prepared by microwave reactor. The synthesized AgNP was used for the sensing of Hg(II) ions without the use of modifiers or further sophisticated instrumentation. The synthesized nanoparticles were successfully characterized by different techniques. AgNP-AB leads to aggregation with the addition of Hg(II) ions in aqueous medium, and develops a color change from brown to black which leads to the formation of AgNP-AB-Hg(II) complex. Moreover, the metal sensing ability of AgNP has been explored using electrochemical studies. AgNP-AB modified platinum electrode (AgNP-AB/PE) was developed for the fast sensing of toxic Hg(II) ions. The sensor exhibits a good limit of detection at 2.1 × 10⁻⁶ M. The sensitivity of AgNP-AB/PE towards Hg(II) ions was analyzed with various metal ions. The sensing skill of the developed system was successfully checked with real water samples from Vembanade Lake, Kumarakom, Kerala. AgNP from A. bisporus is highly versatile and promising for different environmental applications.
Export citation and abstract BibTeX RIS
1. Introduction
Controlling the levels of deadly metals is important due to their severe adverse consequences for human health and the environment (Campbell et al 2003). Metal poisoning arises from diverse sources. Among the heavy metals, mercury is one of the most hazardous metals and has drawn great attention due to its high toxicity (Zahir et al 2005, Zhang et al 2011, Kiran 2014). The Hg(II) ion is one of the most stable forms of mercury, which exists in water because of its high solubility (Farhadi et al 2012). World Health Organization reports show that the allowed limit of mercury in drinking water is 30 nM (Jeevika and Shankaran 2016). Mercury pollutants mainly come from power plants (Wang et al 2004), fossil fuels and forest fires. In recent years the mercury level has suddenly increased due to the burning of municipal and medical wastes, and discharges from the mining and paper industries. The main physical problems arising due to mercury poisoning include hearing damage, muscle weakness, skin rashes, poor eyesight and problems with speaking. Thus, highly selective techniques are required for the detection of toxic Hg(II) ions in order to preserve human health. Many methods have been reported for the sensing of Hg(II) ions to date. These include the use of polymeric materials (Tang et al 2006), a chemodosimeter-functionalized sensor (Lee et al 2009), absorption/emission spectrometry (De Castro Maciel et al 2003, Yang et al 2005), gold-based thin films (Morris and Szulczewski 2002), bio-composites (Ono and Togashi 2004) and flame photometry (Kuswandi et al 2007). These techniques exhibit good performance, but are time consuming and require expensive instrumentation (Fan et al 2010). Thus there is still a need for the creation of a new practical technique for the fast sensing of Hg(II) ions. New optical sensors providing rapid responses have been much recommended because of their selectivity, sensitivity, low-cost and ease of measurement (Zhou et al 2014). Such sensors are applied to diverse targets such as water pollutants (Daniel et al 2009, Xiao and Yu 2010), pesticides (Dasary et al 2009, Zhao et al 2009, Barman et al 2013, Maiti et al 2013), viruses (Niikura et al 2009) and cancerous cells (Huang et al 2007).
New arenas are opened up by nanotechnology and nanoscience for different applications including the fabrication of highly sensitive sensing methods, particularly gold- and silver-based optical sensors (Vinod Kumar and Anthony 2014). Among the various nanoparticles, silver and gold nanoparticles are significant due to their optical properties resulting from the surface plasmon resonance (SPR) absorption band in the UV–vis region. Thus researchers are focusing on fabricating optical sensing systems using these nanoparticles (Bothra et al 2013). Compared to gold nanoparticles, silver nanoparticle (AgNP) based optical sensors have been more popular in recent years due to their low-cost, simplicity, outstanding stability, excellent biocompatibility and easy control (Huang et al 2010). Unmodified AgNP is used in optical sensors for the detection of various metal ions (Ravindran et al 2012). Green nanoparticles using plant extracts have received great attention in recent years because of their unusual features such as low-cost, lack of hazardous chemicals and ease of handling (Balavigneswaran et al 2013). Numerous research groups have used various plant extracts for the synthesis of AgNP, including camphor (Begum et al 2009), hibiscus (Anthony 2011), aloe vera (Sönnichsen et al 2005), neem (Xu and Suslick 2010) and black tea (Maiti et al 2015). Optical sensors are more competent than other conventional techniques; it is very desirable to create a highly selective and sensitive optical system for economical applications and practical uses. In optical sensing, AgNP is of interest because the sensing can be clearly visualized by the naked eye, allowing highly sensitive detection with limited use of materials (Selvan et al 2013, Swarnali et al 2016). The nanoparticle-based optical sensor is stable and does not undergo photobleaching (Luo et al 2006). In the present investigation, AgNP is synthesized from extract of Agaricus bisporus (mushroom). A. bisporus is a very good source of vitamin D, vitamin C, thiamine and riboflavin. The presence of the polyphenol group is responsible for the development of Ag0 and AgNP stabilization (Philip 2010, Farhadi et al 2012, Rameshkumar et al 2013). Moreover, the edible A. bisporus has very high nutritional value, motivates the immune system, and is a good source of natural antimicrobial substances that have been used to treat against bacterial infections. Numerous proteins with various biological activities are produced by mushrooms (Mohammad et al 2012, Muna et al 2015, Liyan et al 2017). A. bisporus could be a large source of antitumor and antioxidant compounds. For a long time in Asian countries, great numbers of edible mushrooms have been taken as mineral and vitamin supplements. Studies on edible mushrooms have revealed valuable activities related to biological responses, such as chemotherapeutic, hypoglycemic, chemopreventative, immune modulatory and hypocholestemic effects.
Furthermore, mushrooms themselves have the capacity to clean up soil polluted with toxic heavy metals. Thus we selected a mushroom for AgNP synthesis because of its tremendous properties in the field of the biosorption of metals. The optical method has practical importance for the sensing of Hg(II) ions in pharmaceutical, clinical, food, industrial and environmental analysis (Wang et al 2012).
In recent years, metal nanoparticles have been extensively used for various electrochemical applications. Among the metal nanoparticles, AgNP is the material mainly used for this purpose. The unique features of AgNP makes it appropriate for the designing of new sensing devices, particularly electrochemical sensors. AgNP has the capacity to improve the electron transfer between the electrode surfaces that furnish the electrochemical behavior of the system.
In this investigation, we fabricated a new and simple dual sensor (optical and electrochemical) for Hg(II) ions using unmodified green AgNP. This dual sensor offers simultaneous detection of Hg(II) ions with the same material at minimum time and maximum efficiency. Moreover, the developed system can be used as an optical and electrochemical sensor alone without any efficiency loss. Developing a less expensive system with a dual functioning application was very difficult. But here, the optical sensor AgNP-AB and electrochemical sensor AgNP-AB/PE exhibit good selectivity towards Hg(II) ions in the presence of various metal ions. All these results suggest that synthesized AgNP-AB has great potential for numerous environmental applications.
2. Experiment
2.1. Instruments
UV–vis absorption spectra were obtained using a Shimadzu 2400 UV–vis spectrophotometer. Fourier transform infrared spectroscopy (FT-IR) studies were recorded with a Perkin-Elmer 400 FT-IR spectrometer. The crystalline nature of the AgNP-AB examined by x-ray diffraction (XRD) patterns was captured by a PAN analytic XPERT-PRO. Transmission electron micrographs were recorded by a JEOL-2100 model transmission electron microscope fitted with an energy dispersive x-ray spectrometer. All electrochemical studies were performed with a model Biologic SP-200 electrochemical workstation. Photographs of samples were captured with a Canon 530A camera. The AgNP was synthesized using a microwave reactor.
2.2. Materials
All the reagents used were of spectral and analytical grade with high purity. The mushrooms (A. bisporus) were purchased from a nearby shop and washed with Millipore water. Silver nitrate (AgNO3) was obtained from Merck (India). The metal salts included mercuric chloride (HgCl2), copper chloride (CuCl2), nickel chloride (NiCl2), chromium chloride (CrCl3), zinc chloride (ZnCl2) and cadmium chloride (CdCl2) (Sigma-Aldrich). All the stock solutions of metal salts were prepared in Millipore water. All glassware was systematically cleaned with Millipore water before use.
2.3. Preparation of A. bisporus extract
The small pieces of 30 g A. bisporus were mixed with 100 ml Millipore water and boiled for 2 h until a dark-colored solution was obtained. After cooling, the solution was filtered through a Whatman 42 filter paper to avoid unwanted particles and stored at below 3 °C for further use.
2.4. Synthesis of AgNP using A. bisporus extract (AgNP-AB)
For the synthesis, AgNO3 solution (1 mM, 48 ml) was mixed with A. bisporus (12 ml) extract in a 100 ml beaker, stirred for 5 min and placed in a microwave synthesizer at 600 W with a frequency of 2450 MHz. The solution was subjected to microwave irradiation for 30, 60, 90 and 120 s. The light yellow color of the solution turned to a brown color. The UV–vis absorption spectra were recorded for each experiment in order to confirm the formation of AgNP-AB.
2.5. Optical sensing of Hg(II) ions by AgNP-AB
The optical sensing of aqueous Hg(II) ions was carried out with AgNP-AB in Millipore water at room temperature. For this, a definite quantity of Hg(II) ions (0–90 μM) was added to freshly prepared AgNP-AB (3 ml) and the solution was stirred for 1 h at room temperature. While stirring, the color of the solution changed from brown to black due to complexation of AgNP-AB with Hg(II) ions and the maximum complexation was shown by 90 μM Hg(II) ion solution. The SPR absorption band of AgNP-AB with and without Hg(II) ions was recorded with a UV–vis absorption spectrophotometer.
2.6. Fabrication of AgNP-AB modified platinum electrode (AgNP-AB/PE)
Before fabrication, the platinum electrode (PE) surface was polished well with a 1 μM polishing diamond along with 0.05 μM alumina. The surface was cleaned with cotton and the electrode was sonicated in distilled water for 5 min. After sonication and drying, the synthesized AgNP-AB was coated on the surface of a PE and dried under an IR lamp. The entire experiment was carried out at room temperature.
2.7. Electrochemical sensing of metal ions using synthesized AgNP-AB
The electrochemical behavior of AgNP-AB in acetate buffer solution (ABS) at different pH levels and at varying scan rates against metal ion sensing on a PE was investigated with cyclic voltammetry (CV) within a suitable potential range. The efficiency of sensing of the modified electrode was evaluated with various metal ions. The detection limit was analyzed with differential pulse voltammetry.
2.8. Preparation of real water samples for electrochemical sensing
A water sample from Vembanade Lake (Kumarakom, Kerala) was taken for analysis. The water sample was filtered by a filter membrane with 0.22 μm millipores to avoid unwanted solid suspensions. The water sample was spiked with an appropriate amount of standard solutions of 10 μM Hg(II) ions and sufficient volume was taken for analysis.
3. Results and discussion
3.1. Green synthesis of AgNP-AB
For the synthesis of AgNP-AB, AgNO3 solution (1 mM) was mixed with A. bisporus extract in a 100 ml beaker and placed in a microwave synthesizer at 600 W with a frequency of 2450 MHz for 60 s. The light yellow colored solution turned to brown, which confirmed the formation of AgNP-AB (figure 1).
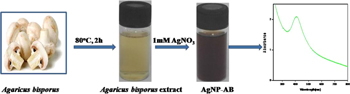
Figure 1. Schematic representation of the synthesis of AgNP-AB.
Download figure:
Standard image High-resolution image3.2. Optimization of the synthesis of AgNP-AB
For AgNP-AB synthesis, we tried three different compositions of AB extract and silver nitrate at pH 6.0 (figure 2(A)). For the 1:1 ratio, a broad peak was formed at 420 nm. A similar situation was obtained for the 1:2 ratio, but the broadening of the SPR band was reduced. The SPR band at 412 nm appeared smooth, sharp and intense for the 1:3 ratio. The sharp single SPR band at 412 nm represents monodispersed AgNP-AB. Thus the 1:3 composition was selected for further studies.

Figure 2. UV–vis absorption spectra of (A) AgNP-AB at different compositions of A. bisporus extract, (B) time dependent AgNP-AB synthesis, and (C) dependence of microwave power on AgNP-AB synthesis.
Download figure:
Standard image High-resolution imageTo optimize the time for nanoparticle formation, the UV–vis absorption spectrum of the solution was recorded after every 30 s (figure 2(B)). A peak was formed at 412 nm after 60 s irradiation. The absorption band at 412 nm in the UV–vis range is because of the SPR band exhibited by AgNP. The main advantages of microwave synthesis are much shorter time, low agglomeration and AgNP with narrow size distribution. When AgNO3 was added to A. bisporus extract, the phytochemicals and flavonoids present in the extract reduced Ag+ to Ag. In addition, the phytochemicals also act as a capping agent, which stabilizes AgNP without agglomeration.
The synthesis of AgNP was carried out using microwave irradiation power ranging from 200 W to 800 W as illustrated in figure 2(C). The UV–vis absorption spectra were recorded in each case, and it was found that the formation of the sol started at 200 W. The intensity of the band increased with irradiation power and a sharp, intense SPR band was formed at 600 W with irradiation for 60 s. When irradiation power increased above 600 W, the SPR band got broader, affecting the size and shape of the nanoparticles.
3.3. Complexation of AgNP-AB with Hg(II) ion
The optical sensing of aqueous Hg(II) ions was carried out with AgNP-AB in Millipore water at room temperature. For this, a particular amount of Hg(II) ions (0–90 μM) was added to freshly prepared AgNP-AB (3 ml) and the solution was stirred for 1 h at room temperature, during which the color of the solution changed from brown to black due to the complexation of Hg(II) ions with AgNP-AB (figure 3). The maximum complexation was shown by the 90 μM Hg(II) ion solution.
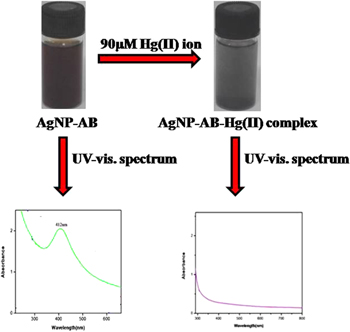
Figure 3. Schematic representation of the complexation of AgNP-AB with Hg(II) ions.
Download figure:
Standard image High-resolution image3.4. Characterization of AgNP-AB and AgNP-AB-Hg(II) complex
3.4.1. FT-IR
FT-IR spectra of A. bisporus extract, AgNP-AB, and AgNP-AB-Hg(II) are shown in figure 4. A. bisporus is a rich source of antioxidant glutathione. The spectrum of A. bisporus extract shows a broad peak at 3300 cm−1 which is due to the presence of the hydroxyl group in the plant extract. It is clear that the peak at 2525 cm−1 represents the thiol group. The peak at 1612 cm−1 represents the carbonyl group (C=O) linked with the NH bond. The IR band at 1370 cm−1 indicates the COO− group. The peak at 1040 cm−1 gives strong evidence for the stretching vibration of C–O–C. All the information supports the presence of glutathione in A. bisporus. Furthermore, in spectrum B, the intensities of all peaks are reduced, which suggests the involvement of all these groups for AgNP-AB synthesis. Spectrum C represents the AgNP-AB-Hg(II) complex; the peaks at 3300 cm−1 and 2525 cm−1 have vanished since the hydroxyl and thiol groups of glutathione are involved in complexation with Hg(II) ions. Moreover, a new IR band that formed below 1000 cm−1 confirmed the complexation of Hg(II) ion with AgNP-AB.
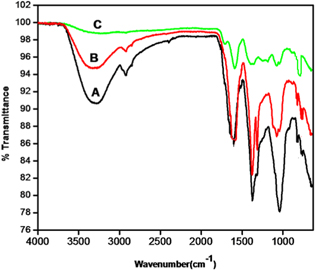
Figure 4. FT-IR spectra of (A) A. bisporus, (B) AgNP-AB and (C) AgNP-AB-Hg(II) complex.
Download figure:
Standard image High-resolution image3.4.2. XRD
XRD analysis was carried out to prove the crystalline nature of AgNP. The peaks at 38°, 44°, 64° and 78° are characteristic of AgNP. These peaks correspond to the (111), (200), (220) and (311) planes and indicate a fcc lattice in nature (JCPDS file no. 89-3722). Thus the XRD results (figure 5) confirm the crystalline nature of AgNP (Sijo et al 2017, Vijayan et al 2017, Anandalakshmi et al 2016, Hedaginal and Taranath 2016). However, when it formed a complex with Hg(II) ions, the intensities of the characteristic peaks of AgNP-AB reduced, which confirmed the decrease in crystallinity on complexation with Hg(II) ions.

Figure 5. XRD patterns of the AgNP-AB and AgNP-AB-Hg(II) complex.
Download figure:
Standard image High-resolution image3.4.3. High-resolution transmission electron microscopy (HR-TEM)
Transmission electron microscopy (TEM) is used to study the size and morphology of nanoparticles. Figure 6(A1) shows a TEM image of AgNP-AB. It is clear that the synthesized nanoparticles are uniformly distributed and are almost spherical in shape. The particle diameter distribution histogram revealed that the size of the nanoparticles is from 5 to 25 nm. The mean diameter calculated from the histogram is 14.13 nm. In addition, figure 6(A2) shows a TEM image of the AgNP-AB-Hg(II) complex in which it is clear that the nanoparticles are aggregated in the presence of Hg(II) ions. From figures 6(B1) and (B2) it can be seen that the diameter of the nanoparticles increased from 14.13 to 19.23 nm. This is due to the complexation between AgNP-AB and mercury ions. The increase in particle size confirms the existence of the Hg(II) ions in the sol of AgNP-AB. The selected area electron diffraction (SAED) pattern of AgNP-AB (figure 6(C1)) is featured to (111), (200), (220) and (311) planes which correspond to the fcc structure of AgNP-AB. Thus the sharp and clear circular rings confirm that the AgNP-AB is highly crystalline and monodispersed in nature. In the case of the SAED pattern of the AgNP-AB-Hg(II) complex (figure 6(C2)), the intensity of the circular rings is diminished and some of the planes have vanished. This is due to the presence of Hg(II) ions in the sol of AgNP-AB. Due to the existence of the complex structure, the extent of crystallinity diminishes to some extent. The results confirm the formation of AgNP-AB and AgNP-AB-Hg(II) complex.
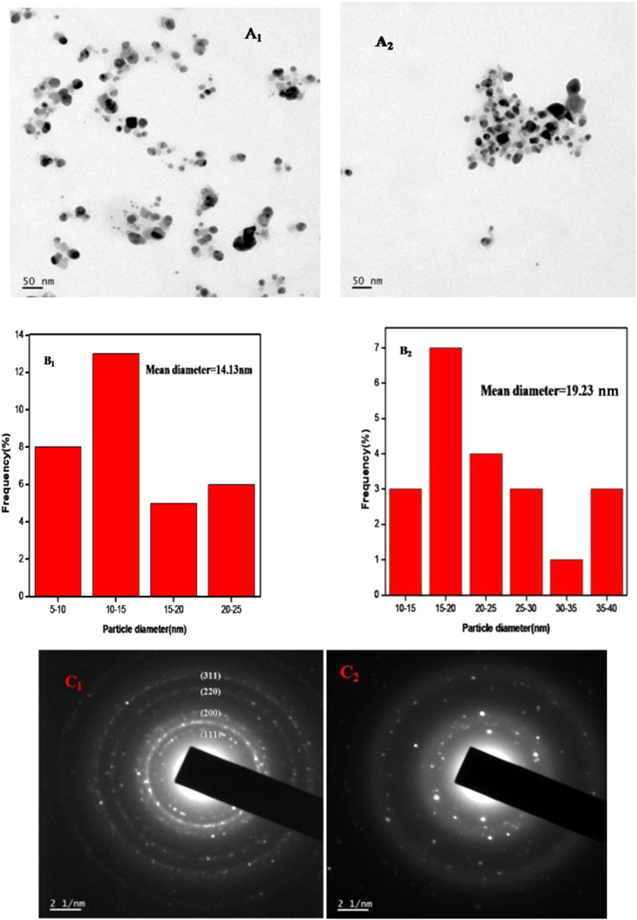
Figure 6. TEM images of (A1) AgNP-AB and (A2) AgNP-AB-Hg(II) complex; particle size histogram of (B1) AgNP-AB and (B2) AgNP-AB-Hg(II) complex; and SAED patterns of (C1) AgNP-AB and (C2) AgNP-AB-Hg(II) complex.
Download figure:
Standard image High-resolution image3.4.4. Energy dispersive x-ray analysis (EDAX)
The elemental composition of AgNP-AB and AgNP-AB-Hg(II) complex was investigated by EDAX. In figure 7(A), the strong signal at 3 keV represents silver and the peak at 0.2 keV is due to the existence of carbon from polyphenols/flavonoids of A. bisporus extract. Moreover, figure 7(B) confirms the formation of AgNP-AB-Hg(II) complex, and the signal near to 2 keV shows the presence of Hg(II) ions.

Figure 7. EDAX spectra of (A) AgNP-AB, and (B) AgNP-AB-Hg(II) complex.
Download figure:
Standard image High-resolution image3.5. Optical sensing of Hg(II) ions by AgNP-AB
3.5.1. Effect of concentration of Hg(II) ion solution
In order to check the effect of Hg(II) ion concentration on AgNP-AB, different concentrations of Hg(II) ions varying from 0 to 90 μM were added one at a time to 3 ml AgNP-AB and corresponding changes were recorded using UV–vis spectroscopy (figure 8). In all cases, the intensity of the characteristic peak of AgNP-AB at 412 nm decreased. This is due to the complexation of the Hg(II) ion with AgNP-AB. The maximum complexation was shown with 90 μM Hg(II) ion solution and the intensity of the absorption at 412 nm diminished due to complex formation. The solution's color subsequently changed to black. The intensity of the SPR band at 412 nm of AgNP-AB decreased with Hg(II) ion concentration and eventually vanished with 90 μM Hg(II) ion solution. The inset plot shows the calibration graph of Hg(II) ion concentration with absorbance at 412 nm.

Figure 8. UV–vis absorption spectra of AgNP-AB at different concentrations of Hg(II) ions. Inset plot: calibration curve of concentration of Hg(II) ion with absorbance at 412 nm.
Download figure:
Standard image High-resolution image3.5.2. Effect of pH
The influence of pH on Hg(II) ion sensing is shown in figure 9. AgNPs in ABS of varying pH ranging from 3.0 to 6.0 were prepared, 90 μM Hg(II) ion solution was added to each solution and UV–vis spectra were monitored. A decrease in intensity of the SPR absorption band of AgNP-AB was observed on the addition of Hg(II) ion solution. The absorption band of AgNP-AB at 412 nm vanished at pH 6.0, suggesting maximum complexation at pH 6.0.
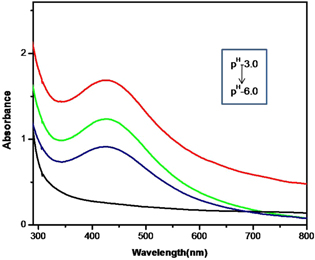
Figure 9. UV–vis absorption spectra of AgNP-AB-Hg(II) complex at various pH levels.
Download figure:
Standard image High-resolution image3.5.3. Selective detection of Hg(II) ion by UV–vis spectroscopy
To check the response of other metal ions towards AgNP-AB, the same concentration (90 μM) of various metal ion solutions was added to 3 ml AgNP-AB under the same conditions. Figure 10 represents the intensity of SPR absorption spectra of AgNP-AB with Hg(II) ions and other metal ions. Although the SPR band intensities of all metal ions with AgNP-AB decreased, they were not comparable with Hg(II) ions. The inset picture reveals the interactions of various metal ions with AgNP-AB. Hg(II) ion solution with AgNP-AB shows a color change from brown to black while the color changes of other metal ions with AgNP-AB are negligible. The results suggest that the green synthesized AgNP-AB is highly selective and specific towards Hg(II) ions and is not selective towards other metal ions.
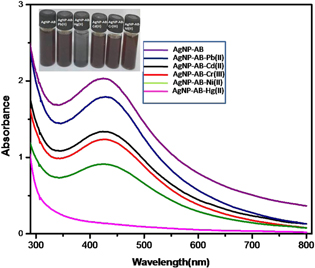
Figure 10. Selectivity studies of AgNP-AB with different metal ions.
Download figure:
Standard image High-resolution image3.6. Electrochemical sensing of Hg(II) ion using AgNP-AB modified PE
3.6.1. Sensing of Hg(II) ion by AgNP-AB/PE
The electrochemical properties of AgNP-AB modified PEs (AgNP-AB/PE) for Hg(II) ion sensing were analyzed by CV. Figure 11 presents the CVs of bare PE, AgNP-AB/PE and AgNP-AB/PE in the presence of Hg(II) ions in ABS (pH 6.0) at a scan rate of 100 mV s−1. Compared with bare PE, AgNP-AB/PE shows an intense reduction peak for CV runs. The presence of this sharp peak confirms the existence of AgNP-AB on the surface of the PE. But for AgNP-AB/PE in the presence of Hg(II) ion solution, a clear redox peak was formed. This was more positive and much higher than that of bare PE. Enhancement of the electrochemical properties of AgNP-AB is caused by several factors. The porous structure, large surface area and small size of AgNP-AB produce a fast diffusion on the surface of the PE. Thus the modification at the surface of the electrode contributes to enhancement of the electrochemical properties. Besides, AgNP-AB at the surface of the PE can easily catch Hg(II) ions. As Hg(II) ions are fair conductors of electricity, the results show a sudden change in the electrochemical response. All the results confirm that AgNP-AB/PE possesses an excellent electrocatalytic ability for the sensing of Hg(II) ions, which offers a new approach for the sensing of Hg(II) ions.
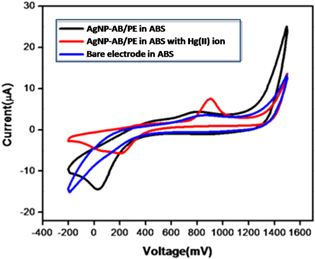
Figure 11. Comparison of cyclic voltammogram of AgNP-AB/PE with bare electrodes.
Download figure:
Standard image High-resolution image3.6.2. Effect of concentration of Hg(II) ion solution
The influence of Hg(II) ion concentration on AgNP-AB/PE is displayed in figure 12. The minimum and maximum detectable amount of Hg(II) ion by AgNP-AB/PE is analyzed using Hg(II) ion solutions of different concentrations. Increase in redox potential is observed when the Hg(II) ion concentration is increased from 0 to 90 μM. The maximum redox potential was obtained at a concentration of 90 μM Hg(II) ions. Thus 90 μM Hg(II) ions is selected as the optimum concentration for further studies.
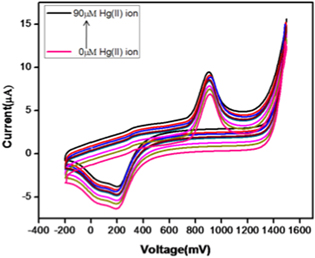
Figure 12. CV runs of AgNP-AB/PE at different concentrations of Hg(II) ion.
Download figure:
Standard image High-resolution image3.6.3. Effect of pH
The efficiency of AgNP-AB/PE electrochemical sensors depends on the pH of the test metal ion solutions. The effect of hydrogen ion concentration on Hg(II) ion sensing was checked in the pH range from 3.0 to 6.0 using ABS. From figure 13, it is clear that the optimum pH at which maximum and constant electrochemical response over the whole concentration of the test solution is obtained at pH 6.0. Above pH 6.0, the potential of the test solution decreased which affected the sensing efficiency of AgNP-AB/PE.
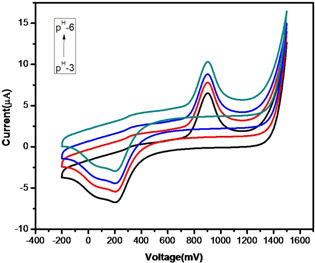
Figure 13. CV runs of AgNP-AB/PE at different pH.
Download figure:
Standard image High-resolution image3.6.4. Effect of scan rate
The effect of scan rate on the electrochemical response of the developed AgNP-AB was explored with CV (figure 14). The inset plot shows the linear relationship of anodic (Ipa) and cathodic current (Ipc) with scan rate. The redox current increased with scan rate and reached a maximum at 100 mV s−1. Thus 100 mV s−1 is selected as the optimum scan rate for all electrochemical studies.
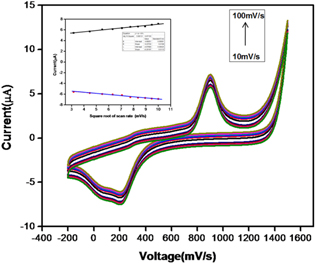
Figure 14. CV runs of AgNP-AB/PE in 90 μM Hg(II) ion in ABS at different scan rates; inset plot represents the linear relationship of the current with the square root of the scan rate.
Download figure:
Standard image High-resolution image3.6.5. Selectivity of AgNP-AB/PE towards Hg(II) ion
To examine the sensing of Hg(II) ions by AgNP-AB modified PE, the electrochemical responses of AgNP-AB/PE towards various metal ions including Hg(II) ion (90 μM) were monitored with CV. The results revealed that the redox peak was shown only by the Hg(II) ion. AgNP-AB/PE displayed sharp and clear anodic and cathodic peaks only for the Hg(II) ion. Figure 15 gives an explanation for the high sensitivity of the fabricated electrochemical sensor for Hg(II) ions.
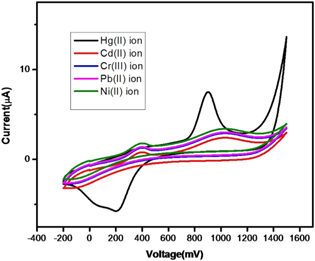
Figure 15. CV runs of AgNP-AB/PE towards various metal ions.
Download figure:
Standard image High-resolution image3.6.6. Differential pulse voltammetry
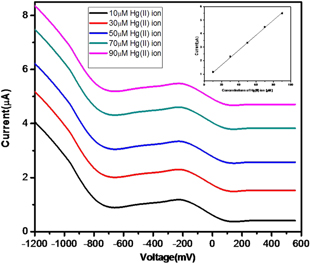
A well defined differential pulse voltammetry (DPV) plot was obtained at a scan rate of 100 mV s−1. The peak current increases with the consecutive addition of Hg(II) ion. The DPV plots for Hg(II) ion solutions of varying concentrations (10–90 μM) were recorded. The CV runs of DPV of AgNP-AB/PE for Hg(II) ion sensing are shown in figure 16 which is used for the determination of the limit of detection for Hg(II) ions. A calibration curve was plotted with current against concentration and a straight line graph was obtained with a correlation coefficient of 0.9987 (inset figure). The limit of detection is found to be 2.1 × 10⁻⁶ M.
Figure 16. DPV runs of varying concentrations of Hg(II) ions; inset plot shows peak current as a function of Hg(II) ion concentration.
Download figure:
Standard image High-resolution image
3.7. Sensing of Hg(II) ion in real samples
In order to check the efficiency of the developed sensor, AgNP-AB/PE was applied to a real sample. The sample was collected from Vembanade Lake, Kumarakom, Kottayam, Kerala. Mercury contamination in real water is difficult to detect. The water sample was spiked with Hg(II) ion solution and electrochemical studies were carried out in triplicate. The mean results are tabulated in table 1. This results highlight the possibility of using AgNP-AB/PE as an electrochemical sensor for Hg(II) ion detection from real environmental water samples.
Table 1. Detection of Hg(II) ion in real samples.
| Hg(II) ion (μM) | |||
|---|---|---|---|
| Sample | Added | Found | Detected (%) |
| Lake water | 10 | 10.08 ± 0.007 | 99.2 ± 0.005 |
4. Conclusions
A simple, low-cost and fast procedure is fabricated for easy and selective sensing of Hg(II) ions in the presence of various metal ions using green AgNP from A. bisporus. The Hg(II) ion sensing is based on the optical and electrochemical response of green AgNPs depending on the Hg(II) ion concentration. A perfect and reliable sensing of Hg(II) ions is achieved with these two techniques. The optical sensing of the Hg(II) ion was based on absorbance changes, which resulted in the complex formation of metal with AgNP-AB. The sensitivity of the developed sensor has been explored in the presence of various metal ions by both optical and electrochemical methods. The limit of detection was found at 2.1 × 10⁻⁶ M by differential pulse voltammetry. In the present work, various properties of AgNP were explored. The green AgNP-based dual sensor for Hg(II) ions might be applied for easy and fast Hg(II) ion determination in wastewaters.
Acknowledgments
Maria Sebastian would like to acknowledge Kerala State Council for Science, Technology and Environment (KSCSTE) for funding and great support.
Conflict of interest
The authors hereby declare that there is no conflict of interest regarding this paper.