

Abstract
Objective: A novel photoplethysmograph probe employing dual photodiodes excited using a single infrared light source was developed for local pulse wave velocity (PWV) measurement. The potential use of the proposed system in cuffless blood pressure (BP) techniques was demonstrated. Approach: Initial validation measurements were performed on a phantom using a reference method. Further, an in vivo study was carried out in 35 volunteers (age = 28 ± 4.5 years). The carotid local PWV, carotid to finger pulse transit time (PTTR) and pulse arrival time at the carotid artery (PATC) were simultaneously measured. Beat-by-beat variation of the local PWV due to BP changes was studied during post-exercise relaxation. The cuffless BP estimation accuracy of local PWV, PATC, and PTTR was investigated based on inter- and intra-subject models with best-case calibration. Main results: The accuracy of the proposed system, hardware inter-channel delay (<0.1 ms), repeatability (beat-to-beat variation = 4.15%–11.38%) and reproducibility of measurement (r = 0.96) were examined. For the phantom experiment, the measured PWV values did not differ by more than 0.74 m s−1 compared to the reference PWV. Better correlation was observed between brachial BP parameters versus local PWV (r = 0.74–0.78) compared to PTTR (|r| = 0.62–0.67) and PATC (|r| = 0.52–0.68). Cuffless BP estimation using local PWV was better than PTTR and PATC with population-specific models. More accurate estimates of arterial BP levels were achieved using local PWV via subject-specific models (root-mean-square error ⩽2.61 mmHg). Significance: A reliable system for cuffless BP measurement and local estimation of arterial wall properties.
Export citation and abstract BibTeX RIS
1. Introduction
Arterial blood pressure (BP) measurement in routine clinical diagnostic practice and hypertension management is often performed using cuff-type manometers. The conventional cuff-based methods (auscultatory and oscillometric techniques) provide only intermittent pressure levels with systolic and diastolic values. Short- or long-term continuous BP monitoring and BP variability have been well recognized as an accurate determinant of cardiovascular diseases (Peter et al 2014, Ding et al 2016a). The conventional cuff-based devices cannot be directly used for continuous BP monitoring and tracking of beat-to-beat variations. Continuous measurement of finger arterial pressure has been developed based on the volume-clamp method using a finger cuff and an inflatable bladder (Bogert et al 2005). However, all cuff-based BP assessment techniques are known to suffer from several limitations (Buxi et al 2015).
Cuff-less techniques for continuous BP measurement involving arterial pressure and flow wave dynamics are widely pursued (Mukkamala et al 2015, Ding et al 2016b). A number of approaches for continuous cuff-less BP measurement have been developed using regional pulse wave velocity (PWV), pulse transit time (PTT) and pulse arrival time (PAT) (Mukkamala et al 2015). However, the accuracy and reliability of cuffless BP techniques using regional transit time estimates are limited due to the following reasons: (a) variation in the pre-ejection period in PAT with cardiac electro-mechanical properties (Martin et al 2016), (b) regional PWV and PTT obtained from two distinct arterial sites with different mechanical characteristics provide only an average estimate (Pereira et al 2015), (c) coarse approximation of the pulse propagation distance in regional PWV assessment (Boutouyrie et al 2009, Pereira et al 2015) constituting error in estimated BP parameters, and (d) biomechanical equations relating flow wave dynamics and BP parameters hold true only when no wave reflections occur (Bramwell and Hill 1922, Westenberg et al 2012). These inherent sources of error in regional estimates create the necessity for frequent subject- and/or population-specific recalibration and, hence, limit the use of such devices in routine clinical diagnostic practice (McCarthy et al 2013, Mukkamala et al 2015, Ding et al 2016a). It is necessary to overcome the aforementioned shortcomings to develop an accurate cuff-free system for continuous BP measurement.
Studies have reported that PWV measurements made on a small segment of an artery (local PWV) represent the true blood pulse propagation velocity (Hermeling et al 2010, Pereira et al 2015). Precisely measured local PWV values are free from error due to a coarse approximation of propagation distance and multiple wave reflections. Hence, it can be considered as a better marker of arterial pressure levels. In this work, we propose a novel photoplethysmograph (PPG) probe for local PWV measurement. The design consists of two photodiodes placed at adjacent measurement points, excited using a single infrared light source (single-source PPG transducer). A prototype device was developed to demonstrate the feasibility of capturing dual PPG signals and beat-by-beat local PWV measurements using a single-source PPG probe. The performance and measurement accuracy of the developed local PWV device was initially validated by conducting in vitro experiments on a phantom. Real-time signal acquisition, repeatability and reproducibility of the device were further validated on 35 human volunteers. The efficiency of the device to detect beat-to-beat variation in local PWV due to arterial pressure changes was verified on young and healthy volunteers during their post-exercise recovery period. Further, cuffless estimation of arterial BP levels using local PWV with inter- and intra-subject mathematical models was demonstrated. It was also the objective of this study to assess the carotid to finger PTT (PTTR) and arrival time of the pulse wave at the carotid artery (PATC) so that it could be compared with the local PWV as markers of arterial BP levels.
2. Design of a single-source PPG transducer
The proposed single-source PPG probe design has a specific functional structure: two highly sensitive photodiodes symmetrically placed at a precise and well-known distance on either side of a single light source. A narrow beam infrared light emitting diode (IR LED) was used as the light source to illuminate the arterial site under measurement. Infrared wavelength was preferred to ensure deeper penetration of light into the tissue owing to its lower absorption by pigmentation (Delpy et al 1997, Cai et al 2008). Photodiodes were able to capture reflected light from two distinct measurement locations. The output signals represent underlying blood pulse wave propagation through the illuminated artery (reflectance photoplethysmography principle). A significant transit time delay was observed between simultaneously acquired dual pulse waveforms. This blood PTT delay obtained from a smaller arterial section was used for local PWV measurement. The initial prototype design was optimized for local PWV measurement from the carotid site (carotid local PWV). The carotid artery was preferred since it closely represents the central aortic conditions, is easily accessible and offers a straight branch-free pathway before bifurcation.
A three-dimensional (3D) sketch of the sensor assembly and packaging of the single-source PPG transducer is presented in figure 1. The IR LED (OSRAM Opto Semiconductors—SFH 4451, 850 nm) was soldered at the middle of a custom designed rectangular (36 mm × 8 mm) transducer printed circuit board (PCB). Two highly sensitive photodiodes with 16 mm2 window size (OSI Optoelectronics—16 CSL) were also soldered on the transducer PCB. Multiple trials on different subjects were conducted to finalize the center-to-center separation distance (δ) between the IR LED and the photodiodes. Initial experiment results revealed that the sensor arrangement with δ less than 6 mm does not provide an adequate penetration depth for incident light. As a result, the PPG probe was not able to detect arterial pulsations. Simultaneous acquisition of a dual pulse signal from multiple subjects was difficult when δ was greater than 20 mm. Hence, an optimum distance of δ = 12 mm was used in the present prototype design.
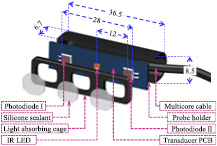
Figure 1. Single-source PPG transducer assembly (all dimensions are in mm).
Download figure:
Standard image High-resolution imageThe IR LED was driven by a high current (more than 45 mA) such that the light intensity was sufficient to obtain dual PPG signals irrespective of artery depth and thickness of tissue layer above the artery. The IR LED and photodiodes were kept inside a black-colored light-absorbing cage. This was used to avoid the permanent saturation of photodiodes due to the direct coupling of incident infrared light. Optimized cage dimensions with a 5 mm thick isolating barrier between the IR LED–photodiode pair was preferred. The transducer PCB and isolation cage were attached and enclosed in a probe holder. Finally, the IR LED and photodiodes were coated with a transparent general-purpose silicone sealant (Wacker-GP). The silicone coating on the light source and detectors helped to maintain optical continuity between the sensing area and the skin surface. The overall size of the developed single-source PPG probe was 36.5 mm × 8.5 mm × 6.7 mm with 28 mm end-to-end distance between the active windows of the photodiodes.
3. Signal acquisition and processing
3.1. Analog front-end (AFE) hardware features
The arterial blood pulse signal acquired using PPG transducers consisted of both static (DC) and pulsating (AC) components (Kamal et al 1989, Lindberg et al 1992). The DC component of the PPG signal was proportional to the total blood volume in the measurement area. The AC component was synchronized with the cardiac cycle and followed the arterial blood volume and flow changes. The AC component of the PPG signal was typically less than 0.2% of the DC amplitude. Removal of DC from the PPG waveforms was mandatory for the amplification of the AC components without causing permanent saturation of the amplifiers. In practice, it not straightforward to remove DC components from the PPG signals without introducing any additional signal propagation delay. Direct use of resistor–capacitor-based signal-conditioning filters for DC elimination causes significant inter-channel delay due to the mismatch between their characteristic time constants. A non-zero inter-channel delay was critical for transit time delay measurements employing sensors placed in close proximity. Hence, an AFE circuit with negligible inter-channel delay and a high-speed signal acquisition module were desired for reliable blood pulse detection.
An application-specific dual-channel AFE was designed and developed for simultaneous acquisition of PPG signals. The basic circuit schematic of the AFE, internal circuit diagram of single-source PPG probe and software architecture of the proposed measurement system is described in figure 2. The proposed AFE design was primarily focused on reducing the inter-channel delay between analog channels. Extraction of pulsatile components from the raw blood pulse signals using DC subtraction (without any signal-conditioning filters and energy storage elements in the principal signal path) significantly reduces the inter-channel delay (Nabeel et al 2017). As illustrated in figure 2, the output current signals from the photodiodes of the PPG transducers were initially converted into a voltage signal using transimpedance amplifiers. The average DC voltage of the PPG signal was extracted using an R–C network (corner frequency = 0.05 Hz) implemented in the parallel signal path. The raw PPG signal and its average DC voltage level from each channel were given to the  and
and  input terminals of precision instrumentation amplifiers (Texas Instruments—INA2126), respectively, via Opamp (Texas Instruments—TL082CP) based voltage buffers. Subtraction of the DC component from the original PPG signal and further amplification (gain ≈ 40 dB) were performed using an instrumentation amplifier. Amplified PPG signals were digitized using a simultaneous sampling data acquisition (DAQ) module (National Instruments®—PXIe-6368). Signals were continuously acquired at a sampling rate of 100 kS/s/channel with 16-bit resolution. Use of a simultaneous sampling DAQ card with high sampling rate helped to eliminate any mismatch due to digital pipelining, data transfer delays and timing error arising from the system sampling clock.

Figure 2. Local PWV measurement system block diagram indicating the internal circuit of a single-source PPG probe, AFE and software architecture.
Download figure:
Standard image High-resolution image3.2. Software architecture and signal processing
Signal acquisition and processing were performed using a custom program developed using LabVIEW (National Instruments®). Digital domain processing, transit time measurement, and PWV calculation were automatically performed. The measurement algorithm (figure 2) was divided into two steps: signal processing and pulse wave analysis. In the signal processing stage, acquired PPG waveforms were low-pass filtered using a Butterworth second order digital filter. Since the expected range of blood pulse signal frequency in humans is from 0.7 Hz to 3 Hz, the low-pass filter was realized with 10 Hz cut-off frequency, thus allowing a fundamental and at least two harmonics, while eliminating the out-of-band noise. The zero-phase difference between the raw signal and the filtered signal was ensured by applying a filter operation in the forward and backward directions (zero-phase shift filter operation). Further, the baseline drift of the PPG waveforms caused by body movement and respiration was removed using a wandering removal process (Fedotov et al 2014). Finally, cycle cutting was performed to separate each beat from the signal train and to collate the corresponding proximal and distal cardiac cycle pairs. For this, the diastolic minimum points of the proximal PPG signal were automatically detected from each beat. 50 ms prior to the diastolic minimum was taken as the fiducial point for cycle cutting. The time axis of the proximal and distal cardiac cycle pairs was synchronized by taking the same fiducial points in both channels. These cycle pairs were used for beat-by-beat local PWV measurement. The LabVIEW program also provided provision for real-time signal storage of acquired waveforms for future reference.
3.3. Pulse wave analysis
The arterial pulse signal is composed of a forward moving blood pulse wave superimposed with reflected signals from various bifurcation points in the arterial tree (Boutouyrie et al 2009). The reflected signals travel with different propagation velocity and amplitude. Depending on the arterial sites, the reflected signals alter the shape and timing information of original pulse signal. Since the early systolic region of blood pulse is minimally affected by the reflected waves (Hermeling et al 2007), the characteristic points for transit time measurements are often selected from this region. Characteristic points are specific identification points based on the physiological features of the blood pulse waveform. The time delay between characteristic points of the proximal and distal cycle pair is referred to as transit time (ΔT). Therefore, precise identification of characteristic points is highly desirable for accurate ΔT and PWV calculation.
3.3.1. Characteristics point identification.
The second derivative maximum technique (Kazanavicius et al 2005) was implemented for characteristic point identification. It was reported as an efficient method for repeatable measurements (Chiu et al 1991). The second derivative maximum technique uses the point at which the second derivative of a blood pulse cycle is maximal as its characteristic point. It is typically close to the systolic foot position, where the change in slope is a maximum. For a given cardiac cycle with dataset values (Ψ) collected at time intervals (t) having a finite sample number (k), the second derivative can be determined using the formula given in (1).

3.3.2. Local ΔT and PWV measurement.
The pulse wave analysis phase emphasizes accurate measurement of ΔT to obtain reliable carotid local PWV values. Using a characteristic point detection algorithm, the local ΔT was calculated from the fiducial points of the proximal and distal carotid pulse cycle pair (figure 3). The centre-to-centre distance between the photodiodes was taken as the blood pulse propagation distance (ΔD). Within a small distance (ΔD = 24 mm), the carotid artery was assumed to be a homogeneous section with no curvature. Finally, the carotid local PWV was estimated from each cardiac cycle in a beat-by-beat manner using (2).

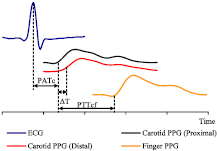
Figure 3. Determination of various blood PTT estimates from simultaneously acquired biopotential signals.
Download figure:
Standard image High-resolution image3.4. Finger PPG and ECG signal acquisition
Real-time finger PPG and ECG signals were also acquired along with dual carotid PPG for simultaneous measurement of local PWV, PTTR, and PATC. Synchronized acquisition of all four waveforms was performed using the developed local PWV measurement system advanced with two sub-units: one for the finger PPG signal acquisition and another one for real-time ECG signal acquisition. The carotid PPG AFE design was replicated in the finger PPG channel for signal acquisition using a transmittance-type fingertip PPG probe. The reference ECG signal was acquired using a commercial three-electrode system with a fully integrated single-lead AFE (Analog Devices Inc.—AD8232). Signals were digitized using a simultaneous sampling DAQ card (National Instruments®—PXIe-6368) at a sampling rate of 100 kS/s/channel. The signal processing software was also modified for simultaneous measurement of local PWV, PTTR, and PATC. As illustrated in figure 3, PTTR was determined as the time delay between the fiducial points of the proximal carotid PPG signal and the finger PPG signal. PATC was determined as the time delay between the R peak of the QRS complex of the ECG and the fiducial point of the proximal carotid PPG waveform. Figure 4 shows the developed prototype of a single-source PPG-based local PWV device advanced with ECG and finger PPG signal acquisition modules.
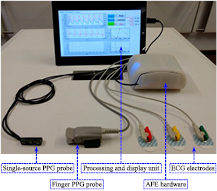
Figure 4. Single-source PPG probe and local PWV device with ECG and finger PPG modules. A screenshot of the GUI is shown in the display unit.
Download figure:
Standard image High-resolution image4. In vitro validation technique and results
The design efficiency and functionality of the single-source PPG probe and proposed local PWV device were experimentally validated by an in vitro study. The study was performed using a commercially available manikin phantom with realistic carotid artery anatomy (Blue Phantom-CAE Healthcare—BPIJ500-C). Figure 5(a) presents the experimental setup of the performed in vitro validation study. Arterial pulsations were manually simulated by controlled and repetitive pumping of the provided hand bulb. The study comprised the recording of the phantom pulse waveforms, and assessment of the pulse propagation velocity of blood mimicking fluid through the phantom (PWVP) using a single-source PPG transducer (measured PWVP) and a reference method (reference PWVP). A conventional two-point PWV measurement technique using dual pressure waves from identical tonometers (Millar® Instruments—SPT-301) was considered as the reference method (Salvi et al 2008, Nabeel et al 2017). Both the tonometers (uncalibrated) were rigidly fixed on the neck above the carotid artery of the phantom model with a separation of 70 mm. The single-source PPG probe was adhered to the phantom between the tonometers using transparent two-sided adhesive tape, as shown in figure 5(a).
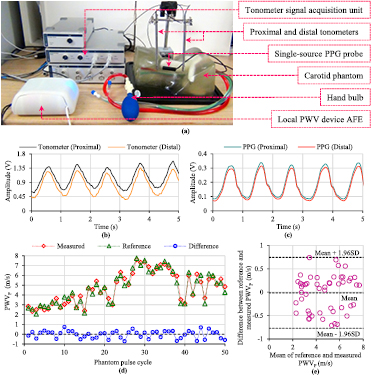
Figure 5. (a) In vitro validation experimental setup. (b) A sample of phantom pulse waveforms collected by the proximal and distal tonometers. (c) A sample of phantom pulse waveforms collected by the single-source PPG probe. (d) Cycle-by-cycle PWVP recorded using a reference method and device under test at various pressure levels. (e) Bland–Altman plot of the comparison between reference and measured PWVP.
Download figure:
Standard image High-resolution imagePhantom pulse waveforms detected by the single-source PPG transducer were acquired and processed using the prototype local PWV device. Tonometer signal acquisition and processing were performed using ADInstruments' LabChart software via Bridge Amp and PowerLab. Simultaneously acquired proximal and distal phantom pulse waveforms from the tonometers and single-source PPG probe are shown in figures 5(b) and (c), respectively, exhibiting the same average pulse rate. Figure 5(d) depicts the reference and measured PWVP values along with their difference (reference PWVP—measured PWVP), obtained from continuous phantom pulse cycles simulated at various pressure levels. 80% of the measurements were within an error band of ±0.5 m s−1, and the maximum difference between the reference and measured PWVP was 0.74 m s−1. Both methods correlated significantly (r = 0.97, p < 0.001). The Bland–Altman analysis (figure 5(e)) revealed a non-significant bias of −0.015 m s−1 with standard deviation (SD) of differences equal to ±0.38 m s−1. Validation measurements in the phantom demonstrated the expected functionality of single-source PPG probe and associated measurement system. The proposed device was found to allow accurate and reliable estimation of local PWV in a non-invasive and continuous manner.
5. In vivo validation materials and methods
5.1. Study objectives
- To verify the efficiency of the single-source PPG probe and associated measurement system for continuous signal acquisition, repeatable and reproducible local PWV measurement from multiple subjects.
- To perform an inter-subject correlation analysis of carotid local PWV, PTTR, and PATC versus brachial BP parameters.
- To examine the proposed local PWV device regarding its ability to measure the beat-by-beat variation of local PWV due to BP changes in individual subjects.
- To test the cuffless BP estimation accuracy of the proposed system with inter- and intra-subject models after best-case calibration.
5.2. Subject selection
Thirty-five normotensive subjects (age = 28 ± 4.5 years; gender: 23 males and 12 females; height = 168 ± 12 cm; weight = 73 ± 15 kg) were recruited for the in vivo validation study. Written informed consent was obtained from all participants after explaining the study objectives and protocols. Anthropometric measurements were initially taken and recorded in the subject database. Participants were requested to take 5 min rest in a temperature controlled room (23 ± 2 °C) before the study to achieve a steady heartrate and BP state.
5.3. In vivo study protocol
5.3.1. Blood pulse signal acquisition and local PWV measurement.
Local PWV measurements were performed on the left common carotid artery (sitting posture) by a single operator. A single-source PPG probe was placed at the carotid site after identifying the artery by palpation. Probe placement and orientation were adjusted to acquire dual PPG waveforms. The beat-by-beat local PWV value was recorded for 30 s on each subject for repeatability testing.
5.3.2. Local PWV reproducibility evaluation.
The reproducibility of the proposed system was tested by performing sequential measurements of the local PWV. Consecutive measurements were taken from each volunteer by the same operator for a fixed time interval (15 s) with a small break (10 s) between each trial. Mean local PWV values of consecutive trials were used for intra-operator reproducibility analysis.
5.3.3. BP measurement from the brachial artery.
A brachial BP measurement on the left arm using a pressure cuff was performed at various stages throughout the validation study. Clinical grade automated oscillometric BP apparatus (SunTech® 247™) was used for systolic blood pressure (SBP), diastolic blood pressure (DBP) and mean arterial pressure (MAP) measurements. The average BP values of two consecutive trials were used for analysis.
5.3.4. Simultaneous measurement of local PWV, PTTR, and PATC.
Once the data collection for repeatability and reproducibility analysis was finished, the volunteers were prepared with sensors for local PWV, PTTR, and PATC measurement. As explained in the previous section, carotid PPG signals were recorded using a single-source PPG probe. A commercially available SpO2 clip (NellcorTM—DS100A) was attached to the left index finger for finger PPG. Disposable ECG skin electrodes with pre-gelled Ag/AgCl sensors were placed on the left hand, right hand and right leg for an ECG signal. Brachial BP was recorded before the signal acquisition. Beat-by-beat carotid local PWV, PTTR and PATC were simultaneously measured for 30 s. Respective mean values and brachial BPs obtained from all 35 subjects were used for correlation analysis and to develop inter-subject cuffless BP models.
5.3.5. Local PWV measurement during post-exercise relaxation.
An exercise study was conducted to verify the ability of proposed device to detect local PWV variations due to arterial pressure changes. Only those individuals with age less than 30 years and no history of any serious diseases were recruited for this study (seven subjects; age = 24 ± 3 years). After the baseline measurements, volunteers were subjected to a running exercise on a treadmill (Afton—XO-150). Starting from the minimum speed (1 km h−1), the exercise continued for 10 min at various speed levels (maximum up to 10 km h−1). Volunteers were comfortably seated after the exercise for complete relaxation. During this period, the local PWV was continuously acquired from the left carotid artery, and the brachial BP was measured at regular time intervals. Measurements were recorded until the BP returned to the baseline value or remained steady. The data collected from the exercise study was used to develop intra-subject models for cuffless BP measurement. These models were tested using the second dataset of the baseline BP and local PWV values collected at random time intervals from the same subjects during their routine work.
6. In vivo study results and discussion
6.1. Measurement accuracy and potential error sources
Before the detailed analysis of in vivo study observations and results, a brief discussion about the accuracy of the measurement system and potential error sources in the recorded carotid local PWV are presented. Ambiguity in ΔD was controlled by precision placement of photodiodes during the final transducer assembly process. ΔD (=24 mm) was measured using a digital Vernier caliper (Mitutoyo—Digimatic Caliper—CD-6''VC) with an instrumental error of ±0.03 mm. Hence, a maximum of 0.125% error in ΔD (%εΔD = 0.125%) was expected in the prototype design of the single-source PPG probe.
Hardware inter-channel delay and the system sampling clock can introduce timing errors in local PWV estimates. The inter-channel delay obtained from five selected subjects with different heartrate and BP is presented in figure 6. It was measured by feeding the carotid PPG signal from a single sensor to both the input channels simultaneously. The band inside each box in figure 6 indicates the median of the inter-channel delay values obtained from multiple cycles. The bottom and top of the boxes indicate the first and third quartiles with vertical lines extending to the minimum and the maximum delay values, respectively. A maximum of 1.8% error in local ΔT (%εΔT = 1.8%) was expected due to hardware inter-channel delay. Timing errors caused by the sampling of the acquisition module (sampling rate = 100 kS/s/channel; clock period = 10 µs) was insignificant when compared to the expected local ΔT values. Further, the tissue transit time of infrared light waves is much shorter than the blood PTT. Any difference in tissue transit time at two measurement locations can be neglected due to similar skin and tissue composition within a small section. Therefore, the expected error in the carotid local PWV (%εlocal PWV = %εΔD + %εΔT) due to hardware limitations was less than 2%.
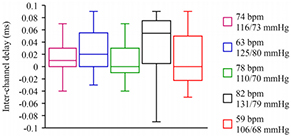
Figure 6. Box-and-whisker plot of beat-by-beat hardware inter-channel delay obtained from five subjects. The respective heartrate (in bpm) and SBP/DBP (in mmHg) of each subject are shown in the figure.
Download figure:
Standard image High-resolution image6.2. Reliability of carotid blood pulse signal acquisition
Proximal and distal blood pulse signals for local PWV measurement were acquired from multiple subjects under different physiological conditions. The measurement algorithm was susceptible to the quality of the acquired blood pulse waveforms. The prototype device was able to acquire dual PPG waveforms with a signal-to-noise ratio of approximately 28 dB, which was adequate for reliable local ΔT measurement using the second derivative maximum technique (Solà et al 2009). Figure 7 exhibits carotid blood pulse waveforms (after signal conditioning) acquired from a volunteer (age = 26 years, body mass index (BMI) = 25.05 kg m−2, SBP/DBP = 118/73 mmHg). The competency of the single-source PPG transducer to acquire distinct pulse waveforms from adjacent sites makes the proposed design perfect for local PWV measurement. The peak-to-peak amplitude of raw pulse waveforms was subjective and varied between 6 to 17 mVPP in individual subjects during the present study. The inter-beat period of the acquired PPG signals was compared against R–R interval of ECG waveform to ensure reliability. The mean absolute error in the inter-beat period measurement was less than 0.14%.

Figure 7. Simultaneously acquired proximal and distal carotid PPG waveforms of a particular volunteer using single-source PPG transducer.
Download figure:
Standard image High-resolution image6.3. Repeatability and reproducibility of carotid local PWV measurement
The prototype design of a single-source PPG probe was efficient and facilitates easy measurement of the beat-by-beat carotid local PWV. Artery detection, probe placement and orientation procedures, signal acquisition, and measurement process were completed within 2 min. Baseline carotid PWV estimates were less compared to the previously reported carotid-to-femoral and carotid-to-radial PWV (Reusz et al 2010). Mean carotid local PWV values obtained from 35 subjects were in the range 2.52 ± 0.41 m s−1. This was consistently observed for multiple subjects with high reproducibility under various physiological conditions. The obtained values were comparable with the carotid PWV reported in previous studies using ultrasound and accelerometer transducers (Sorensen et al 2008, Faita et al 2010). Figures 8(a)–(c) show the recorded beat-by-beat carotid local PWV values of three different volunteers (30 s data). The beat-to-beat variation was calculated by dividing the SD by the mean and expressing it as a percentage. The minimum and maximum beat-to-beat variation observed during the study were 4.15% and 11.38%, respectively. Relatively high beat-to-beat variation (7.01–11.38%) was observed in subjects with obesity and weak carotid surface pulsations.

Figure 8. Beat-to-beat variation of the carotid local PWV of three different subjects. (a) Age = 26 years, BMI = 25.05 kg m−2. (b) Age = 24 years, BMI = 26.76 kg m−2. (c) Age = 24 years, BMI = 30.96 kg m−2.
Download figure:
Standard image High-resolution imageRepeated sequential measurement of the local PWV by the same operator allowed evaluation of the reproducibility of the measurement system. Agreement between two consecutive sets of measurement (trial I and trial II) was evaluated via Pearson's correlation coefficient (r) and Bland–Altman analysis. The statistical significance of all tests was indicated by p-value <0.05. The mean carotid PWV from the first set of measurements did not differ significantly from the second set for each subject. As illustrated in figure 9(a), the Bland–Altman analysis shows a non-significant bias of 0.02 m s−1 with an SD of the differences equal to 0.11 m s−1. Agreement between the two consecutive measurements from multiple subjects is depicted in figure 9(b). The correlation between the two sets of measurements is highly significant (r = 0.96, p < 0.001). Study results favor the reproducibility of the developed local PWV measurement system.
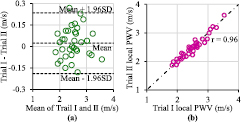
Figure 9. Local PWV reproducibility test results. (a) Bland–Altman plot showing the difference between two trials as a function of their average. (b) Correlation plot of trial I and trial II.
Download figure:
Standard image High-resolution image6.4. Cuffless BP estimation accuracy of local PWV, PTTR, and PATC
The single-source PPG device advanced with finger PPG and ECG sub-units was capable of simultaneous acquisition of the required biopotential signals. Reliable estimates of local PWV, PTTR (beat-to-beat variation <6.39%) and PATC (beat-to-beat variation <8.01%) were obtained. The absolute value of measured PTTR and PATC were in the ranges 229.16 ± 27.96 ms and 86.78 ± 12.61 ms, respectively. Mean carotid local PWV, PTTR, and PATC of all recruited volunteers were consolidated along with their brachial BP for statistical analysis and to develop inter-subject mathematical models for cuffless BP measurement. Figures 10(a)–(i) show the relationship between brachial BP parameters (SBP, DBP, and MAP) versus mean local PWV, PTTR, and PATC pooled over all 35 subjects. PTTR and PATC were preferred over respective regional PWV values in cuffless BP models in order to avoid error due to the coarse approximation of distance between the test points (Pereira et al 2015).
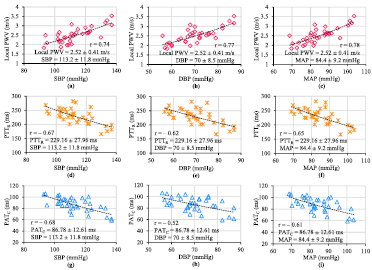
Figure 10. Plots showing the correlation between the measured carotid local PWV, PTTR, and PATC, and brachial SBP, DBP, and MAP pooled over all the subjects.
Download figure:
Standard image High-resolution imageThe logarithmic function provided the best monotonic fit with maximum correlation for the data points of each BP parameter versus each PTT estimate. Inter-subject mathematical models of the form BP = ϕ ln (υ) + ω (υ can be the local PWV or PTTR or PATC; ϕ, ω are population-specific constants), and the absolute value of correlation coefficients (|r|) are summarized in table 1. The correlation coefficients were statistically significant (p < 0.001) and all three transit time estimates were able to track BP parameters. However, the carotid local PWV showed better correlation (r > 0.74) with brachial BP levels than PTTR (|r| = 0.62–0.67) and PATC (|r| = 0.52–0.68). Inter-subject models derived from the first group of 35 subjects were used for cuffless BP estimation in a different group of 28 subjects (age = 29.5 ± 6 years, gender: 20 males and 8 females; height = 170 ± 9 cm; weight = 75 ± 12 kg). Local PWV, PTTR, PATC and reference brachial BP were recorded from the second group by following the same protocol discussed in section 5.3.
Table 1. Snapshot of PTT estimates versus reference brachial BP |r| values, inter-subject mathematical model and cuffless BP estimation accuracy.
| PTT estimates | BP parameters | |r| value | Inter-subject cuffless BP estimation model | Comparison of cuffless estimated BP versus reference brachial BP | ||
|---|---|---|---|---|---|---|
| RMSE (mmHg) | Bland–Altman analysis | |||||
| Error bias (mmHg) | SD of error (mmHg) | |||||
| Local PWV | SBP | 0.74 | SBP = 53.87 ln(PWV) + 64.12 | 7.93 | 1.15 | 7.98 |
| DBP | 0.77 | DBP = 40.39 ln(PWV) + 33.24 | 6.33 | 0.86 | 6.36 | |
| MAP | 0.78 | MAP = 44.86 ln(PWV) + 43.55 | 6.74 | 0.96 | 6.77 | |
| PTTR | SBP | 0.67 | SBP = −64.25 ln(PTTR) + 461.89 | 10.34 | −1.58 | 10.41 |
| DBP | 0.62 | DBP = −43.15 ln(PTTR) + 304.17 | 9.66 | −1.07 | 9.72 | |
| MAP | 0.65 | MAP = −50.18 ln(PTTR) + 348.34 | 9.82 | −1.21 | 9.88 | |
| PATC | SBP | 0.68 | SBP = −52.81 ln(PATC) + 348.34 | 9.21 | −0.88 | 9.29 |
| DBP | 0.52 | DBP = −29.34 ln(PATC) + 200.65 | 12.11 | −1.59 | 12.25 | |
| MAP | 0.61 | MAP = −37.17 ln(PATC) + 249.88 | 10.11 | −1.14 | 10.19 | |
The cuffless BP estimation accuracy of each transit time estimate was compared with the reference brachial BP via Bland–Altman analysis as well as by computing the root-mean-square error (RMSE). Comparison study results are presented in table 1. Bland–Altman analysis showed non-significant bias (absolute value <1.6 mmHg) for all estimated BP values. The carotid local PWV yielded good DBP estimates with a RMSE of 6.33 mmHg; it was 34% and 48% lower than the RMSE observed in cuffless DBP prediction using PTTR, and PATC, respectively. The local PWV also provided 23% and 14% lower RMSE for cuffless SBP prediction than PTTR, and PATC, respectively. Statistical comparison of the reference versus estimated BP parameters was made using Pearson's correlation analysis and Student's paired t-test. The difference between the reference and cuffless estimated BP in all nine cases was statistically insignificant (p > 0.05). However, the local PWV-based BP prediction method showed better correlation with reference values (SBP: r = 0.73, DBP: r = 0.79, MAP: r = 0.77; p < 0.001). Similar to PTTR, the PATC-based BP prediction method was moderately correlated with the reference BP parameters (r = 0.59–0.66; p < 0.05). For completeness, the conventional PAT (PAT at the fingertip (PATR)) acquired from the second group of volunteers was also used to predict the BP parameters. It was mapped through the PATR-based BP prediction models derived from the first group data. Even with the best possible calibration, PATR yielded RMSE > 15 mmHg and r < 0.55 (p < 0.05) with the reference while estimating cuffless SBP, DBP, and MAP.
6.5. Intra-subject local PWV–BP relationship for cuffless BP measurement
The treadmill-running exercise induced a wide range of BP and local PWV variation in individual subjects. An approximately 2.5–3.75 times increment in the carotid local PWV from the baseline value and proportional increment in BP parameters were observed after performing the exercise. Instantaneous variation in the local PWV due to arterial pressure changes during post-exercise recovery was efficiently tracked by the single-source PPG transducer. Figure 11 displays the post-exercise recovery curve (local PWV, brachial BP parameters, and heartrate as a function of time during the whole recovery period) of one subject (age = 26 years, BMI = 25.05 kg m−2). The dynamics of the curve, such as increment from the baseline value, recovery period and final steady values, were dependent on the individual's physiological factors. Based on the recovery characteristics, the post-exercise recovery curve was divided into two phases: (a) transient phase and (b) recovery phase. During the transient phase, the local PWV, BP parameters and heartrate decreased rapidly. The local PWV was scattered more in this phase due to heartrate variability, and unstable and fast breathing patterns. The local PWV and BP parameters continued to decrease at a lower rate in the recovery phase. Heartrate variability and breathing pattern were fairly stable in the second phase.

Figure 11. Carotid local PWV, brachial SBP, DBP, MAP and heartrate recorded during the post-exercise recovery period of a subject. Time = 0 s is immediately after the treadmill-running exercise.
Download figure:
Standard image High-resolution imageCorrelation between the intra-subject variations in the local PWV versus brachial BP parameters was obtained for each subject. The local PWV correlated equally well with SBP (r = 0.916 ± 0.042, p < 0.001), DBP (r = 0.947 ± 0.033, p < 0.001) and MAP (r = 0.929 ± 0.025, p < 0.001). This statistically significant tight correlation suggested developing the cuffless BP technique with intra-subject mathematical models for accurate measurement. Consistent with theory (Poon et al 2008, Mukkamala et al 2015), a logarithmic function provided the best monotonic fit for pairs of local PWV–BP data points. The developed intra-subject mathematical model was specifically of the form BP = Φ ln (local PWV) + Ω; Φ and Ω are subject-specific constants. The local PWV–BP relationship derived from the post-exercise recovery curve shown in figure 11 is depicted in figures 12(a)–(c). Similar models were developed for each subject by finding the curve that best fitted the data points obtained from their post-exercise recovery curve.

Figure 12. Intra-subject model fitting of (a) SBP versus local PWV, (b) DBP versus local PWV, and (c) MAP versus local PWV.
Download figure:
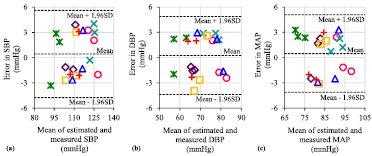
Standard image High-resolution imageLocal PWV values collected from the recruited subjects during their routine work (second dataset) were mapped through their respective mathematical models to predict the BP level. Figures 13(a)–(c) illustrate the Bland–Altman plots of the error between the cuffless estimated and measured BP levels over all of the subjects (different symbols in the plots correspond to each of the subjects). The proposed technique was able to predict SBP, DBP, and MAP with RMSEs of 2.61 mmHg, 2.32 mmHg, and 2.34 mmHg, respectively. The corresponding RMSEs offered by mapping the local PWV through inter-subject models were 7.93 mmHg, 6.33 mmHg, and 6.74 mmHg (refer table 1). In summary, cuffless techniques based on the local PWV using inter-subject models and best-case subject-specific calibration could potentially track arterial BP parameters with a level of acceptable accuracy. By introducing more convenient methods for intra-subject model development and improving form factor (example: single-source PPG patch), the proposed single-source PPG device could be used for cuffless, ambulatory BP monitoring at clinic/home and hypertension screening test.
Figure 13. Bland–Altman plots of the error between the estimated BP using inter-subject prediction models: (a) SBP, (b) DBP, and (c) MAP versus reference brachial BP.
Download figure:
Standard image High-resolution image
6.6. Limitations and future efforts
The present in vivo validation study was conducted on a small population of young and healthy subjects. On the other hand, the current subjects represent an important sub-population in the sense of early detection of cardiovascular diseases. An extensive validation study with a larger population, recruited from different age groups and various pathophysiological sub-populations would confirm and extend these results. Another limitation concerns the applicability of the proposed device for self-monitoring without the assistance of a trained operator. Future efforts are required to implement fully automated intelligent algorithms in the measurement software, to guide the patient regarding probe placement and orientation to acquire dual PPG with the desired signal quality for reliable measurements. Hence, the proposed device would turn out to be portable, self-monitoring cuffless BP equipment.
7. Conclusion
A prototype single-source PPG probe (dimension = 36.5 mm × 8.5 mm × 6.7 mm) for carotid local PWV measurement was developed and demonstrated. The measurement system consists of an application-specific AFE circuit (inter-channel delay <0.1 ms), simultaneous sampling DAQ module (100 kS/s/channel) and fully automated measurement software (developed using LabVIEW). The real-time measurement accuracy of the introduced local PWV device was demonstrated on an arterial flow phantom using a dual tonometer reference setup. There was no significant difference between the reference PWVP and measured PWVP values (absolute difference ⩽0.74 m s−1, r = 0.97, p < 0.001). The device was further validated by conducting an experimental in vivo study on 35 subjects. It was able to capture high-fidelity blood pulse signals (signal-to-noise ratio ≈ 28 dB) from small sections of the carotid artery. The carotid local PWV was measured from multiple subjects in a non-invasive and continuous manner (beat-to-beat variation = 4.15%–11.38%). Simultaneously measured carotid local PWV, PTTR, and PATC were compared as markers of BP, and arterial pressure levels were predicted using inter-subject models. Local PWV was slightly better than PTTR and PATC in terms of tracking SBP (r = 0.74), DBP (r = 0.77) and MAP (r = 0.78). Intra-subject BP–local PWV models derived from the post-exercise recovery curves of individual subjects (r > 0.916 ± 0.042) were more accurate in tracking acute changes in BP parameters (RMSE ⩽ 2.61 mmHg). Despite the practical feasibility of inter-subject models with population-specific calibration, the carotid local PWV offered acceptable accuracy for cuffless BP measurement via intra-subject models with subject-specific calibration. With successful future efforts, the proposed single-source PPG-based cuffless BP device could potentially be used for ambulatory and home BP monitoring, hypertension screening, and control.
Acknowledgments
This work was supported by Science and Engineering Research Board, Department of Science and Technology, Government of India.