


Abstract
We derived a new method for direct calculation of the modal contributions to thermal conductivity, which is termed Green–Kubo modal analysis (GKMA). The GKMA method combines the lattice dynamics formalism with the Green–Kubo formula for thermal conductivity, such that the thermal conductivity becomes a direct summation of modal contributions, where one need not define the phonon velocity. As a result, the GKMA method can be applied to any material/group of atoms, where the atoms vibrate around stable equilibrium positions, which includes non-stoichiometric compounds, random alloys, amorphous materials and even rigid molecules. By using molecular dynamics simulations to obtain the time history of each mode's contribution to the heat current, one naturally includes anharmonicity to full order and can obtain insight into the interactions between different modes through the cross-correlations. As an example, we applied the GMKA method to crystalline and amorphous silicon. The modal contributions at each frequency result from the analysis and thereby allow one to apply a quantum correction to the mode heat capacity to determine the temperature dependence of thermal conductivity. The predicted temperature dependent thermal conductivity for amorphous silicon shows the best agreement with experiments to date. The GKMA method provides new insight into the nature of phonon transport, as it casts the problem in terms of mode–mode correlation instead of scattering, and provides a general unified formalism that can be used to understand phonon–phonon interactions in essentially any class of materials or structures where the atoms vibrate around stable equilibrium sites.
Export citation and abstract BibTeX RIS

Original content from this work may be used under the terms of the Creative Commons Attribution 3.0 licence. Any further distribution of this work must maintain attribution to the author(s) and the title of the work, journal citation and DOI.
Introduction
The phonon gas model (PGM) originated from the behaviors observed in homogenous crystalline solids and it has exhibited remarkable success at describing the behavior of a wide variety of solids, microstructures, nanostructures and molecules [1–4]. In homogenous stoichiometric crystalline solid compounds, where there is both compositional and structural periodicity, the dynamical matrix determined from lattice dynamics (LD) consists of symmetric unit-cell blocks and as a result, all of the eigen solutions correspond to plane wave modulated vibrations (e.g., propagating modes). Plane wave modulated vibrations exhibit a well-defined phase and group velocity, because each wave has a clearly defined wavelength, and there is a clear dispersion relation. These eigen solutions/normal modes of vibration then transport heat as they propagate, with a clearly defined velocity, which is consistent with the PGM based physical picture of their transport. In the PGM, each mode carries energy  with velocity
  and mean free path (MFP)
  which is the product of the velocity and the time between mode to mode energy exchanges (e.g., scattering events). This physical picture [2, 3, 5–9] works well for homogenous crystalline materials and the thermal conductivity of virtually any solid compounds and their corresponding nanostructures can now be computed from first principles [2, 3, 10, 11]. Given its success, it has become the primary lens with which phonon transport is viewed.
The problem with ubiquitous usage of the PGM is that for systems that lack periodicity or compositional homogeneity, the eigen solutions/normal modes do not in general correspond to plane wave modulated vibrations with clearly identifiable wavelengths, and therefore one cannot define the phonon dispersion or velocity. The lack of a clearly defined velocity is critical, because the PGM hinges on the velocity being defined in order to properly describe a mode's contribution to thermal transport. Thus, for systems that lack periodicity, such as amorphous materials, random alloys or small molecules, using the PGM to describe their phonon transport is inconsistent with the atomic level vibrations. This issue is critical, because these classes of materials represent a major fraction of the materials used in various applications that involve heat transfer.
One class of materials that have proved difficult to explain even with effective MFP based arguments is amorphous materials. Several existing theories [12–15] have worked towards resolving this long-standing issue, but they are all based on the PGM and are therefore based on a modal description that is inconsistent with the modes of vibration in amorphous materials, which are largely non-propagating. To our knowledge the major exception has been the seminal work of Allen and Feldman (A–F), who made an important step forward by conducting LD calculations on supercells of amorphous Si (a-Si) [16–18]. In doing so, they developed a model for thermal conductivity that was, for the first time, based on the actual modes of vibration in an amorphous material, which resolved the major issue with previous work. Their results showed that there are distinct classifications of modes in non-periodic systems and they introduced a new taxonomy for the modes, namely propagons, diffusons and locons. A–F used the Kubo formula for thermal conductivity to calculate the contributions of different modes assuming the interactions between atoms were harmonic [16, 17]. In this sense, it is important to note that they did consider anharmonicity to the extent that it is required for a temperature gradient to develop, corresponding to finite thermal conductivity. However, beyond this assumption, their mathematical treatment of the atomic interactions was purely harmonic.
Their model exhibited better agreement with experimental data than previous work and as a result they concluded that anharmonicity was not likely to be important. Michalski [19], on the other hand, argued that anharmonicity is important and a more recent study showed that the A–F method exhibits less agreement with experiments for amorphous materials other than a-Si [20]. This leads one to question if anharmonicity is the critical feature that has been missing from previous models. It should also be emphasized here that correspondence with experimental data for thermal conductivity is the ultimate test for a model, and to date a model that exhibits excellent quantitative and qualitative agreement across multiple amorphous materials has yet to emerge. Recently He et al [21] and Larkin et al [22] used normal mode analysis (NMA) to include anharmonic effects on the contributions of propagons to the thermal conductivity of a-Si. By estimating the phonon velocity using several approximations they calculated the propagon contributions, and their results improved the agreement with experimental data. However, because propagons only account for ∼3% of the total number of modes, their contributions to thermal conductivity remain controversial [18], even though their contributions may be large on a per mode basis. Despite these concerns, to date, the A–F model has offered one of the best explanations for the thermal conductivity of a-Si [16, 17].
Towards the goal of incorporating temperature dependent anharmonicity, MD simulations offer an ideal platform for analyzing the interactions between atoms [23–26]. The critical challenge is to include modal analysis within the equilibrium MD (EMD) framework based on the Green–Kubo (GK) formula. Here, EMD is preferred for thermal conductivity calculations since for systems where periodic boundary conditions are applied, finite size effects only affect the phonon extent/wavelengths and not the distance over which they can transfer heat/MFPs [27]. Here, we present a formalism termed the Green–Kubo mode analysis (GKMA) method, which is a combination of the GK and NMA methods.
GKMA formalism
Consider an arbitrary collection of N atoms that collectively form a stable rigid body, whereby each atom vibrates around a stable equilibrium site. This group of atoms can have any internally inhomogeneous structure and/or composition and need not be periodic in any sense whatsoever. The only requirement is that the atoms vibrate about their equilibrium sites, e.g., they do not diffuse as they do in liquids or gasses and their equilibrium position does not change in time. This is the only major requirement, because if the equilibrium positions change, then the normal mode shapes will also change and thus the initial basis used for analyzing the vibrations would no longer be valid at later times.
For a system where all atoms vibrate about stable equilibrium positions, there will in general exist 3N collective modes of vibration that can be determined using the LD formalism [28] in the harmonic limit. The most general approach, which can be applied to both crystalline and non-crystalline materials is to perform the LD calculations on the entire supercell as if it were a single unit cell, such that wave-vectors are not used to distinguish the solutions. Instead one can imagine treating the entire supercell as a single unit cell evaluated at k = 0, yielding all 3N modes in a single calculation. With the 3N modes determined, one can then use the individual polarization vectors for each atom participating in a given mode as a basis for projecting the anharmonic trajectory. It is important to recognize that one can naturally include anharmonicity to full order in the dynamics by using molecular dynamics. Also, one can also incorporate the effects anharmonicity has on the mode character by recalculating modes via LD at different temperatures [29] or via static structures that correspond to the equilibrium structures at different temperatures. The primary effect anharmonicity has, nonetheless, is that it causes the individual mode amplitude to vary in time as the modes exchange energy amongst themselves and one can calculate an individual mode's relaxation time [30] from an EMD simulation using NMA [24], regardless of whether it is a propagon, diffuson or locon. However, without a clear definition for the phonon velocity, one cannot complete the calculation of thermal conductivity. Here, we utilize the same concept of projecting the MD trajectory onto the modes obtained from LD, but instead of using the mode amplitudes to calculate relaxation times, we conduct a direct modal decomposition of the heat current. Towards this end, we first examine the meaning of the reverse transformation from normal mode coordinates back to individual atom coordinates, where the normal mode amplitudes are calculated from

and

where the displacement and velocity of each atom x and  can be obtained from the normal mode coordinates via


In equations (1)–(4)  denotes the mode (e.g., the nth solution to the equations of motion), mj is the mass of the jth atom, and
  is the polarization vector which gives the magnitude and direction of motion for atom j in mode n. Equations (1)–(4) are not new and are well established within the context of the LD formalism [28].
The critical enabling insight offered herein is the physical meaning associated with equations (3) and (4). Here, equations (3) and (4) essentially state that at every instant, each atom's position and velocity is composed of their respective contributions from the different collective vibrations in the system. Thus, every atom's position and velocity are dictated by the respective magnitudes of each normal mode's amplitude  and its time derivative
  By thinking of each atom's position and velocity as being composed of an exact sum of modal contributions at every instant, we then postulate that if an individual mode's contribution to the displacement or velocity of an atom is used in an expression for the calculation of any other property that depends on that atom's position and/or velocity, one would subsequently obtain that mode's contribution to that property. For example, one could calculate each mode's contribution to the temperature of the system as discussed in the supplementary materials. Similarly, towards the calculation of thermal conductivity, the modal contributions to the velocity of each atom can be substituted into the heat flux operator derived by Hardy [31], to obtain each mode's contribution to the volume averaged heat flux at each time step in a EMD simulation

where  Ei is the sum of potential and kinetic energy of atom i, V is the volume of the supercell, Φj is the potential energy of atom j, and rij is the distance between atom i and atom j.
We can then take equation (5) and substitute it directly into the GK expression for thermal conductivity,  to obtain an equation that expresses the thermal conductivity as a direct summation over individual mode contributions

Furthermore, one can also substitute the summation of modal contributions to the heat flux in both places of the heat flux autocorrelation to obtain the thermal conductivity as a double summation over individual mode–mode heat flux cross-correlation functions,

Equations (6) and (7) are the primary results termed the GKMA method, which now allows us to obtain each mode's contribution to the total thermal conductivity, and we are guaranteed by equation (4) that the summation in equations (6) and (7) will exactly recover the total GK thermal conductivity. Also, equation (7) allows one to examine how the correlation between pairs of modes contributes to thermal conductivity.
One question that arises is whether the choice of decomposition using the velocities in equation (5) is correct or not. For the heat flux operator, velocity is an obvious choice because it is present in both terms, and thus it allows the heat flux to be cast as a single summation over modes. It is acknowledged, however, that other decomposition choices also exist. For example, one could decompose based on the difference in position  or the force term
  but these terms would only decompose the second summation. Although the second summation is well known to be most important for solids, it is not clear if decomposition based on the positions or forces will provide any different information from the velocities. Checking all possibilities is beyond the scope of the current investigation, but it is acknowledged that other possibilities might be correct, or combinations of different decompositions might even yield deeper insights, i.e., with regards to the details of the mode–mode interactions. Nonetheless, the ultimate test is whether or not a chosen method reproduces the results of well-established methods such as NMA for crystals where the PGM is well founded. Furthermore, additional comparisons against experiments over a wide range of cases would also aid in testing the hypothesis that using the velocity is the correct choice. Here, we have taken crystalline and amorphous silicon as a first example and continued testing of the GKMA formalism is warranted, similar to the many tests of first principles based approaches that have been applied to crystalline materials in recent years [2, 3, 6, 32, 33]. It should also be noted that even though the present study uses a simple empirical potential, the GKMA approach can still be evaluated from first principles if one were to use an accurate empirical potential, such as a Taylor expansion around the equilibrium positions [3].
The predominant viewpoint of phonon–phonon interactions is based on the PGM and is thought of in the context of scattering. However, in the GK formalism thermal conductivity arises from correlation [34], which is a fundamentally different way of viewing the physics. One would definitely expect that there is a strong connection between the two viewpoints, especially in the context of crystalline materials. However, it is important to appreciate that the GK representation of each mode's contribution to thermal conductivity through correlation is in and of itself complete and therefore provides a completely separate perspective. With this in mind, one can plot the magnitude of the individual terms in the double summation in equation (7) as elements of a 2D matrix, whereby the magnitude of the element represents the extent of correlation between modes. We postulate that a strong mode–mode correlation suggests the two modes somehow interact strongly, frequently or for long periods of time and possibly in collaboration with other modes.
Another useful feature of the GKMA method is that one can reduce the computational time associated with data output and post processing by combining any desired group of modes together to calculate the summed contribution of their combined heat flux at one time. This is because it mitigates the need to separately output and store or calculate the heat flux and correlations associated each individual mode. The details associated with such data reductions are discussed in the supplementary materials and are particularly useful for studying large structures.
Aside from these benefits the main power of the GKMA method (e.g., equations (6) and (7)) is that it now allows for calculation of the eigen mode contributions to thermal conductivity directly without the need to define phonon velocities. This is a critical issue for situations where the PGM becomes questionable, such as for disordered materials. With the GKMA method, however, it is now possible to calculate the thermal conductivity contributions of individual modes for any arbitrary collection of atoms, as long as they vibrate around stable equilibrium sites.
GKMA validation: crystalline silicon
The key question is whether or not the fundamental postulate the GKMA method is based on, is in fact correct. Specifically, is it true that the individual terms of the sum in equation (6) correspond to the actual modal contributions to thermal conductivity? To answer this question we compared this interpretation of the GKMA results with other well established methods for a crystalline material, namely silicon, since it has been studied extensively [2, 3, 7]. The molecular dynamics simulation details are given in the supplementary information and figure 1(a) shows the thermal conductivity accumulation for crystalline silicon (c-Si) using equation (6) via the Tersoff potential. The most important comparison is the correspondence it exhibits with respect to the accumulation computed from the NMA method using the same potential. The shapes of both the NMA and GKMA accumulations when using the same potential are almost identical and exhibit the same features. As indicated in figure 1(b), the thermal conductivity contributions from different branches using GKMA are also close to the NMA and first principles results. The main difference between the GKMA and NMA accumulations is the contribution from the transverse optical (TO) modes. In the PGM it is impossible for a mode to exhibit a negative contribution to thermal conductivity, and thus there exists no physical interpretation for negative thermal conductivity contributions from the PGM perspective. In the context of GKMA, however, there is nothing that requires the contributions of a given mode to be positive as it is possible for a mode's heat flow to remain correlated with the total heat flow, but be out of phase giving rise to a net negative contribution. Nonetheless, in practice the total thermal conductivity is always positive, as is required by the second law. It is interesting to note though, that for other methods, the TO mode contributions are effectively zero in the context of the PGM, while the GKMA approach ascribes a slightly negative value. Still, there is good correspondence between the NMA and GKMA accumulations and also the amount attributed to each polarization as shown in figure 1(b). This suggests that the fundamental postulate of the GKMA formalism and our interpretation of the results is correct since it yields very similar contributions as the NMA method. It is also worth noting that the accumulation results in figure 1 are in general agreement with previous work [7] using the environment dependent interatomic potential (EDIP) [35] as well as first principles calculations using density functional theory (DFT) and Fermi's Golden Rule [3]. Since both EDIP and Tersoff are a short ranged empirical potentials [36] the agreement between them is better than with DFT, which includes longer ranged interactions and is more accurate. It should also be noted that the values reported in figure 1 are normalized to unity by the total thermal conductivity predicted by each respective method and potential. It is both well-known and appreciated that the total values of thermal conductivity predicted by different potentials can vary greatly for crystalline materials. Nonetheless, it is useful to compare the results of different potentials on a normalized basis, so that one can assess whether or not the relative contributions of different modes are the same. Qualitatively, figure 1 shows that all four sets of results indicate the same relative contributions, despite the significant disparity in total thermal conductivity. This correspondence serves as additional evidence that equations (6) and (7) do in fact correspond to the thermal conductivity contributions associated with a given mode. It is also important to note that figure S1 in the supplementary materials shows the absolute thermal conductivity comparison between NMA and GKMA result and the total values from GKMA (130 W m−1 K−1) and NMA (120 W m−1 K−1) differ by less than 10% at 300 K. Furthermore, additional total thermal conductivity calculations are given in the supplementary materials for different potentials often used for studying silicon, such as the EDIP and the Stillinger–Weber potential.

Figure 1. (a) Thermal conductivity of c-Si accumulation vs. wavelength. (b) Comparison of each phonon polarization's contribution to the thermal conductivity of c-Si. The six polarizations are the transverse acoustic (TA), longitudinal acoustic (LA), transverse optical (TO) and longitudinal optical (LO).
Download figure:
Standard image High-resolution imageApplication of GKMA to amorphous silicon
Based on this initial validation, we applied the GKMA method to amorphous silicon (a-Si), which is a system that cannot be well described by previous methods. The inverse participation ratio (IPR) indicates the extent to which a mode is localized and does not involve all of the atoms in the system as a widespread collective vibration. Propagons and diffusons are delocalized and therefore have small IPR. Locons, on the other hand, are localized vibrations and therefore exhibit high IPR, which in figure 2(a) manifests at the higher frequencies. The density of states is also shown in figure 2(b) along with other published results [17, 20] serving as an indication that the potential provides a good description of the spectrum of vibrations in a-Si. We applied the GKMA to analyze the modal contributions to thermal conductivity in a-Si for all modes, where propagons, diffusons and locons are all treated the same way, via equation (7). The normalized thermal conductivity accumulation function of non-propagating modes (diffusons and locons) versus phonon frequency for a-Si is shown in figure 2(c). For comparison, the accumulation of non-propagating modes from the A–F method is also shown, which was calculated using the implementation in the General Utility Lattice Program (GULP) [37].

Figure 2. (a) Inverse participation ratio of modes in a-Si; (b) phonon density of states, black curve is from [17] and green curve is from [20]; (c) normalized thermal conductivity accumulation (from non-propagating modes (diffusons and locons)) versus mode frequency for a-Si at 300 K using GKMA and A–F theory at 300 K. The dotted gray lines are estimated cut-off between propagons and diffusons and between diffusons and locons.
Download figure:
Standard image High-resolution imageIn figure 2(c), the GKMA result, which includes anharmonicity, predicts a similar trend as the A–F result at room temperature for non-propagating modes, which does not incorporate the effects of anharmonicity on the mode–mode interactions. The A–F result here does not include the propagon contributions to thermal conductivity [22]. However in figure S2, when attempting to make the best comparison between experiments and different models, we also included the propagon contributions determined by Larkin and McGaughey [22] along with the A–F result (as labeled). At first this might seem to suggest that anharmonicity is not important. However, examination of the 2D cross-correlation terms (e.g., equation (7)) shown in figure 3, indicates that there is significant correlation between modes with different frequencies. In figure 3(a) the diagonal terms are the largest, but they only account for ∼70% of the total thermal conductivity at room temperature. Therefore cross-correlations, which arise due to anharmonicity, are responsible for approximately 30% of the thermal conductivity. What is also remarkable about the result in figure 3 is the fact that there is a distinct change in the magnitude of the correlations around 16 THz. This transition coincides with the transition to localized modes (e.g., locons—see figure 3). Here, it is important to note that no information regarding the nature of the modes (e.g., propagon, diffuson, or locon) was used to generate figure 3. Every mode in figure 3 was treated the same and no filtering was used to highlight the feature at 16 THz. Instead, a natural feature in the mode–mode correlations arises at the frequency where the mode character switches from spatially delocalized to localized. In figures 3(b) and (c) we have filtered out the auto-correlations (cross-correlations only) and cross-correlations (auto-correlations only) respectively to make the features more clear. Figure 3(c) shows that the locons do not have strong auto-correlations and the accumulation in figure 2 is consistent with previous assertions that locons exhibit a negligibly small contribution to thermal conductivity [16, 17]. One result of the A–F method is that the correlations between modes (e.g., interactions) should be most significant when the frequency of two modes is similar. However, using the GKMA approach, figure 3(b) suggests that modes with different frequencies can all interact, as there is no obvious increase as one approaches the diagonal. It is interesting to note, nonetheless, that despite these differences, both GKMA and the A–F model yield a similar normalized accumulation plot (see figure 2(c)), even though the total value at 300 K predicted by A–F (1.1 W m−1 K−1) is ∼30% lower than GKMA result. The same mapping of mode–mode correlations for c-Si is presented in figure S5 in the supplementary materials for comparison.

Figure 3. (a) Thermal conductivity (TC) contributions from mode–mode correlations of amorphous silicon; (b) TC contributions from just mode–mode cross-correlations of amorphous silicon; (c) TC contributions from only mode–mode auto-correlations of amorphous silicon.
Download figure:
Standard image High-resolution imageIn comparing the magnitudes of thermal conductivity values produced by GKMA and the A–F method, the A–F result underestimated the total thermal conductivity of amorphous silicon by 30% at 300 K. Here the most relevant experimental result is taken to be the measurements of Cahill et al [38], because it included the minimum hydrogen concentration (1%) and the hydrogen concentration in the simulations is 0%. It is acknowledged that there is a wide spread in the measured thermal conductivities for a-Si [38], but the differences must somehow relate to the underlying structure and composition of the actual samples used. Conceptually, if the atomic level composition and structure were accurately known, one could simply construct supercells that exactly match the experimental structures. If this were possible, the resulting thermal conductivities should match if the theory is correct, and even more importantly the GKMA approach would be able to provide insight on why the thermal conductivity becomes so high in certain cases [38] by elucidating which modes are responsible for the difference.
Since the GKMA method allows us to determine the thermal conductivity accumulation with respect to phonon frequency, we can apply a quantum correction to the classical MD GKMA results at different temperatures and compare to the experimental data [38, 39] at all temperatures. The underlying assumption in doing so is that, only the quantum effect on the specific heat must be accounted for in this case. Turney and McGaughey [40] have clearly shown that for crystalline materials quantum corrections are ill-founded because there are two quantum effects, one on the heat capacity, but also a second one on the scattering rate due to incorrect mode–mode occupations. This second effect is both important and intuitive, as one could envision that in the limit that only a single mode is excited in the system, the time it takes for it to couple to other modes and relax towards equipartition is a strong function of the amplitudes of other modes. Thus, when other modes are simultaneously excited it affects the rate at which mode–mode interactions occur. Turney and McGaughey [40] have clearly shown that for crystalline materials this effect is crucial, and because classical MD trajectories do not yield the correct quantum mode amplitudes observed at low temperatures, MD incorrectly predicts higher scattering rates. However, even though this issue is critical for bulk homogenous crystalline materials, one could envision other situations where another scattering mechanism dominates the phonon relaxation times, such as boundary [41], impurity [42] or structural scattering [13]. In such situations, where the phonon–phonon scattering processes (e.g., Umklapp-scattering) are not the primary mechanism governing the low frequency mode thermal conductivity contributions, one would imagine that the error associated with incorrect mode–mode occupations at low temperatures could become negligible.
For example, consider using MD to calculate the temperature dependent thermal conductivity of a silicon nanowire [43–45], where the majority of the low frequency phonon contributions are limited by scattering with the boundaries. In such a situation the net relaxation time for most modes is dictated by the nanowire dimensions and not the detailed mode–mode interactions, which require the mode occupations to be correct. This is especially the case for the low frequency modes which are the only modes that remain excited at low temperatures. As a result, in such a situation, one would imagine that application of a quantum heat capacity correction would subsequently lead to good agreement with experimental data. Furthermore, in such a situation, one would expect to achieve good agreement with experimental data, even with interatomic potentials that poorly describe the bulk behavior, such as the Tersoff potential [36]. To illustrate this principle at play in the systems of interest here, we calculated the thermal conductivity of c-Si and a-Si using three different potentials as shown in figures S3 and S4 in the supplementary materials. These calculations confirm our assertion that even though different potentials may give substantial differences in thermal conductivity for crystals they yield very similar values for the amorphous materials. It is argued here, that the situation for amorphous materials is likely the same as the nanowire case. The idea is that another more dominant scattering mechanism than pure anharmonic phonon–phonon scattering, namely structural scattering [13], may dominate the low frequency contributions in amorphous materials, thereby justifying the usage of a quantum correction on the heat capacity alone.
Here it should be emphasized that, fundamentally, anharmonicity is a prerequisite for impurity, defect or boundary scattering, because when such a scattering event occurs, the energy is still shared exclusively amongst phonons. As a result, even in the purely harmonic limit, boundary, defect or impurity scattering alone does not yield finite thermal conductivity. This is because some degree of anharmonicity is always needed in order to establish a temperature gradient and observe finite thermal conductivity in the first place. Some degree of anharmonicity is always assumed when one studies thermal conductivity, even if it is formally neglected beyond the basic assumption that it establishes finite thermal conductivity, as was noted in the original paper by A–F [46]. However, even though some degree of anharmonicity is a prerequisite for any scattering by structural features such as defects, boundaries or surfaces, the structural aberration itself is the root cause of the associated mechanism for thermal resistance. Consequently, it is quite possible that a potential's ability to describe anharmonicity accurately may be much less important in amorphous materials as compared to crystalline materials. Thus, one would expect that even a model such as the Tersoff potential, which has been noted to poorly describe the thermal conductivity of c-Si [47], could be sufficient for describing the behavior in a-Si. Here, we test this assumption by applying a quantum correction to the GKMA results, which only imparts a correction to the specific heat component of each mode's thermal conductivity contribution via the ratio of the quantum to classical specific heat [48] (see equation (S5) in supplementary materials.)
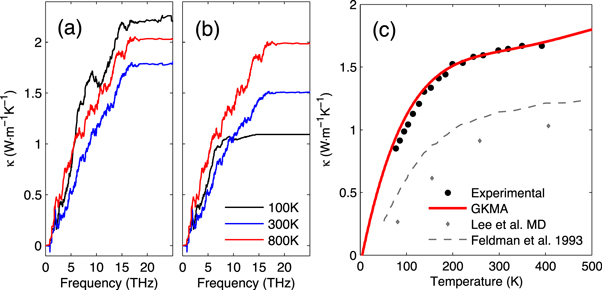
Figure 4(c) shows a comparison of the quantum corrected thermal conductivity using GKMA as compared to experiments, which shows best agreement of all models to date [16, 38, 49]. The GKMA results in figure 4(c) were generated by a linear interpolation of the normalized thermal conductivity accumulation functions at 100, 300, and 800 K (see supplementary materials for details). The un-normalized accumulations at each temperature are shown in figures 4(a) and (b), which indicate that a significant shift in the contributions occurs at lower temperatures. The fact that the non-quantum corrected MD result increases at lower temperatures shows that in order to obtain the correct temperature dependence, the frequency dependence must be obtained from GKMA first, so that the quantum correction can correctly scale each mode's contribution. At lower temperatures, the quantum correction nullifies the higher frequency contributions. However, it is still important to correctly calculate seemingly over predicted values with MD for the lower frequencies, which when quantum corrected, exhibit excellent agreement with the experimental data [38]. This serves as initial evidence that the thermal conductivity contributions from low frequency modes in disordered materials may be more so governed by scattering with the structure itself, as opposed to the pure anharmonic phonon–phonon scattering. Nonetheless, further testing of these hypotheses are warranted, using a variety of other materials to establish to what extent the approach used herein will in general yield accurate correspondence with experimental data.
Figure 4. Thermal conductivity accumulation of a-Si at 100, 300 and 800 K without (a) and with (a) quantum correction; (c) thermal conductivity versus temperature for a-Si comparing with experiments [38] and simulation results from other methods [16, 49].
Download figure:
Standard image High-resolution image
Conclusions
In this report we presented and tested a new method for calculating the modal contributions to thermal conductivity termed the GKMA method. With the exception of A–F, all previous models that incorporate both anharmonicity and modal analysis have been restricted to describing the thermal conductivity in terms of the PGM, which may only be valid for crystalline materials. However, with the GKMA method, one can calculate the modal contributions to thermal conductivity for any arbitrary collection of atoms, whereby the atoms vibrate around stable equilibrium sites leading to a stable set of normal modes. The GKMA method is therefore more general and can be applied to disordered solids (i.e., amorphous, alloys, non-stoichiometric compounds), as well as individual molecules that are rigid, but may not exhibit long-range periodicity. Herein, we validated the fundamental postulate that the GKMA method is based on, by calculating the thermal conductivity of crystalline silicon, which showed good agreement with the NMA method for the same potential. For disordered solids, the PGM is difficult to rationalize, because the phonon velocities are not well defined. However, since the GKMA method is based on linear response theory, it does not require definition of the phonon velocity to determine a mode's contribution and therefore is more general.
We applied the GKMA method to a-Si and even though the accumulations were similar to that of the A–F method, the mapping of the cross-correlation magnitudes indicated that modes with different frequencies do interact, which is a result of anharmonicity. To obtain deeper insight into the mode–mode interactions, we also calculated the magnitudes of the mode–mode cross-correlations. Interestingly, the transition between diffusons and locons was a naturally distinguishing feature within the correlation map. This further indicated that the mode taxonomy introduced by A–F, is not only useful, but is an excellent descriptor for the nature of the mode–mode interactions, as evidenced by the distinct differences for localized modes. Lastly, we showed the comparison with experimental data for the temperature dependent thermal conductivity and the GKMA results show excellent agreement. By applying the GKMA method to a disordered system, it is now possible to obtain a better understanding of modal contributions to thermal conductivity in systems where phonon velocities are not well defined and application of the PGM becomes questionable.
Acknowledgments
This research was supported Intel grant AGMT DTD 1-15-13 and computational resources were provided by the Partnership for an Advanced Computing Environment (PACE) at the Georgia Institute of Technology and National Science Foundation supported XSEDE resources (Stampede) under allocations DMR130105 and TG-PHY130049. We thank A McGaughey, J Larkin, and N Mousseau for useful discussions.