

Abstract
Nano-structure ferromagnetic-ferroelectric composite materials produced by the sol gel method have great attention in different applications due to their desired properties and applications. Potassium Barium titanate doped with different concentrations of Ni2+ nanoparticles (K0.1Ba0.9Ti(1−x)NixO3; x = 0.0–0.3) were prepared by sol-gel process. The final nanoparticles were obtained through drying and calcination at 200 °C and 600 °C, respectively. The crystalline, nanoparticles' nature and the optical characteristics of the Ni-KBTO nanoparticles are investigated using XRD, SEM, TEM, and optical properties. The XRD and TEM results demonstrate that the Ni2+ NPs were superlatively incorporated within the semi-crystalline KBTO structure. TGA thermogram of all samples shows two weight loss events. The first event is assigned for impurities and/or adsorbed water releasing. The second event was at a higher temperature and assigned as degradation of the nanoparticles. The thermal stability was enhanced by Ni2+ incorporation. The KBTO nanoparticles exhibit enhancement optical bandgap, which decreases from 3 eV to 2.3 eV with increasing Ni2+ in KBTO NPs. This can be ascribed to the change in nanoparticles arrangement and resembles band structures between Ti4+ and Ni2+, resulting in the efficient transfer of charge carriers. The dielectric constant was in the range 106 to 107 at low frequency and about 101 to 102 at high frequency. The Curie temperature of pure Potassium barium titanate is 373 K and 328 K for Potassium barium titanate doped with 20% of Ni2+.
Export citation and abstract BibTeX RIS
1. Introduction
One of the most motivating nanoparticles is the perovskite ferroelectric material. It has a considerable concern due to its wide range of applications, including capacitors, non-volatile memories, high storage devices, sensors, dynamic random access memories, actuators, transducers, etc [1].
Barium titanate, BaTiO3, (BTO) belongs to the most usable ferroelectric perovskite (ABO3) materials. Ferroelectric Barium titanate is identified by its tetragonal structure, high dielectric constant, the oxygen ions distribution on octahedron structure, unique dielectric properties, and high ferroelectric Curie temperature (393 K to 403 K), and huge dielectric constant[2–4].
Ferroelectric BaTiO3 has a traditional perovskite structure ABO3 in which Ba ions occupy the A sites while Ti ions occupy the B sites. It undergoes a phase transition at Curie temperature, where it transformed from the non-centrosymmetric (tetragonal phase) to centrosymmetric (cubic phase) at the transition temperature. The ferroelectric properties of BaTiO3 can be functionally controlled through doping with several elements [3, 5, 6].
Recent, the main studies have been concentrated on the effect of the transition elements and alkali elements doping on the phase transition in the perovskite BaTiO3 and their effects on the different properties of BaTiO3[7]. The insertion of some transition elements and alkali elements into the BTO formation leads to the change in the internal structure, electrical and optical properties [8, 9].
More significantly, perovskites exhibit excellent optical and electrical properties due to the electron hopping between different valence states of metals in the O-sites and can provide necessary active surface centers suited for various applications [10, 11].
It was found that introducing Ca2+ into the BaTiO3 structure instead of Ba2+ results in a shift of the transition temperature (Curie temperature) to the low temperature side and the dielectric constant is affected by this doping [4, 12]. Sindhu & Muraleedharan prove that K+reinforces the thermal persistence of BaTiO3 [13]. While Prasatkhetragarn et al 2013 refer to K+ doped BiFeO3–BaTiO3 increase the grain size and enhance the ferroelectric and the ferromagnetic [14].
Transition elements such as Mn2+, Fe3+, Co2+, and Ni2+ have a great interest in transforming the nonmagnetic BaTiO3 to a magnetic BaTiO3. Also, these elements have a great effect on the crystal structure of BaTiO3, where these ions are less charge from Ti4+ and thus act as acceptors and increase the oxygen vacancies concentration on the perovskite structure BaTiO3 [15]. Furthermore, these transition elements induce the hexagonal structure formation h-BaTiO3 rather than the tetragonal structure of perovskite BaTiO3 due to the excess of the oxygen vacancies concentrations [7, 16].
Magnetic nanoparticle is one of the most attractive nanoparticles due to its wide extent of enforcement; it can be used in healthcare, storage, retrieve data, industrial applications.....etc Magnetic materials can be identified by their response to magnetic fields. They are classified into five main groups; ferromagnetic, ferrimagnetic, antiferromagnetic, paramagnetic, and diamagnetic [17].
Multiferroic nanoparticles result from the mixture of ferromagnetic and ferroelectric materials. These new materials acquire the ferromagnetic and ferroelectric properties from their component. These new materials display coupling between electric and magnetic properties. They become magnetized when located in electric field stress and get polarized when spotted in the magnetic field. Recently multiferroic nanoparticles have various industrial potential applications, such as switches, transformers, transducers, magnetic field sensors, actuator memory devices, etc [18].
Inorganic BaTiO3, as an n-type perovskite with an optical bandgap of (3.2eV), has gained great attention because of its dielectric, catalytic and ferroelectric responses [19].
Thus, it can be assumed that the preparation of KBTO and KBTO doped with Ni2+ nanoparticles at a lower temperature, with a fine particles size, high surface area, low bandgap, and enhanced dielectric properties, would be beneficial to improve their functionalization and sensitivity. It is expected that introduction of both K+ and Ni2+ within BaTiO3 has well-attuned overlapping band-structures and proposing the construction of high-performance BaTiO3 nanoparticles.
The present work focused on prepares multiferroic KBTO doped with Ni2+ nanoparticles using Sol-Gel reactions and calcination at 600 °C for 2h. Study the effect of doping concentration on the microstructural, morphological, thermal, optical, and dielectric properties.
2. Experimental
2.1. Samples preparation
Pure potassium barium titanate KBTO and KBTO doped with nickel (Ni2+) were prepared by a modified sol–gel method. The sol–gel method has the advantage that it is relatively simple, has easy stoichiometric composition control, and is low cost. Weighted amounts of the appropriate proportions of high purity barium acetate (Ba(CH3COO)2), titanium(IV) isopropoxide (Ti[OCH(CH3)2]4), Potassium nitrate (KNO3), and nickel nitrate (Ni(NO3)2·6H2O), as a source of Ba2+, Ti4+, K1+, and Ni2+ ions respectively, were used as the starting precursors. Acetic acid (HAc)–H2O mixture, acetyl acetone (AcAc, C5H8O2), and distilled water were adopted as solvents, respectively. For pure KBTO, barium acetate was dissolved in a mixture of acetic acid and water. Potassium nitrate was dissolved in water, while titanium (IV) isopropoxide was dissolved in acetyl acetone. The different solutions were mixed according to the stoichiometric ratio (K: Ba: Ti—0.1: 0.9: 1), the resultant solution was stirred for 1h and dried at 200 °C. While Ni-KBTO was prepared as pure KBTO except nickel nitrate was dissolved into the distilled water and was added to the mixture according to the stoichiometric ratio (K: Ba: Ti: Ni—0.1: 0.9: 1-x: x, respectively), table 1, then followed with stirring and drying.
Table 1. Chemical composition of samples.
| Sample | (KNO3) Mol % | (Ba(CH3COO)2) Mol % | (Ti[OCH(CH3)2]4) Mol % | (Ni(NO3)2·6H2O) Mol % |
|---|---|---|---|---|
| KBTO | 10 | 90 | 100 | — |
| 1Ni-KBTO | 10 | 90 | 90 | 10 |
| 2Ni-KBTO | 10 | 90 | 80 | 20 |
| 3Ni-KBTO | 10 | 90 | 70 | 30 |
The dried gel was milled and calcinated at 600 °C for 2 h after calcination the final powder was milled again to carry out the different characterization.
2.2. Characterization
The pure KBTO and KBTO doped with Ni2+ were characterized by the x-ray Diffraction (XRD), (XPERT x-ray) with Cu Kα radiation. The surface morphology was characterized using scanning electron microscopy, SEM (JEOL: JSM-7610FPlus). High-resolution transmission electron microscopy (HR-TEM) was carried out on a transmission electron microscope, TEM (FEI -Tecnai T20). The effect of Ni2+ on the thermal decomposition of KBTO was surveyed through the thermogravimetric analysis (TGA).The experiments were directed under a flowing atmosphere of the nitrogen at a purge rate of (50 ml min−1). The weight for each sample was between 5–10 mg and was heated from room temperature to 700 °C preserving a programmed heating rate of (10 °C min−1).
The effective tool for evaluating the bandgap of nanoparticles samples by UV–Vis diffuse reflectance spectroscopy (DR unit; JASCO V550) and the optical band gap of semiconductors can be assessed using the Tauc Plot method.
Dielectric measurements were performed using LCR METER IM3536 with a frequency range from 4Hz to 8MHz. The powders were pressed in a special die (10 mm diameter) to form tablets with a thickness of nearly 1.2 mm. Dielectric measurements were carried in the frequency range from 4 Hz to 8 MHz and in the temperature range from 25 °C to 260 °C.
The relative permittivity of materials is given from the equation:

The dielectric constant calculated from the relation:

Where A is the area of the upper electrode, d is the thickness of the sample, ν is the frequency in Hertz, and εo is the permittivity of the free space (8.854 × 10⁻¹² F m−1). While, the loss tangent (tan (δ)) is given by

The AC conductivity calculated from the relation:

Where ε'' is dielectric loss of the sample and ω = 2πν.
3. Results and discussion
3.1. Semi-crystalline phase (XRD)
Figure 1 presents the XRD patterns of potassium barium titanate doped with Ni2+. The XRD pattern shows a hump that indicates the presence of an amorphous phase structure. The amorphous structure appeared due to the low calcinating temperature and it confirms the presence of carbon atoms and water molecules in the structure[20].

Figure 1. XRD patterns of KBTO, 1Ni-KBTO, 2Ni-KBTO, and 3Ni-KBTO nanoparticles calcinated at 600 °C.
Download figure:
Standard image High-resolution imageXRD spectra indicate that explicit chemical reactions and coexistent are detected between BaO, TiO2, K2O, and NiO2 during the sol-gel proceedings for KBTO and Ni-KBTO nanoparticles. The formation of decrepitating diffraction intensity peaks after the calcination process at 600 °C is a directory of the uncompleted long range order in the internal structure of these nanoparticles [21, 22]. These peaks were indexed to tetragonal BaTiO3 and Monoclinic BaTi2O5.
3.2. Surface morphology (SEM)
As obviously seen in SEM images of KBTO (figures 2(a) and 3 Ni2+ co-doped KBTO (figure 2(b)), after the calcinating process at 600 °C, the surface exhibited a highly connected, aggregates nanoparticles, and dense structure with various particle nanosized shapes of KBTO and 3 Ni-KBTO linkages into the surface. From figure 2 seems the densification process of KBTO and 3 Ni-KBTO nanocomposites might be influenced by the initial composition and the high activity of the substitution of K1+ and Ni2+ within the BTO framework [23].

Figure 2. Typical SEM images of KBTO (a), (c) and 3 Ni2+co-doped KBTO (b), (d) nanoparticles calcined at 600 °C for 2 h, at various magnifications.
Download figure:
Standard image High-resolution imageBoth surface structures and grains nano-size of the prepared nanocomposites are containing nano-spheres and nano-rods shapes, as shown in the SEM images (figures 2(c), (d)). Doping with Ni2+ ions brought distinct variation in the smoothness of surface morphology of KBTO. The higher magnification of SEM images shows that the KBTO (figures 2(c) and 3) Ni-KBTO (figure 2(d)) nanocomposites were composed of nano-crystals with 20–45 nm and 80–120 nm in length for rod shape.
3.3. TEM study
TEM images of KBTO and doped with 3 Ni2+nano-powders calcined at 600 °C, are given in figure 3. Figure 3 appears that the KBTO and 3Ni-KBTO nanopowders consist of nano-crystallites with various diameters, and the presence of aggregated particles. This result confirms the broad and irregularity XRD peaks of KBTO and 3Ni-KBTO nanopowders (figure 1). These mostly KBTO nano-crystallites aggregate in large particles and Ni2+doped samples form fine nanoparticles. The observed lattice fringes for KBTO and 3 Ni-KBTO samples using the HR-TEM give a well nanocrystalline structure (figures 3(c), (d)). Also, the observation for figures 3(c), (d) had been exhibiting the lattice planes of KBTO with interplanar distance 0.353 nm, and 0.470 nm for 3 Ni-KBTO nanostructures, which confirm the semi-crystalline nature of these nanostructures. It can be observed a difference in the interplanar distance between the KBTO and doped sample, indicates the lower crystallinity (relative amorphous structure, more lattice distortions) in the local structure for the 3Ni-KBTO.

Figure 3. HR-TEM Images (a) KBTO, (b) 3 Ni-KBTO nanostructures, and (c, d) their lattice fringes images.
Download figure:
Standard image High-resolution image3.4. Thermogravimetry analysis (TGA)
Thermogravimetry is described as a technique where the mass of the material is continuously verified as it is cooled or heated at a constant rate in an appropriate environment[24]. The widest application of thermogravimetric analysis including determining purity and thermal stability of both primary and secondary standards, determination of the composition of alloys and mixtures, and the direct application to analytical problems [24]. Thermogravimetry is regularly used for determining the drying ranges of precipitates. However, the dynamic nature of the technique must be considered when interpreting the best drying temperature. TGA studies may be done isothermally or non-isothermally[25]. If the heating rate is taken as zero then the technique becomes isothermal. This would mean that temperature is kept constant and mass variations are verified as a function in the time. When the heating rate is not equal to zero the technique is non-isothermal, mass changes are verified as a function of temperature[24].
In the present work, thermogravimetric analysis (TGA) was performed on a TGA (LINSEIS STA PT1600, Germany).
Figure 4 shows the TGA results obtained for the Ni-KBTO powders. The TG curves show a total weight loss of the powders till 700 °C of approximately 30, 28, 21, and 14% for 0, 1, 2, and 3 Ni-KBTO samples, respectively. These results indicate the enhancement of thermal stability of the nanocomposites by NiO addition. The thermal events showed in the results are the impurities, crystallization water, or adsorbed water releasing (from heating start to about 496, 490, 482, and 392 °C) followed by degradation event, which has a sharp loss rate. The degradation plots revealed also that impurities such as H2O and other oxides remaining from the preparation were present in an amount of 21, 11, 9, and 2% for 0, 1, 2, and 3 Ni-KBTO samples, respectively. The results are in agreement with that detected by Maček Kržmanc et al [26].

Figure 4. TGA of KBTO, 1Ni-KBTO, 2Ni-KBTO, and 3Ni-KBTO nanoparticles.
Download figure:
Standard image High-resolution image3.5. Diffuse reflectance
3.5.1. Diffuse reflectance and bandgap estimation
One of the most significant optical modulation techniques is diffuse reflectance (DR) spectroscopy. The method is appealing because of its nondestructive nature, simplicity, and relatively crisp features detected at room temperature. It has recently been widely used in semiconductor quantum wells and bulk materials to explore critical point transitions, damage patterns, and subsurface inhomogeneities [27].
Diffuse reflectance was employed in studying the optical properties of KBTO nanoparticles in the wavelength range 200–2500 nm as shown in figure 5(a).The diffuse reflectance of all samples increases with wavelength increase till the saturation point, at about 795 nm. Then, it tacks a decreasing path till 2500 nm wavelength. There is a convergence in the DR values where the increase or decrease does not indicate a clear effect of the addition of nickel. Also, the percentage of nickel is small, and therefore its effect on the interference will be limited.

Figure 5. (a) UV–vis-DR spectra, (b) optical bandgap, (c) the relation between Eg and Ni content, (d) the relation between the refractive index and Ni content, and (e) the relation between dielectric constant and Ni content of KBTO, 1Ni-KBTO, 2Ni-KBTO, and 3Ni-KBTO nanoparticles.
Download figure:
Standard image High-resolution imageFrom the diffuse reflectance, the Kubelka-Munk ((R∞)) can be calculated from the next formula [28]:

where F(R∞) gives the Kubelka-Munk formula,R∞ is the diffuse reflectance ratio between sample and reference, C is constant, hυ photon energy, Eg gives optical band gap, and n is an index which takes the value ½ (direct allowed), 2 (indirect allowed), 3 (direct forbidden), and 3/2 (indirect forbidden) count on the style of the electronic transition affect the reflection. So, the type and the value of the bandgap can be determined from the Tauc plot defined as: [29]

Where C is the proportionality constant.
The bandgap type and value can be determined from the Tauc plot by extrapolating the linear part to zero or from the first derivative of the absorbance regarding photon energy and uncovering the maxima at the lower energy in the derivative spectra. Figure 5(b) shows the plotting of (αhʋ)1/2 versus (hʋ) to obtain the type and the value of the gap transition. Indirect energy gap types are valid in current samples with values of 2.77, 2.49, 2.39, and 2.3eV for 0, 1, 2, and 3 KBTO, respectively.
It is noticed that with the increase of NiO content the indirect transition gap decreases as presented in figure 5(c). The optical band gap is influenced by the existence of localized electronic states in the specimen [30].
Lead-free (ABO3-type) perovskite materials based on BaTiO3 have achieved some interest where the ABO3-type perovskite materials with physical properties are controlled via A and B site cations and have an octahedral structure [31]. The valence and conduction band of ABO3-perovskite are collected of d orbital of the transition metal ions and the O-2p orbital. Also, their bandgap relates to the energy difference between their valence and conduction bands [31, 32].
Newly, many studies have proven that doping by transition metal ions in the B-site (such Ni2+, Fe3+, Zn2+, and Co2+) can powerfully decrease the band gap of perovskite materials, thus progress the absorption efficiency of light. It was found that the doping of BaTiO3 by Ni2+ ion leads to the decrease of bandgap [33].
This behavior was interpreted through the doping mediation mechanisms[31]. Many studies have verified that in BaTiO3, the conduction and valence bands are created throughO-2p orbital and Ti-3d orbital, respectively [34]. On the other hand, the conduction and valence bands are in NiO primarily generated from Ni-3d orbital and O-2p orbital, respectively [35]. The lowering the conduction band energy, the larger the electronegativity of ions, [34], electronegativity of Ti = 1.54, and Ni = 1.91 [34]. In K(1-x)BaTiO3-xNiO nanoparticles, as the electronegativity of the (Ni2+) ion is larger than that of the (Ti4+) ion, and the Ni-3d orbital is lower than Ti-3d orbital in energy, the energy band gap of doped KBaTiO3 materials forced into narrowing [31]. Also, the addition of Ni2+ was introduced at the B-site of KBaTiO3 as a substituting of Ti4+. As the two ions have a different radius, oxygen vacancy defects will be created and distort the formed lattice which in turn will alter the KBaTiO3 energy band [36]. The results indicate that the Eg of KBaTiO3 can be tuned by adjusting the doping level of NiO.
3.5.2. Refractive index and optical dielectric constant
The material refractive index is known to minimize with energy gap. Some of the relations that shows this relation are [37, 38]:
Moss relation:

Where n and Eg are respectively the refractive index and energy gap.
Vandamme relation:

Where A is the hydrogen ionization energy and B is a constant defines the difference among the UV resonance energy and bandgap energy.
Kumar and Singh relation:

Where K and C are constants.
The refractive indices of all the prepared samples were calculated by these three attempts.
Figure 5(d) shows the change of the refractive index with NiO content calculated by different attempts for indirect transition cases. It is obvious that there are small differences between n values calculated by different methods and this may be due to the difference in mathematical treating and different approximations methods used by every attempt. Also, the refractive index increases slightly with increasing NiO content as a result of bandgap energy decrease.
The material dielectric constant is linked to the refractive index [37] by:

The refractive index can be calculated from the above exponential relation and plotted in figure 5(e). It was noted that the dielectric constant change behavior with NiO content is similar to the behavior of the refractive index.
3.6. Dielectric Study;
Figure 6 displays the dispersion behavior of the dielectric constant (ε') at different temperatures, where the dielectric constant decreases monotonically with increasing frequency. According to figure 6, the dielectric constant attains a huge value, more than six orders, at the low-frequency zone, while it reaches the least value of 30 to 80 at the high frequency. This divergence in the dielectric value over the total frequency extent can be assigned to the different polarization mechanisms, which take place inside the samples under the effect of the external field, especially the interfacial polarization, electrode polarization, and orientational polarization[39–41]. At the low extent of frequency, the electrode polarization beside the interfacial polarization is the most dominant effect where the free charge carriers have sufficient time to transfer and agglomerate at the electrodes. The interfacial polarization takes place as a result of the agglomeration of the charge carriers around the interfacial barrier between the constituents of the polycrystalline composites samples this effect is known as a Maxwell-Wagner's model[42, 43]. The ferroelectric barium titanate co-doped with potassium and nickel ions calcinated at low temperature characterized by the presence of multi phases with a higher concentration of oxygen vacancies, these oxygen vacancies are released from the replacement of the tetravalent ions (Ti4+) by divalent (Ni2+) ions. Such constituents increase the effect of the electrode polarization and the interfacial polarization, thus increase the total dielectric constant. At low frequency, these constituents increase the direct conductivity contribution in the dielectric constant value. At the elevated frequencies, the dielectric constant (ε') decreases due to the disappearance of the different polarization mechanisms effect [44, 45]. This effect is released due to the effective dipole moment at low frequency can't catch up with the polarity variation of the applied field at high frequency [46]. According to figure 6, the dielectric constant shows temperature dependence. The temperature dependence of the dielectric constant at different frequencies is represented in figure 7.

Figure 6. The dielectric constant of potassium barium titanate doped with Ni2+ versus frequency at different temperature.
Download figure:
Standard image High-resolution image
Figure 7. The dielectric constant of potassium barium titanate doped with Ni2+ versus temperature at frequency 500 Hz, 1 kHz, 50 kHz, and 100 kHz.
Download figure:
Standard image High-resolution imageThe dielectric constant at different frequency increases as the temperature increase up to a certain temperature then decreases with further increase in temperature. This temperature is known as a Curie temperature (Tc), it represents a transition temperature where the materials are transferred from the poled state to the un-poled state. Above this temperature the ferroelectric material obeys the Curie Weiss Law;

Where TC is the transition temperature (Curie temperature) and C is the Curie constant. Figure 7 refers to the Curie temperature decreases as introducing Ni ions into the Potassium Barium titanate structure. This behavior can be assigned to the electronegativity of Ni2+ is higher than the electronegativity of Ti4+ and so the bond length (Ni-O) is less than the bond length(Ti-O) results in a decrease in the dipolemoment arm (distance between positive and negative charge). Thus, the polarity of nickel doped potassium barium titanate is less than the polarity of potassium barium titanate [4, 47]. The Curie constant obtained from the curve (1/ε'vs T) in the temperature range higher than the Curie temperature, Figure 8. The Curie constant are listed in table 2.
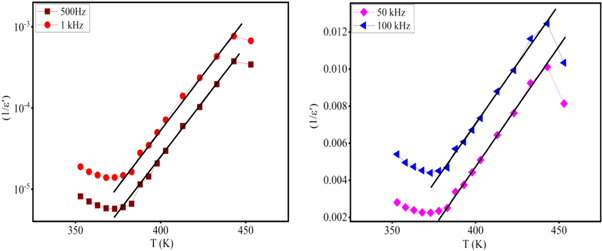
Figure 8. (1/ε'versus T) for KBTO sample.
Download figure:
Standard image High-resolution imageTable 2. The Curie constant at different frequency for KBTO, 2Ni-KBTO, 3Ni-BTO.
| Frequency | Curie constant (C) | ||
|---|---|---|---|
| KBTO | 2Ni-KBTO | 3Ni-KBTO | |
| 500 Hz | 1.08 × 10⁵ | 3.5 × 10³ | 5.7 × 10³ |
| 1 kHz | 7.72 × 10⁴ | 2.7 × 10³ | 3.7 × 10³ |
| 50 kHz | 7.47 × 10³ | 2.9 × 10³ | 1.18 × 10³ |
| 100 kHz | 7.76 × 10³ | 3.46 × 10³ | 1.27 × 10³ |
Figure 9 presents the frequency dependent of loss tangent (tan (δ) versus ν) at different temperatures. A loss peak is observed in the loss tangent curve in all samples. The frequency at the maximum value of the peak is defined as the peak frequency (νmax) and it is used to get the relaxation time (t = 1/2πνmax). Figure 9 shows that the peak is moved to a higher frequency as the temperature increases to the Curie temperature and then moved to a low frequency with a further increase. This behavior proves that samples are thermally activated below the Curie temperature.

Figure 9. The loss tangent (tan (δ)) of potassium barium titanate doped with Ni2+ versus frequency at different temperature.
Download figure:
Standard image High-resolution imageFigure 10 shows the experimental conductivity at several temperatures, it shows two distinct areas. The first area represents DC conductivity where it shows a steady behavior over the low frequency area. While at the second area the conductivity increases with raising frequency it represents AC conductivity. The temperature dependence of the conductivity shows that the conductivity increases with increasing temperature below the Curie temperature and after this transition temperature the conductivity decreases with increasing temperature. This behavior proves that the ferroelectric samples are thermally activated below the transition temperature and after this temperature, the ferroelectric samples behave like metallic materials.

Figure 10. The AC conductivity σ(ν) of potassium barium titanate doped with Ni2+ versus frequency at different temperature.
Download figure:
Standard image High-resolution image
4. Conclusions
Semi-crystalline potassium barium titanate doped with Ni2+ nanoparticles was prepared by an operatively sol-gel and calcinated at 600 °C.SEM and TEM images for KBTO and 3Ni-KBTO nanoparticles proved the semi crystalline nature and hetero structures. The thermal weight loss test done by TGA showed impurities and/or adsorbed water releasing at about 496, 490, 482, and 392 °C. The second event (degradation event) displayed a sharp weight loss rate and was detected at about over 600 °C for all samples. Ni2+ co-doping of KBTO nanostructures leads to the decrease of bandgap, which confirms the conduction and valence bands are affected by the environmental KBTO structure. The ferroelectric potassium barium titanate doped nickel ions calcinated at low temperature characterized by the presence of multi phases with a higher concentration of oxygen vacancies, which released from the replacement of the tetravalent ions (Ti4+) by monovalent (K1+) and divalent (Ni2+) ions. The transition temperature (Curie temperature) decreases with the incorporation of Ni2+ into the structure of the potassium barium titanate. The conductivity of Ni2+ doped KBTO increases with increasing temperature below the transition temperature and decreases with further increase in temperature. This behavior proves that the samples are thermally activated below the transition temperature and show a metallic behavior after the transition temperature. The controlling of the sol-gel preparation and low-temperature calcination makes these semi-crystalline KBTO and doped Ni2+ easily candidates for various applications such as catalytic, opto-emitter, and dielectric susceptibilities.
Acknowledgments
The authors appreciate the National Research Centre, Egypt for supporting the current work.
Data availability statement
The data that support the findings of this study are available upon reasonable request from the authors.
Conflict of interest
The authors announce that they have no conflict of interest.
Author contribution statement
Amany Mohamed El Nahrawy: Conceived and designed the experiments; Analyzed and interpreted the data; Contributed reagents, materials, analysis tools, or data; Wrote the paper. A.M. Mansour & Ali B. Abou Hammad: Analyzed and interpreted the data; Contributed reagents, materials, analysis tools, or data; Wrote the paper.
Funding statement
This research was funded by National Research Centre, grant number E121005.
Consent to participate
Authors confirm their participation.
Consent for Publication
The authors confirm their acceptance for Publication.