
Abstract
Objective. Several ERP-based brain–computer interfaces (BCIs) that can be controlled even without eye movements (covert attention) have been recently proposed. However, when compared to similar systems based on overt attention, they displayed significantly lower accuracy. In the current interpretation, this is ascribed to the absence of the contribution of short-latency visual evoked potentials (VEPs) in the tasks performed in the covert attention modality. This study aims to investigate if this decrement (i) is fully explained by the lack of VEP contribution to the classification accuracy; (ii) correlates with lower temporal stability of the single-trial P300 potentials elicited in the covert attention modality. Approach. We evaluated the latency jitter of P300 evoked potentials in three BCI interfaces exploiting either overt or covert attention modalities in 20 healthy subjects. The effect of attention modality on the P300 jitter, and the relative contribution of VEPs and P300 jitter to the classification accuracy have been analyzed. Main results. The P300 jitter is higher when the BCI is controlled in covert attention. Classification accuracy negatively correlates with jitter. Even disregarding short-latency VEPs, overt-attention BCI yields better accuracy than covert. When the latency jitter is compensated offline, the difference between accuracies is not significant. Significance. The lower temporal stability of the P300 evoked potential generated during the tasks performed in covert attention modality should be regarded as the main contributing explanation of lower accuracy of covert-attention ERP-based BCIs.
Export citation and abstract BibTeX RIS
1. Introduction
Farwell and Donchin's P300 Speller [1] is among the most widely validated brain–computer interface (BCI) paradigms for communication applications. Brunner and colleagues [2] have recently shown that the P300 Speller recognition accuracy was significantly decreased if the subject was not allowed to gaze at the target stimulus. Several user interfaces designed to be used in covert attention modality (i.e. in the absence of eye movements) have been implemented and tested [3–5] with the overall result of a lower system performance in covert with respect to overt attention usage. The observed superiority in the system performances under overt usage modality was mainly ascribed to the contribution of visual evoked potential (VEP) components recorded at occipital and parieto-occipital sites [3, 4]. In this regard, it has been clearly demonstrated that short-latency VEPs represent relevant features for successful control of the P300 Speller interface [6, 7]. In fact, in the P300 Speller interface the stimuli are arranged in a way that the users can gaze at the target letter and wait for its intensification while the non-target letters are spatially distributed at the periphery of the visual field. Higher amplitudes of these VEP components are elicited by target as compared with non-target stimuli since only the former stimuli fall in the foveal part of the retina. Reducing the visual crowding, that is similarly as in the covert modality, would greatly affect the VEP component amplitude while leaving the P300 component amplitude almost unaffected due to its independence from whether the target is foveated or not [2]. More specifically, in the covert attention-based interfaces there is no spatial difference between target and non-target stimuli, thus there is no difference between VEP amplitude elicited by target and non-target stimuli.
Other factors might also be relevant in influencing the classification accuracy of P300-based BCI paradigms, such as the trial-by-trial stability of latencies of the potentials elicited by the visual stimulation [8]. Specifically, the P300 is a positive deflection of the EEG signal elicited in the process of decision-making [9]. The P300 latency and amplitude can be influenced by several internal and external factors such as exercise, fatigue [10], age and gender [11]. Greater latency variations were also observed when the attention is divided between two tasks [12]. This phenomenon, known as latency jitter, occurs when the lag between each target stimulus onset and the related potential peak is not constant for the different stimulus repetitions. Kutas and colleagues [13] showed that for a P300 potential elicited by means of an odd-ball paradigm, measures of the peak amplitude performed on the averaged potential are biased because of the inter-trial variability (i.e. the jitter) of the peak latency. In fact, the latency jitter would induce a decrease in P300 amplitude (peak height) and a lengthening of the P300 latency window (peak width) [14]. The inter-trial variability was ascribed to the stimulus evaluation time defined as the amount of time to perceive and categorize the relevant stimulus. A probabilistic method to estimate the P300 latency across trials and to realign the P300 potentials in order to obtain an unbiased peak amplitude was also proposed in [13].
In the context of ERP-based BCI paradigms, each stimulus is presented to the subject several times (e.g. ten times) and a signal average is performed (e.g. by means of the output scores of the classifier) before a classification decision is generated. Thompson and colleagues [8] demonstrated that the accuracy achieved with the P300 Speller was strongly correlated with the jitter in the P300 latency.
In this study we addressed the issue of whether the accuracy of BCIs used in covert attention modality (i) is fully explained by the lack of VEP contribution to the classification accuracy and/or (ii) is correlated with a lower stability of the P300 potential elicited in the covert attention with respect to the overt attention modality. We hypothesize that (i) the jitter would be significantly greater when a specific BCI is utilized relying on covert rather than overt visual attention; (ii) a negative correlation would exist between BCI performance and latency jitter in a wide combination of visual interfaces and attention modalities; (iii) compensating for the P300 latency jitter through an analysis of single trials would significantly improve the performance of a BCI classifier.
To test our hypotheses, we first evaluated the effect of presenting stimuli through a given visual interface (i.e. the GeoSpell) in either covert or overt modality. Secondly, we evaluated the influence of the P300 latency jitter on the performance of a BCI classifier, in a set of three different BCI visual interfaces, and tested whether the expected differences could be reduced by pre-processing single trials to compensate for the P300 latency jitter.
It is worth noting that, in its present formulation, the jitter-compensation algorithm used in this paper to interpret the timing of single-trial ERPs does not lend itself for use in an online BCI, as it assumes knowledge about the trial's label (i.e. target or non-target).
2. Materials and methods
2.1. Data collection
Subjects were requested to complete a spelling task using a BCI. For this purpose, visual stimuli containing 36 alphanumeric characters for the GeoSpell and the P300 Speller interface, and two characters for the Visual Oddball interface, were delivered in different arrangements, through three alternative visual interfaces. EEG potentials were acquired for offline analysis. The study protocols were approved by the local Ethics Committee and all subjects gave their informed consent.
2.1.1. Stimulation interfaces
P300 Speller. In the first interface ([1], figure 1(a)), cues are organized in a 6×6 matrix and each character is always visible on the screen and spatially separated from the others. By design, no fixation cue is provided, as the subject is expected to gaze at the target character. Stimulation consists in the intensification of whole lines (rows or columns) of six characters.
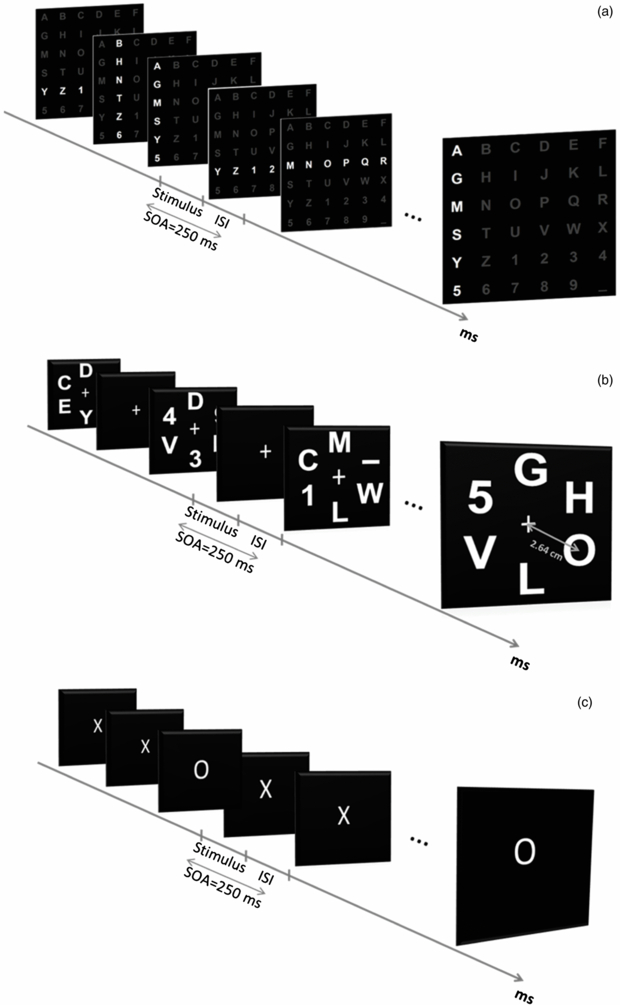
Figure 1. The three visual interfaces: (a) P300 Speller; (b) GeoSpell; (c) Visual Oddball.
Download figure:
Standard image High-resolution imageGeoSpell. In the second interface ([3], figure 1(b)) only six characters at a time are presented at the vertices of a hexagon, at the same angular distance (0.9°) from a central foveation point, marked by a fixation cross. Thus, in its intended operation, stimuli must be attended by the subject using covert attention only. New sets of 6 characters are presented in a sequence, until all 36 have been delivered twice after 12 intensifications; sequences are designed so that a given character is only presented at a specific vertex, which the subject had previously learned by practicing.
Oddball. A simple Visual Oddball paradigm interface (figure 1(c)) was also tested being a conventional paradigm to elicit P300 potentials. Only two characters ('O' and 'X') were successively presented at the same spatial location (corresponding to the foveation point), the former being the target 'rare' stimulus.
For all interfaces, the frequency of target stimuli was 16.7% (i.e. 1/6).
2.1.2. BCI settings
Scalp EEG signals were recorded (g.USBamp, gTec, Austria) from 8 Ag/AgCl electrodes (Fz, Cz, Pz, Oz, P3, P4, PO7 and PO8, referenced to the right earlobe and grounded to the left mastoid; electrode impedance not exceeding 10 kΩ) according to the 10–10 standard [15] at 256 samples per second. Visual stimulation and acquisition were operated by means of the BCI2000 software [16]. At the beginning of each trial the system suggested to the subject the character to be written before the stimulation started. No feedback regarding the classification results was provided to the subjects.
2.1.3. Experimental protocol
Recordings took place in four sessions (on separate days). In the first two sessions, the experimental task was carried out using the GeoSpell interface (see section 2.1.1) in the overt attention modality, i.e. the fixation cross was removed and subjects were allowed to gaze at the specific spatial location where the target character was designed to appear during the stimulation sequence, as described in experiment I. In the third and the fourth sessions, the experiment was carried out using the GeoSpell interface in the covert attention modality. In these two sessions, further measurements were performed, as described in experiment II.
Each session consisted of three runs for each interface and six trials (i.e. characters) per run. Subjects were required to spell six words (three words per session) chosen so that the spatial position of the target characters covered as much as possible all the positions on the screen, using either the GeoSpell and the P300 Speller interfaces; subjects were required to spell the sequence 'OOOOOO' (all 'rare' stimuli) using the Visual Oddball interface. This latter sequence was repeated for six runs. Each trial consisted of eight stimulation sequences and corresponded to the selection of a single character displayed on the interface. With the term stimulation sequence we refer to a single intensification of all the available items. In summary, for each subject and interface we collected a total of 576 target stimuli (2 sessions×3 runs×6 trials (i.e. characters)×8 stimulation sequences×2 target stimuli (e.g. in the P300 Speller 1 row and 1 column) and 2880 non-target stimuli (2 sessions×3 runs×6 trials×8 stimulation sequences×10 non-target stimuli (e.g. in the P300 Speller 5 rows and 5 columns)). Each character was intensified for 125 ms (stimulus duration), with an inter stimulus interval (ISI) of 125 ms, yielding a 250 ms stimulus onset asynchrony (SOA).
In the following we will refer to the GeoSpell interface used in covert and overt attention modality as Covert GeoSpell and Overt GeoSpell, respectively.
2.1.4. Experiment I
In experiment I, we preliminarily tested the effect of using the GeoSpell interface in either overt or covert attention modalities on the P300 latency jitter. The aim was to describe the effects of the attention modality on latency and jitter of P300 regardless of the stimulation interface, and provide the rationale for experiment II. Furthermore, a comparison with the P300 Speller and the Visual Oddball interfaces was performed. Six healthy subjects (three females and three males, mean age 31 ± 5 years) participated in the experiment.
2.1.5. Experiment II
Experiment II aimed to investigate the influence of the P300 latency jitter on the BCI spelling accuracy when each of the visual interfaces described in section 2.1.1 were used. According to their original design, the P300 Speller and the Oddball interfaces were used in overt attention modality whereas the GeoSpell was tested under the covert attention modality.
Twenty healthy volunteers (14 females and 6 males, mean age 28 ± 5 years) were involved in the study including those who participated in experiment I. All subjects had normal or corrected to normal vision. Each of them had previous experience with P300-based BCIs and with the interfaces used in this study.
2.2. EEG pre-processing
The EEG signals were segmented into 800 ms overlapping epochs following the onset of each stimulus.
Two runs of each recording session were considered as training set while the remaining run provided the data for the testing set, exploring all possible permutations. This procedure was applied in both the waveform and the performance analyses, which were based on an offline cross-validation (see below).
2.2.1. Waveform analysis
To evaluate the influence of the P300 latency jitter on the classification accuracy, it was necessary to reconstruct the P300 potential waveform for each single epoch. To this aim, we applied a method described in [17], based on the use of a wavelet transform to increase the signal to noise ratio (SNR) of the P300 potentials recorded during the experimental tasks. Figure 2 shows a schematic overview of the signal processing procedure applied to estimate the P300 latency jitter. We decomposed each single target epoch into its time–frequency representation by evaluating the continuous wavelet transform (CWT) for each channel, both for the training and testing runs. In the CWT we used a complex Morlet wavelet, with frequency content ranging from 1 to 20 Hz with a frequency resolution of 0.5 Hz and a time window of 800 ms. We computed the power spectrum (PWT) for each transformed single epoch of the training runs, defined as the squared magnitude of the CWT. Finally, we computed the average PWT over all epochs, to identify the wavelet coefficients with the highest power. Coefficients below a specified power threshold were filtered out, according to the following procedure: the empirical cumulative distribution function (CDF) of the power spectrum was calculated through the Kaplan–Meier estimation [18]; the filtering model consisted of a matrix (PMask) whose time–frequency elements were set to 1 when the CDF of the corresponding wavelet coefficient was greater than the threshold, and set to 0 otherwise. We computed the best threshold value referring to the original method used in [17], aiming to eliminate as much noise as possible while preserving the shape of the P300 potential. A filtered version of the target single epochs (training and testing sets) was finally obtained by evaluating the inverse CWT (ICWT) of the coefficient of each single epoch, multiplied for the PMask. When employed in a cross-validation, PMask was estimated from data belonging to the training set.
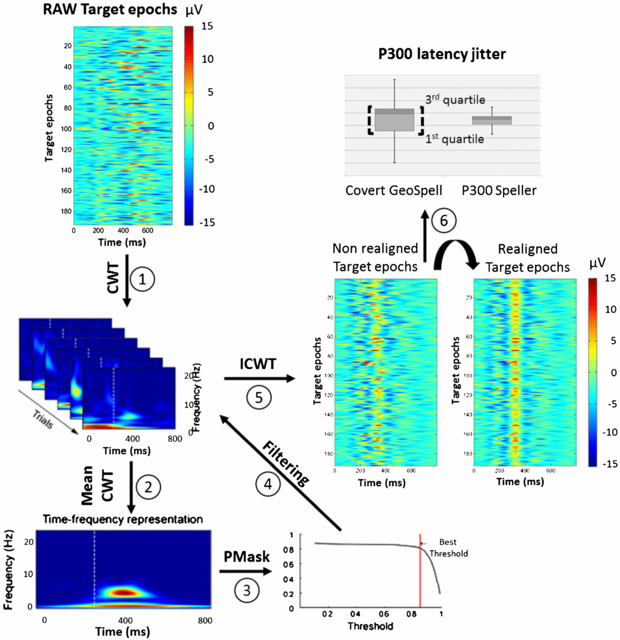
Figure 2. Overview of the waveform processing computation: step 1—computation of a time–frequency representation of the single target related epoch, based on the continuous wavelet transform (CWT) power spectra; step 2—average of the time–frequency power spectra; step 3—PMask computation starting from the cumulative distribution function (CDF) of the power spectra; step 4—application of the PMask and (step 5) calculation of the inverse CWT; step 6—evaluation of the P300 latency jitter as the difference between the third and the first quartile of the P300 latency distribution. In the reported example, the Cz electrode for a representative subject was computed.
Download figure:
Standard image High-resolution imageWe estimated the latency of the reconstructed single-trial P300 potential as the latency of the highest peak of the signal falling within a predefined interval (e.g. between 300 and 600 ms). The latter had been manually selected from the averaged waveforms, to embrace the whole P300 shape.
Once the epoch-by-epoch latency of the P300 potential had been estimated, the wavelet-filtered signals were discarded; all amplitude analyses were performed on the original signal (band-pass filtered between 0.1 and 20 Hz, eighth-order Butterworth filter).
For each visual interface, we compared the P300 responses evoked during the different BCI interfaces in terms of amplitude, latency and latency jitter. The P300 peak amplitude was measured both on the original average waveform (non-realigned amplitude) and on the waveform obtained by averaging the realigned single epochs (realigned amplitude), whose time course was shifted according to the estimated P300 latency values. We quantified the jitter of the P300 latency as the difference between the third and the first quartile of each distribution for each testing run. The waveform analyses were performed on the Cz channel, where the P300 is most prominent.
2.2.2. Performance analysis
For each participant, we assessed the BCI accuracies offline, as a function of the number of stimulation sequences averaged during each trial. We used a stepwise linear discriminant analysis (SWLDA, [19]) to select the most relevant features that allowed to discriminate between target and non-target stimuli. We performed a three-fold cross-validation exploring all possible combinations of training (two runs) and testing (one run) data set for each session and interface.
We evaluated the performance of the subjects for each interface in the following conditions.
- Whole epoch: the entire time length of the epoch (0–800 ms) is considered. This is the baseline condition against which we compared all others.
- Whole epoch decimated: same epoch length as above, reducing by a factor of 12 the number of time samples (each new sample is the average of 12 original samples). Downsampling is a commonly used procedure to prevent overfitting of the classifier by reducing the number of features [19, 20], and we considered this condition when referring to state-of-the art performance of a classifier.
- P300 epoch non-realigned: only the epoch segment containing the P300 potential is considered, thus disregarding those VEP components influenced by gazing at the target stimuli. The interval extent is subject- and interface-specific.
- P300 epoch realigned: same epoch length as above, using potentials obtained after realignment of the single epochs. In this condition, the effect of latency jitter is compensated.
2.2.3. Correlation between P300 latency jitter and performance
The information transfer rate (ITR, bit min−1) was calculated at each fold of cross-validation as a function of the number of sequences in the trial. The formula described in Pierce [21] was used to compute the number of bits transmitted per trial. The number of bits transmitted for each stimulation sequence is expressed as:
where N is the number of possible characters (in our case N = 36), i is the specific stimulation sequence, Pi is the probability that the target is accurately classified at the end of sequence i. From equation (1) the ITR at each stimulation sequence is determined as:

where Timei represents the time expressed in seconds for the ith stimulation sequence and M is the number of total stimuli (M = 12, e.g. six rows and six columns for the P300 Speller interface). From equation (2) we calculated the mean value of the ITR along the eight stimulation sequences, in order to have a synthetic measure of the system's performance (3):

To assess the correlation between the ITRMean and the P300 latency jitter, we estimated the non-parametric Spearman's rank correlation coefficient between these variables. For each subject and for each interface, we considered (i) the latency jitter and (ii) the ITRMean values calculated at each fold of cross-validation (two sessions times, three testing runs).
3. Results
3.1. Experiment I
3.1.1. Waveform analysis
We performed two one-way repeated measures ANOVA (confidence interval = 0.95) considering the interfaces (Overt GeoSpell, Covert GeoSpell, P300 Speller and Visual Oddball) as factors and P300 latency and latency jitter as dependent variables. A significantly influence of interfaces factor was found on both the P300 latencies and the P300 latency jitters (P300 latency: F(3, 140) = 56.18; p = 1.2 × 10⁻⁵, P300 latency jitter: F(3, 140) = 9.3; p = 10−5). A post-hoc analysis (Duncan test) revealed that the P300 latency mean values elicited by the Overt GeoSpell (470 ± 16 ms), Covert GeoSpell (476 ± 23 ms) and Visual Oddball (451 ± 65 ms) interfaces were significantly longer (p < 1.1 × 10⁻⁵) than the values obtained with the P300 Speller (360 ± 50 ms). The same analysis returned a significantly (p < 5 × 10⁻⁴) larger P300 latency jitter in the Covert GeoSpell (136 ± 33 ms) as compared with those observed with the Overt GeoSpell (111 ± 34 ms), the P300 Speller (98 ± 18 ms) and the Visual Oddball (110 ± 36 ms) interfaces. No significant differences (p > 0.05) were found between the Overt GeoSpell, the P300 Speller and the Visual Oddball interfaces in terms of latency jitter.
3.2. Experiment II
3.2.1. Waveform analysis
Figure 3 shows, for a representative subject, the average of the waveforms extracted from the testing runs and generated with and without realignment of the single-epoch P300 potentials elicited by the target stimuli delivered by each visual interface.
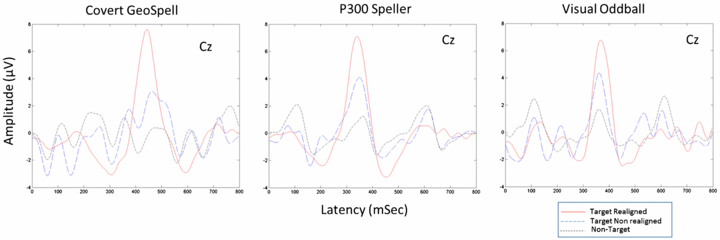
Figure 3. Averaged P300 potential waveforms at the Cz electrode position obtained from a representative subject using the three visual interfaces.
Download figure:
Standard image High-resolution imageSignificant differences of latency and amplitude of the P300 potential elicited by the three interfaces were explored by means of four one-way repeated measures ANOVAs (confidence interval = 0.95) where interface was considered as factor and Realigned P300 amplitude/not-realigned P300 amplitude/P300 latency/P300 latency jitter were the dependent variables. Also, a two-way repeated measures ANOVA (confidence interval = 0.95) was performed, where interface and P300 realignment (P300 realigned or not) were considered as factors, and the P300 amplitude was the dependent variable.
The analysis revealed a significant difference across the interfaces for latencies (F(2, 357) = 73.56; p = 1.1 × 10⁻⁵), the non-realigned amplitudes (F(2, 357) = 6.9; p = 1.1 × 10⁻³); and latency jitters (F(2, 357) = 52.58; p = 9 × 10⁻⁶).
Post-hoc analysis (Duncan test) showed that the P300 Speller elicited P300 waves with lower mean latency than the Covert GeoSpell and the Visual Oddball (353 ± 90, 434 ± 100 and 426 ± 113 ms, respectively; p < 10−4).
The Covert GeoSpell produced a latency jitter significantly larger than the P300 Speller and the Visual Oddball (mean values: 108 ± 24, 76 ± 24 and 74 ± 38 ms, respectively; p < 10−4).
The Covert GeoSpell elicited P300 waves with lower amplitudes than the P300 Speller and the Visual Oddball (mean values: 4.7 ± 2.0, 6.1 ± 3.6 and 5.4 ± 3.0 µV, respectively; p < 0.05).
No significant influence was found on the P300 Realigned amplitude (P300 Speller (9.52 ± 3.9 µV), Covert GeoSpell (9.58 ± 2.4 µV) and Visual Oddball (9.12 ± 3.8 µV)) variable (F(2, 357) = 0.13; p = 0.88).
Furthermore, the P300 amplitudes estimated after the realignment exhibited significantly higher values than those evaluated without the realignment, for all the interfaces (F(1, 714) = 380.93; p = 10−5).
Figure 4 illustrates, for an exemplary subject data set, the target epochs relative to each interface with and without realignment.

Figure 4. Target epochs relative to each interface with (dashed blue boxes) and without (red boxes) realignment. Only one exemplary subject data set over Cz electrode is shown.
Download figure:
Standard image High-resolution image3.2.2. Performance accuracy analysis
Differences in the classification accuracy achieved with each of the three visual interfaces and each of the four conditions introduced in section 2.2.2 (epochs). Figure 5 shows the accuracy for (a) each stimulation sequence and (b) averaged over all the stimulation sequences.
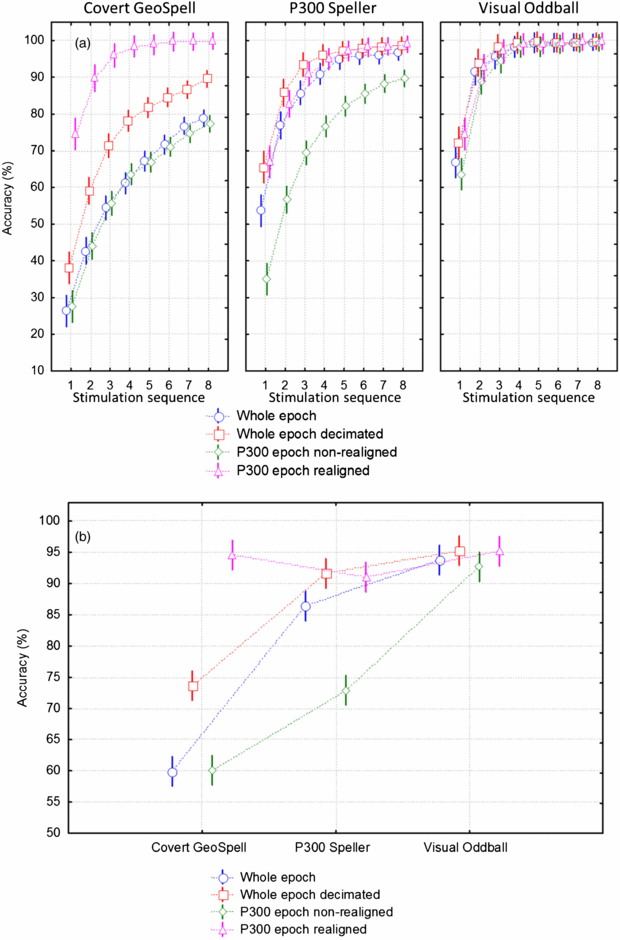
Figure 5. Mean and confidence intervals (CI = 0.95) of the cross-validation target classification accuracies achieved with the Covert GeoSpell, P300 Speller and Visual Oddball interface, relative to each epoch choice: (a) as a function of the number of stimulations; (b) averaged over all stimulations.
Download figure:
Standard image High-resolution imageA two-way repeated measures ANOVA (confidence interval = 0.95) was performed with interfaces and conditions as factors and the accuracy per stimulation sequences as dependent variables.
The analysis revealed a significant interaction between the factors (F(6, 1428) = 42.57; p = 10−9). The Duncan's multiple range test was used for post-hoc comparison. The differences in the epoch choices and the interfaces are summarized in figure 6 and described in detail in the remainder of this section.
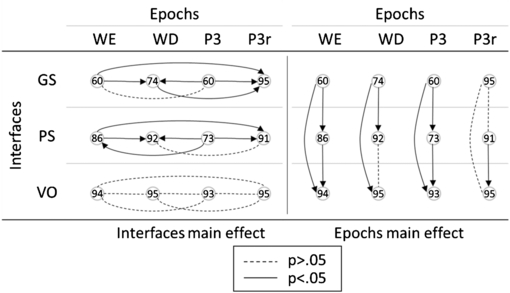
Figure 6. Graphical representation of the differences between the epochs (WE: whole epoch; WD: whole epoch decimated; P3: P300 epoch non-realigned; P3r: P300 epoch realigned) and the interfaces (GS: Covert GeoSpell; PS: P300 Speller; VO: Visual Oddball) in terms of accuracy, highlighted by the post-hoc test. Each solid line indicates a significant difference (p < 0.05) between the considered epochs or interfaces. Each arrow points to the factor with higher mean value. Dashed lines indicate non-significant (p > 0.05) differences between the epochs or interfaces. Numbers in the circles indicate the per cent mean accuracy value.
Download figure:
Standard image High-resolution imageIn the whole epoch and whole epoch decimated conditions, the accuracy of the GeoSpell differed significantly from each of the other two interfaces (p < 10−5). Instead, the Visual Oddball interface exhibited significantly higher accuracy than the P300 Speller only in the whole epoch condition (p < 10−3).
In the P300 epoch non-realigned condition, accuracy was higher for the P300 Speller and the Visual Oddball than the GeoSpell interface (p < 10−6). In addition, the accuracy of the Visual Oddball interface was significantly higher than the P300 Speller (p < 10−5).
In the P300 realigned condition, only the Visual Oddball interface differed significantly from the P300 Speller (p < 0.05).
Both for the GeoSpell and the P300 Speller interfaces, realignment of the P300 potentials (P300 realigned), yielded a significant increase (p < 10−2) of the accuracy with respect to the whole epoch condition. Moreover, the decimation of samples (whole epoch decimated) yields significantly higher accuracy than using the original (p < 10−5) samples (whole epoch condition) and the P300 epoch non-realigned condition (p < 10−4).
Only using the P300 Speller, accuracy in the whole epoch condition is significantly higher (p < 10−4) than in the P300 epoch non-realigned (p < 10−4).
Only for the Covert GeoSpell interface, accuracy in the whole epoch decimated is significantly lower than in the P300 epoch realigned condition (p < 10−5).
Only when the Covert GeoSpell and the P300 Speller interfaces were used, was significantly higher accuracy obtained in the P300 epoch realigned with respect to the P300 epoch non-realigned condition (p < 10−6).
3.2.3. Correlation between P300 latency jitter and classification accuracy
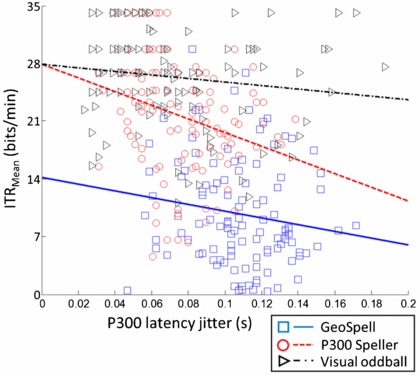
The non-parametric Spearman's rank correlation coefficient was used to evaluate the correlation between the classification accuracy as expressed by the ITRMean values and the P300 latency jitter obtained for each interface. We found a significant negative correlation between the latency jitter and the accuracy achieved by the subjects with all three interfaces (GeoSpell: r = 0.17 p = 0.04; P300 Speller: r = 0.35 p = 10−4; Visual Oddball: r = 0.18 p = 0.03).
Figure 7 shows the scatter plot and the related regression lines of the P300 latency jitter values and the ITRMean values for the Covert GeoSpell, the P300 Speller and the Visual Oddball interfaces.
Figure 7. Scatter plot and regression lines of the P300 latency jitter and the ITRMean values relative to Covert GeoSpell, P300 Speller and Visual Oddball interface.
Download figure:
Standard image High-resolution image
4. Discussion
The overall aim of this study was to investigate whether and to what extent the decrease of BCI accuracy using the covert attention-based GeoSpell interface can be explained by the two following phenomena: (i) the lack of contribution of short-latency VEPs (whose amplitude is mainly determined by foveation of the stimuli) in the tasks performed in covert attention modality; (ii) the lower temporal stability of the single-trial P300 potential when compared to corresponding potentials generated by interfaces based on overt attentive tasks, such as the P300 Speller and a Visual Oddball interface.
In line with previous studies [2, 4], our findings on the first phenomenon clearly indicate the significant contribution of the early VEP components to the classification accuracy only for the overt (i.e. P300 Speller) interface. Also, removing the VEP contribution from ERPs elicited using the P300 Speller and the GeoSpell interface, the latter still performed significantly worse than the former, suggesting that the lack of VEPs is not the only reason for the performance decrement in the tasks performed in covert attention modality.
To test the relevance of the second phenomenon, we preliminarily contrasted covert versus overt attentional tasks using a given visual interface (i.e. the GeoSpell). This first experiment proved that when the user operates a BCI using covert attention, the latency jitter is greater than using overt attention.
Capitalizing on this preliminary result, we evaluated the influence of the P300 latency jitter on the performance of a BCI classifier in a set of three different BCI visual interfaces, and tested whether the expected differences are reduced by pre-processing single trials to compensate for the P300 latency jitter.
As the main finding of this experiment, we found that for two out of three interfaces the reduced stability of the P300 potential evoked during the task is a significant contributor to the reduced accuracy.
4.1. ERPs and (c)overt attention
According to the waveform analysis, we found that the latency of the P300 evoked by the GeoSpell visual interface was significantly longer with respect to that elicited by the P300 Speller interface, regardless of the required attention modality (i.e. covert versus overt). In addition, an increase in the P300 latency also occurred when using the Visual Oddball interface as compared to the P300 Speller.
The finding of an influence of the stimulation interface on the P300 latency was somehow expected if one considers that in the case of the Overt and Covert GeoSpell and the Visual Oddball interfaces, the target and the non-target stimuli appear at the same spatial location of the screen. This implies that the subject cannot use the position of the stimulus as a feature to discriminate target types. Rather, discrimination must happen on the basis of the stimulus' shape only. On the other hand, in the P300 Speller the target and non-target stimuli are arranged in distinct positions in the matrix and the subject is allowed to foveate the target stimulus; in this case, discrimination is performed on the basis of a change of luminance occurring in the foveal region. Differences in latency can thus be plausibly ascribed to the timing of the categorization process, which would introduce longer delays with the GeoSpell and the Visual Oddball interfaces with respect to the P300 Speller.
The waveform analysis also revealed that the P300 latency jitter was significantly greater when using the Covert GeoSpell interface than using the Overt GeoSpell, the P300 Speller and the Visual Oddball interfaces. This result indicates that the attention modality does influence the magnitude of the jitter in the P300 latency. The latter may be partially ascribed to the dual task nature intrinsic to the covert attention modality [22], which would make the task highly demanding. In fact, using the Covert GeoSpell interface the users had to maintain gaze on the center of the screen (fixation cross) and simultaneously she/he had to pay attention to the surrounding stimuli. This interpretation is in line with previous evidence [12] of a larger deviation in the P300 latency values that occur when attention is divided between two tasks. Additionally, we note that the specific succession of the presented shapes (characters) can facilitate or delay recognition of the target, which plausibly makes categorization timing less deterministic.
In agreement with experiment I, the waveform analysis in experiment II confirmed with an enlarged group of subjects that the P300 elicited by the Covert GeoSpell and the Visual Oddball (categorization of shapes) display longer latencies with respect to those evoked by the P300 Speller (categorization of luminance). The latency jitter was significantly higher for the Covert GeoSpell (covert attention) than the other two interfaces (overt attention).
As for the amplitude of the P300, the Covert GeoSpell interface elicited P300 responses of significantly lower amplitude with respect to the P300 Speller and the Visual Oddball interfaces. After the introduction of the single-trial realignment procedure, the amplitude values of the P300 did not differ significantly (p > 0.05) between covert and overt interfaces. Also, the P300 amplitude estimated after realignment displayed significantly higher values than those calculated without realignment, regardless of the type of interface. In fact, as expected, a natural consequence of the jitter in the temporal onset of the P300 is a 'smearing out' of the grand average ERPs, resulting in a decrease in P300 amplitude and an increase in the width of the P300 [13, 23, 24].
4.2. BCI performances and latency jitter
The main hypothesis of this study predicts that the usage of a covert attention-based BCI visual interface such as the GeoSpell would lead to a greater jitter of the P300 latency, which in turn would negatively affect the classification accuracy.
In fact, we confirmed that short-latency VEPs, which are modulated by gazing at a flashing target, are a relevant feature when classifying ERPs acquired during an overt attention task: the accuracy of the P300 Speller deteriorates significantly (−19%) when only the P300 component is fed into the classifier. On the other hand, the accuracy attained by the P300 Speller is still significantly higher than the GeoSpell (+13%). Thus, we conclude that the modulation of early VEPs does not entirely account for the lower performance of BCI controlled in covert attention.
On the other hand, we showed that: (i) the attention modality significantly influences the amount of jitter in otherwise fixed experimental conditions (experiment I); (ii) accuracy negatively correlated with the P300 latency jitter for all interfaces (experiment II). In other words, covert attention increases the P300 latency jitter, and the greater the jitter the lower the accuracy of the classifier.
To further quantify to what extent the greater jitter accounts for the BCI loss of accuracy (as compared to other possible causes), we introduced an offline single-trial analysis which realigns the P300 peaks following each stimulus, thus compensating the latency jitter. Comparing the classifier's performance with such post-processing, we observed a significant increase of the averaged P300 amplitude, and a substantial increase of performance of the BCI classification for both the Covert GeoSpell and P300 Speller interfaces. More importantly, the average accuracy of the Covert GeoSpell using realigned epochs is almost identical to the best performance of the P300 Speller (94% versus 92%). Taken together, these results lead to confirm our working hypothesis—the larger latency jitter associated with the tasks performed in covert attention modality largely explains the reduced performance of BCIs designed to be operated in the absence of eye movements.
The improvement in performance produced by the realignment procedure may be simply explained by the consequent increase of the P300 peak's amplitude, even if for BCI classification purposes the averaging procedure is only carried out on a small number (5–20) of epochs, i.e. those acquired while a single character is selected. More effectively, the higher discriminability of P300 response may be directly accounted by the higher epoch-by-epoch stability of the feature vectors fed into the classifier; in fact this vector contains the values of the potential at a given latency, and the lower jitter implies more reproducible (less dispersed) features for the classifier.
It is worth noting that the realignment process requires information on the labels of epochs (i.e. target versus non-target). While it is a useful analysis method to interpret the timing of single-trial ERPs, in its present formulation it cannot be employed to improve performances of online BCIs.
5. Conclusions
We found that (i) even canceling the contribution of short-latency VEPs, the P300 Speller interface (used in overt attention modality) remains more accurate than the GeoSpell (used in covert attention); (ii) the P300 latency jitter is negatively correlated with the accuracy of the BCI classifier; (iii) compensation of the P300 latency jitter makes the GeoSpell (used in covert attention) equally or more accurate than the P300 Speller.
Taken together, these findings suggest that the absence of short-latency VEPs contribution in a paradigm based on covert attention does not completely account for the lower classification accuracy in comparison to the commonly adopted P300 Speller. Rather, the lower temporal stability of the P300 evoked potential generated during the covert attention task should also be regarded as a primary cause of the limited accuracy.
Acknowledgments
The work is partly supported by the EU grant FP7-287774 'ABC' (Augmented BNCI Communication) and NINA research project, co-financed by EUROCONTROL on behalf of the SESAR Joint Undertaking in the context of SESAR Work Package E. This paper only reflects the authors' views and funding agencies are not liable for any use that may be made of the information contained herein.