
Abstract
Objective. Assimilating the diagnosis complete spinal cord injury (SCI) takes time and is not easy, as patients know that there is no 'cure' at the present time. Brain–computer interfaces (BCIs) can facilitate daily living. However, inter-subject variability demands measurements with potential user groups and an understanding of how they differ to healthy users BCIs are more commonly tested with. Thus, a three-class motor imagery (MI) screening (left hand, right hand, feet) was performed with a group of 10 able-bodied and 16 complete spinal-cord-injured people (paraplegics, tetraplegics) with the objective of determining what differences were present between the user groups and how they would impact upon the ability of these user groups to interact with a BCI. Approach. Electrophysiological differences between patient groups and healthy users are measured in terms of sensorimotor rhythm deflections from baseline during MI, electroencephalogram microstate scalp maps and strengths of inter-channel phase synchronization. Additionally, using a common spatial pattern algorithm and a linear discriminant analysis classifier, the classification accuracy was calculated and compared between groups. Main results. It is seen that both patient groups (tetraplegic and paraplegic) have some significant differences in event-related desynchronization strengths, exhibit significant increases in synchronization and reach significantly lower accuracies (mean (M) = 66.1%) than the group of healthy subjects (M = 85.1%). Significance. The results demonstrate significant differences in electrophysiological correlates of motor control between healthy individuals and those individuals who stand to benefit most from BCI technology (individuals with SCI). They highlight the difficulty in directly translating results from healthy subjects to participants with SCI and the challenges that, therefore, arise in providing BCIs to such individuals.
Export citation and abstract BibTeX RIS
1. Introduction
Spinal cord injury (SCI) is considered to affect 330 000 people in the European Union with an additional 11 000 incidences each year. In the majority of cases, patients suffer from a functionally incomplete lesion of the spinal cord. Among others, locomotion training [1, 2], neuroprostheses such as the Freehand system [3] and functional electrical stimulation [4, 5] support the rehabilitation process and assist those people in activities of daily living.
In cases of complete high cervical lesions, an approach towards reducing disability focuses on driving devices, so-called brain–machine interfaces or brain–computer interfaces (BCIs), with signals derived from intra-cortical recordings [6, 7] or scalp recordings [8–10], respectively. SCI entails abnormalities in brain motor system function [11, 12] and could reduce the effectiveness of restorative interventions. Motor imagery (MI) training can improve motor behaviour and might achieve normalization of the brain motor system function by modulating it [13, 14].
Most electroencephalogram (EEG)-based MI BCI studies deal with healthy subjects. BCI training has only been performed with patients in some cases, e.g. individuals with amyotrophic lateral sclerosis [15–18], SCI [10], or individuals with cerebral palsy [19]. In these papers, training with patients is reported to be more complex and needs a lot of time. Often some months are needed before an acceptable classification accuracy is reached.
One general finding in all these studies is that the transfer of the methods developed mainly with healthy participants is not so simple as expected. Often, the reshaping of training paradigms is necessary.
Therefore, the main goal of this study is to investigate whether MI results in similar EEG patterns in both healthy subjects and SCI patients.
EEG patterns are analysed regarding different measures including the strength of activation patterns measured by event-related desynchronization (ERD), microstates and measures of functional connectivity. The ERD is a typical pattern of activation which can be observed at the sensorimotor cortex in relation to motor tasks such as motor execution or MI [20]. Microstates represent quasi-stable field topographies which are interrupted by stepwise changes of topography and are related to stepwise information processing in the brain [21]. Microstate occurrence frequency is known to be modulated by motor tasks in stroke patient [22] and healthy [23] populations, although little is known about how this may differ between groups of healthy subjects and individuals with SCI.
Functional connectivity in the brain refers to statistical dependences between different brain regions and is known to be modulated by a variety of processes [24]. Connectivity may be measured by a number of metrics such as correlation, coherence [25] or phase locking [26]. Phase locking has been observed to be modulated by MI [27] and has been proposed as an alternative measure for use in BCIs [28–30]. Furthermore, it provides a measure of inter-regional communication which may be modulated by SCI-induced plastic changes. Therefore, phase-locking measures are investigated in patient and healthy subject groups to determine the effect of SCI on cortical connectivity.
According to the aforementioned findings about altered brain motor system functions in SCI, we expect to find less pronounced and more diffuse patterns of sensorimotor rhythm activation in SCI patients. We also expect to see differences in the distribution of microstate topographies and strengths of functional connectivity between healthy subjects and patients. Finally, we expect that these differences in electrophysiological activation will lead to differences in single-trial BCI classifier accuracies.
2. Methods
2.1. Subjects and patients
The study population consisted of 10 healthy subjects (M = 28.1 years, SD = 10.3), 4 female and 6 male and 16 patients (M = 40,43 years, SD = 13.37), 4 female and 12 male. All patients suffered from a complete sensor and motor paralysis at ASIA level C5–T12 after a traumatic SCI between 1.6 months and 32.9 years prior to the measurements. Seven patients were tetraplegic, and nine patients were paraplegic. Information on the patients is summarized in table 1. The healthy volunteers were without any medical or psychological diseases, had normal or corrected to normal vision and got paid for attending the experiments.
Table 1. Patients' characteristics. DoB indicates the date of birth, DoI the date of injury, and DsI the duration since injury to the measurement.
| Patient | DoB (year) | DoI (year) | DsI (months) | ASIA level |
|---|---|---|---|---|
| 01 | 1987 | 2007 | 3.9 | C5 (Tetra) |
| 02 | 1981 | 2007 | 5.3 | C6 (Tetra) |
| 03 | 1957 | 1991 | 192 | Th12 (Para) |
| 04 | 1972 | 1989 | 226.5 | C6 (Tetra) |
| 05 | 1956 | 2007 | 2.5 | C5 (Tetra) |
| 06 | 1960 | 1982 | 38.9 | Th5 (Para) |
| 07 | 1959 | 1979 | 341.7 | Th11 (Para) |
| 08 | 1943 | 2007 | 11.9 | Th6 (Para) |
| 09 | 1949 | 1975 | 394.6 | Th8 (Para) |
| 10 | 1966 | 2007 | 5.5 | Th4 (Para) |
| 11 | 1992 | 2008 | 1.6 | Th12 (Para) |
| 12 | 1963 | 2005 | 33.2 | C7 (Tetra) |
| 13 | 1965 | 2007 | 6.8 | C6 (Tetra) |
| 14 | 1984 | 2006 | 22.1 | L1 (Para) |
| 15 | 1963 | 2005 | 37.9 | C5 (Tetra) |
| 16 | 1963 | 1995 | 167.2 | L1 (Para) |
2.2. EEG recording and experiments
All measurements were made according the Declaration of Helsinki, and approval from the local ethical committee was received. Patients: 15 sintered Ag/AgCl ring electrodes were mounted orthogonally in both horizontal and vertical directions over the motor cortex and positioned to allow Laplacian derivations to be taken of electrode positions C3, Cz and C4 (cf figure 1(A)). The inter-electrode distance was 2.5 cm. All electrodes were referenced to the left mastoid. The ground electrode was mounted at the right mastoid. Impedances were kept below 5 kΩ. For monopolar EEG derivation, a portable amplifier (g.tec, Graz, Austria) was used. Signals were digitized at 256 Hz and bandpass filtered between 0.5 and 100 Hz. Sensitivity was set to 100 μV and a notch filter of 50 Hz was used.
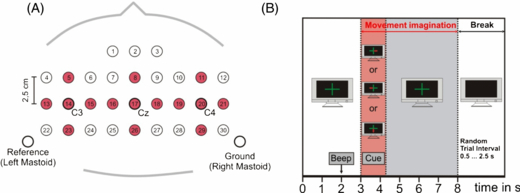
Figure 1. (A) Instead of all 32 electrode positions of the healthy participants, only 15 electrode positions (shaded in red) were used for later calculations. These were the same as those used for measurements with the patient group. (B) Timing and experimental paradigm.
Download figure:
Standard image High-resolution imageHealthy subjects: 32 electrodes (inter-electrode distance 2.5 cm) were recorded (bandpass 0.05–200 Hz) with a Neuroscan amplifier, sampling frequency was 1 kHz, and notch filter of 50 Hz.
For further analysis, only the same 15 electrode positions were used in the participants with SCI. Common averaged reference re-referencing was applied to the same 15 electrodes from the patients and healthy subjects (cf figure 1).
All subjects participated in 8 runs (each run contained 30 trials) that were separated by breaks for recovery and to avoid fatigue. They had to follow three tasks: kinaesthetic imagination (cf [31]) of movement of the right hand (R), kinaesthetic imagination of movement of the left hand (L) and kinaesthetic imagination of movement of the feet (F). The respective task was indicated by an arrow pointing randomly to the left, the right or to the bottom of the screen. A fixation cross 3 s prior to the particular arrow and an acoustic warning signal 2 s before it called attention to it. The arrow was shown for 1.25 s until it disappeared, the fixation cross remained for an additional 3.75 s, indicating that the imagination still had to be performed. This implies that a movement imagination lasting for 5 s was required (see figure 1(B)). Random breaks of 0.5–2.5 s between the trials were implemented. Measurements were carried out in the Rehabilitation Clinic Tobelbad (Tobelbad, Austria) or at the University.
2.3. Data analysis
2.3.1. Pre-processing
Prior to all analyses, a fully automated method for reducing electrooculogram artefacts [32] was applied on the data of both groups, patients and healthy subjects. Both groups were also visually scanned for remaining artefacts.
2.3.2. Single-trial classification
To obtain time–frequency maps of the 15 Laplacian channels, ERD/event-related synchronization (ERS) analysis was performed for overlapping frequency bands between 0 and 40 Hz, using a band width of 2 Hz. Significant (p < 0.01) band power decrease or increase (ERD/ERS), with respect to a specific reference interval (0.5–1.5 s) was determined by using a bootstrap algorithm [33].
Before computing the multi-channel common spatial patterns (CSP), the recorded EEG was bandpass filtered between 8 and 30 Hz [34]. The CSP method projects multi-channel EEG data into a low-dimensional spatial subspace in such a way that the variances of the filtered time series are optimal for discrimination [34]. From each of the analysed 1 s segments, individual linear discriminant analysis classifiers were computed by using 10×10 cross-validation.
A 3×3 analysis of variance (ANOVA) was computed in order to examine whether patients and healthy subjects differ regarding reached classification accuracies (using SPSS, Statistical Package for the Social Sciences, version 16.0). This ANOVA consisted of the between-subject variable group (three levels: paraplegic versus tetraplegic versus no paralysis) and the within-subject variable class (three levels: left hand versus right hand, left hand versus feet, right hand versus feet). In the case of violation of the sphericity assumption, Greenhouse–Geisser corrected values were used for further analysis. For statistically significant main factors or interactions, a Newman–Keuls post-test was performed.
2.3.3. Sensorimotor rhythms
ERD strength values in the EEG were estimated in the μm (8–13 Hz), lower beta (13–16 Hz), mid-beta (16–20 Hz) and upper beta (20–30 Hz) frequency bands recorded on Laplacian derivations over positions C3, Cz and C4 in the time range 3–8 s (the MI period). ERD strength was calculated from the mean average of all statistically significant (p < 0.01) ERD values, calculated via the method described in [33], on each Laplacian derivation in the specified time–frequency ranges.
Mean ERD strength over all three Laplacian derivations was also calculated to provide an additional estimate of the average difference in ERD strength over all derivations between healthy subjects and patient groups.
Four 3×3 ANOVAs were calculated with mean ERD values over all Laplacian derivations to determine the effect of factors group (healthy versus tetraplegic versus paraplegic patients) and class (left hand versus right hand versus foot MI) on ERD strengths in each frequency band. Four additional 3×3 ANOVAs were calculated on the non-averaged ERD values from each Laplacian derivation to determine the effect of factors group, class and cortical location (C3, Cz or C4) on the ERD strength.
Additionally, time since incidence of SCI may be argued to be a determining factor in ERD strength of patients with paralysis. Therefore, patients were divided in subacute (n = 7, time since incidence <12 months) and chronic (n = 9, time since incidence >12 months) and four 2×3 ANOVAs were calculated with 'time since incidence' and 'class' as factors and mean ERD values over all Laplacian derivations as the dependent variable.
2.3.4. Microstates
If one considers scalp electrical potentials from Ns electrodes at a single time point t to represent a coordinate on an Ns-dimensional plane, a microstate is defined as a coordinate vector from the origin to a point at a unit distance from the origin. All points lying on the line defined by this coordinate vector belong to the same microstate. In practice, very few points lie exactly on the line and so points sufficiently close to the line are said to belong to the microstate.
Microstate segmentation may, therefore, be performed by a modified k-means clustering algorithm described in [35] which aims to identify the best-fitting set of microstates. EEG is first bandpass filtered into the μm frequency band (8–13 Hz).
Microstates are then estimated and fit to the concatenated EEG from all participants (healthy subjects and patients) in an iterative process which aims to identify the best fitting set. The number of microstates are estimated and validated in a 10 × 10 cross-fold validation scheme as proposed in [35]. Finally, when the number of microstates have been identified, they are fit to the EEG recorded from each subject and the mean numbers of occurrences of each microstate map are measured from each subject under each condition. Comparisons may then be made in terms of the prevalence of each microstate in each subject group and under each of the three classes (left-/right-hand MI and foot MI). For each microstate, a 1×3 ANOVA is calculated with subject group as a factor with three levels (healthy, tetraplegic, and paraplegic). Additionally, comparisons between individual pairs of subject groups (healthy versus paraplegic, etc) are made via paired t-tests with numbers of occurrences of each microstate as dependent variables.
2.3.5. Functional connectivity
Statistical relationships between electrophysiological processes recorded from different cortical regions are defined as functional connections. The phase-locking statistic (PLS) is used here to measure connectivity between electrode channel pairs. This is defined as

where Ntrial denotes the total number of trials and θx, trial(f, τ) denotes the phase on channel x during a single trial at frequency f and time τ.
PLS are calculated from all trials for each class for each subject. This is done in the time range 3–8 s relative to cue presentation time (the MI period) and in the frequency bands, delta (0–4 Hz), theta (5–8 Hz), alpha (8–13 Hz), low beta (13–16 Hz), mid-beta (16–20 Hz) and high-beta (20–30 Hz). Then, t-tests are applied to identify statistically significant differences in PLS values between groups of subjects for each condition (left-/right-hand or feet MI).
3. Results
3.1. Single-trial classification
Statistical analysis revealed a significant main effect of 'group' (healthy, paraplegic or tetraplegic) (F(2,24) = 17.66; p < .0001), showing that healthy participants achieved significantly higher MI performance (M = 85.14; SD = 8.29; measured in terms of reached maximum classification accuracy) than paraplegic (M = 67.77; SD = 8.29) and tetraplegic participants (M = 63.60; SD = 8.29). Paraplegic and tetraplegic participants did not significantly differ regarding their MI performance. Figures 2 and 3 illustrate this finding.
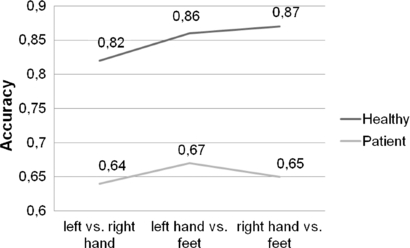
Figure 2. Two-class classification accuracy for healthy subjects (upper row values) and spinal cord injured patients (lower row values).
Download figure:
Standard image High-resolution image
Figure 3. Two-class classification accuracy (sequence: L versus R, L versus F, R versus F) for healthy subjects (upper row, A) and spinal cord injured patients (lower row, B). The black lines represent individuals, the thick red ones means over all subjects.
Download figure:
Standard image High-resolution imageMoreover, a significant result emerged for the main effect 'class' (left-hand (L), right-hand (R) or foot (F) MI), F(2,348) = 4.44; p < .05, implying a performance difference based on condition (L versus R, L versus F, R versus F). Participants reached significantly lower classification accuracies for the condition L versus R (M = 69.94; SD = 9.43) as compared to the condition F versus R (M = 72.67; SD = 8.13) and F versus L (M = 73.90; SD = 10.15).
Figure 4 shows time–frequency maps of two patients and a healthy volunteer. Significant ERD is illustrated in red colour shapes and significant ERS in blue colour shapes. Notable is the big inter-subject variability.
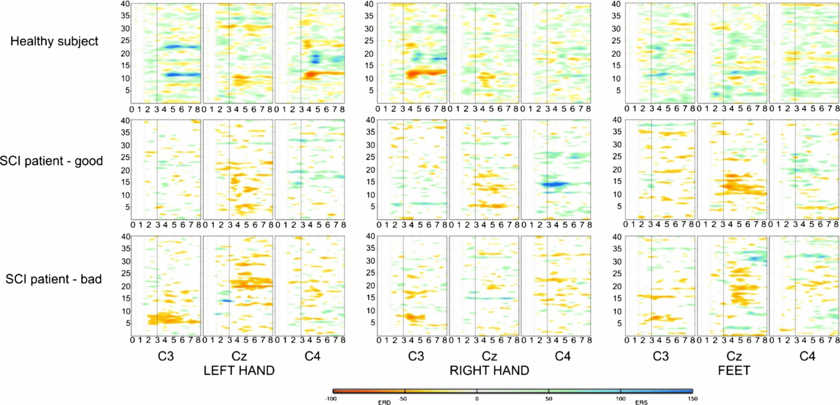
Figure 4. ERD/ERS maps for the three classes (L, R, F) over electrode positions C3, CZ, C4 exemplarily for a healthy subject, a patient with good performance and a patient with bad performance.
Download figure:
Standard image High-resolution image3.2. Sensorimotor rhythms
ANOVAs reveal a significant main effect of 'group' (healthy versus paraplegic versus tetraplegic) on ERD strengths over all three Laplacian derivations (F(2, 46) = 3.92, p = 0.0357) and over individual channels (likewise) in the mid-beta frequency band (16–20 Hz). There is also a significant effect of 'group × class' interaction (F21, 46 = 2.1, p = 0.0181) which shows a stronger ERD strength for feet MI in tetraplegic participants (M = −0.345, SD = 0.164) as compared to paraplegic (M = −0.196. SD = 0.09) and healthy participants (M = −0.136. SD = 0.08). Additionally, significant main effects of the factor class (left-hand, right-hand or foot MI) are found in alpha, lower, medium and higher beta bands (F(2, 46) = 3.33, p = 0.0446, F(2, 46) = 5.7, p = 0.006, F(2, 46) = 5.91, p = 0.0052, and F(2, 46) = 6.07, p = 0.0046, respectively). No significant effect of factor group was found when ERD values were calculated on individual Laplacian derivatives positioned over C3, Cz and C4.
The ANOVAs for ERD states, averaged across the motor cortical areas, resulted in a significant interaction 'group x class' (F(4, 42) = 3.41, p = 0.017) in the μ band. In healthy and paraplegic participants, no difference in the strength of overall ERD was found between the different MI classes, whereas for tetraplegic participants, ERD averaged over the whole motor cortex was significantly stronger for feet MI (M = −0.315, SD = 0.135) as compared to the right-hand (M = −0.163, SD = 0.093) and left-hand MI (M = −0.153, SD = 0.062). The same significant interaction was found in the mid-beta (F(4, 42) = 3.85, p = 0.009) and high-beta frequency bands (F(4, 42) = 4.66, p = 0.003), with significant stronger ERD during feet MI (mid-beta: M = −0.365, SD = 0.114; high-beta: M = −0.375, SD = 0.123) as compared to the right-hand (mid-beta: M = −0.184, SD = 0.83; high-beta: M = −0.195, SD = 0.116) and left-hand MI (mid-beta: M = −0.188, SD = 0.026; high-beta: M = −0.186, SD = 0.083) only in tetraplegic participants. In addition, the ERD during feet MI in tetraplegic participants was significantly stronger as compared to the ERD in paraplegic (mid-beta: M = −0.214, SD = 0.114; high-beta: M = −0.207, SD = 0.123) and healthy participants (mid-beta: M = −0.136, SD = 0.114; high-beta: M = −0.146, SD = 0.123).
No significant effect of time since injury is found in any frequency band or class.
Examples of ERDS maps are presented in figure 4. ERD and ERS strengths illustrated in the figure may be compared between healthy subjects, paraplegic patients and tetraplegic patients on Laplacian derivations over locations C3, Cz and C4 under each of the three MI conditions (left-, right-hand and feet MI).
3.3. Microstates
The EEG in the μ frequency band is clustered into six microstates. Significant effects of subject group (healthy, paraplegic or tetraplegic) are seen in microstates 1 (F2, 21 = 8.81, p = 0.0017), 2 (F2, 21 = 18.78, p ⩽ 0.001), 3 (F2, 21 = 15.13, p ⩽ 0.001) and 4 (F2, 21 = 18.8, p ⩽ 0.001). No significant effects of group are seen regarding microstates 5 and 6.
Figure 5 illustrates topographic scalp maps of the six microstates identified. Figure 6 illustrates the significant differences in numbers of occurrences of each microstate in the time window 3–8 s relative to the start of the trial (the MI period).

Figure 5. Topographic scalp maps of the six microstates identified in the 10 Hz frequency band.
Download figure:
Standard image High-resolution image
Figure 6. Numbers of instances of each microstate identified in the time window 3–8 s relative to start of the trial (motor imagery period) for healthy (H), tetraplegic (T) and paraplegic (P) subjects. The brackets below bars indicate significant differences between numbers of occurrences of each microstate (p < 0.05) as determined by t-tests.
Download figure:
Standard image High-resolution imageNote that there are significant differences found between the prevalence of occurrences of microstate topographies in the healthy subjects (H) compared to the paraplegic (P) and tetraplegic patients (T) but not between the paraplegic and tetraplegic patients.
3.4. Connectivity
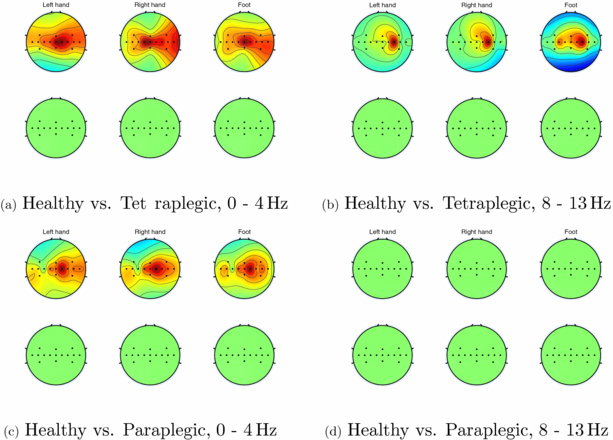
Significant differences (p < 0.05) are found in the number of channels which show significant increases in phase synchrony between healthy subjects and paraplegic subjects and between healthy subjects and tetraplegic subjects in the 0–4 Hz and 8–13 Hz frequency bands. This is illustrated in figure 7.
Figure 7. Channels which exhibit significant increases in PLV in the 0–4 and 8–13 Hz frequency bands in tetraplegic subjects compared to healthy subjects (top rows of sub figures (a) and (b), respectively) and significant decreases in PLV in the same bands in tetraplegic subjects compared to healthy subjects (bottom rows of sub figures (a) and (b), respectively). Sub figures (c) and (d) show the same for healthy subjects compared to paraplegic subjects.
Download figure:
Standard image High-resolution image
Note, no significant decreases in synchrony are found in either patient group compared to healthy subjects. No other significant changes (either increases or decreases) in phase-locking value (PLV) are found between healthy subjects, paraplegic and tetraplegic patients in any other frequency bands.
4. Discussion
The main findings are that there are some changes in ERD strengths in SCI patients, PLV is observed to increase, microstate occurrences are seen to change significantly and BCI accuracy is seen to decrease.
Regarding ERD strengths, there is a significant effect of group on ERD strength in the mid-beta frequency band and other, non-significant, effects in patient versus healthy participants in other frequency bands. Significant increases in ERD strength may be seen during feet MI in tetraplegic participants (mid-beta frequency band). These may be contrasted with findings reported in [36] in which a tetraplegic patient was trained with an MI-based BCI and showed similar results in the first measurement session, but after changing the MI strategy, a high accuracy was reached. Additionally, this result may be compared with the finding in [37] that activation of cortical areas may still be found in SCI patients or in [14] that activation may also even be found many years after SCI incidence after long-term MI and BCI training. Additionally, Gourab and Schmit [38] found that ERD and ERS strength both increase after incidences of SCI.
Other studies such as [39] report lower BCI classification accuracies in SCI patients. As BCI classifier results are based upon ERD/ERS strengths, presumably the SCI patients in this study also exhibited reduced ERD/ERS strength. In [40], it is reported that lower ERD/ERS are observed in SCI patients who are in pain, while [41, 42] both report decreases in alpha activity in SCI patients with and without pain. Overall, our findings may be seen to support those reported in [14, 38] that SCI incidence induces some increase in ERD strength.
It is of special interest to note that inclusion of the feet MI condition resulted in higher classification accuracies in healthy subjects, whereas in patients, this was not the case. This finding seems somewhat counter-intuitive. Tetraplegic participants exhibit increases in ERD but decreases in classification accuracy. However, it may be hypothesized that this is due to the BCI system employed—a BCI system similar to that often employed with both healthy participants and patients—not adequately taking account of all available features.
Tetraplegic participants show significant increases in ERD over the whole motor cortex compared to healthy participants during feet MI. This is reflected also in the reduced classification accuracy in plegic participants compared to healthy participants; a result which is also seen in [39]. In addition, the prevalence of occurrence of microstate topographies differs between healthy and plegic participants and PLVs are seen to significantly increase in plegic participants. In summary, these results point to a change in activation patterns of the motor cortex after SCI which results in differing activation patterns observed in the motor cortex during MI.
Significant increases in PLV are observed in the delta (0–4 Hz) and μ (8–13 Hz) frequency bands when comparing tetraplegic subjects with healthy subjects. Similarly, significant increases in PLV are also observed in the 0–4 Hz frequency band when comparing paraplegic subjects to healthy subjects. No significant decreases are observed and no significant differences are observed in any other frequency bands or between paraplegic and tetraplegic subjects.
This supports findings reported in [43] that inter-regional causality increases in SCI patients compared with healthy subjects and in [44] that connectivity increases in theta (4–7 Hz) and alpha (8–13 Hz) frequency bands in SCI patients. It also adds to and supports findings in [45] that incidences of SCI in rats immediately lead to changes in connectivity pathways. Furthermore, the frequency-specific changes in the connectivity strength in the delta and μ bands found in this study are supported by findings in [42] that low-frequency activity increases while μ band activity decreases in SCI patients with pain.
EEG microstates are also observed to differ significantly in the prevalence of their occurrences between healthy subjects and individuals with SCI. This may also be seen to occur when comparing healthy subjects and patients with other forms of neurophysiological impairment such as stroke [22].
It is important to note that the microstates identified in this work differ significantly from those described elsewhere [46]. Firstly, our microstates only focus on motor cortex channels as opposed to the whole scalp coverage. Secondly, our microstates focus only on the μ frequency band (arguably the most important band in MI BCI). Thus, our microstates focus only on spatial and spectral regions, thought to be most involved in MI. Nonetheless, spatial and spectral locations were constant over participants, thus, our comparative results remain both valid and informative when comparing subject groups.
Taken together, these results suggest that individuals with paraplegia or tetraplegia exhibit a greater degree of inter-cortical communication between electrode channels positioned over their motor cortical regions than individuals with no SCI. This may be contrasted with the observations of changes in ERD strength in both paraplegic and tetraplegic subjects.
ERD strength measures the localized deflections from baseline of EEG oscillations within a localized cortical area during the planning and execution of a period of motor execution or MI. PLV by contrast measures the amount of inter-regional communication between different cortical regions. Both the increase in PLV and changes in ERD strength may be in part due to plastic changes within the cortex in response to incidence of SCI.
One possible explanation is that as the brain learns that previous strategies for motor control, reflected in patterns of ERD/ERS activation, are no longer able to produce the desired movement, new strategies are attempted to try to gain control over the affected limbs. Doing so involves the recruitment of other cortical pathways and hence greater amounts of inter-regional communication (and hence PLV) between different regions of the cortex.
This may also be reflected in the significant differences observed in prevalences of microstate topographies. As the plastic changes induced in the brain result in attempts to recruit new cortical regions in motor control, reflected in PLV increases, so too the topographic maps of cortical activation change, resulting in different microstates being observed to be more prevalent or less prevalent between groups.
It may be argued that plastic changes in the brain in response to injury are only likely to occur shortly after incidence of injury, and therefore that changes in electrophysiological properties are more likely to occur in participants whose injury was more recent. However, no significant effect of time since injury is seen.
It is important to consider the caveats entailed in this study when interpreting its findings. While the number of subjects involved may be considered high for a BCI study, more participants would of course increase the generalizability of the results to a wider population.
Recently, Friedrich et al [47] showed that the combination of MI and other mental imageries lead to high classification rates higher than classical MI alone, as presented in this study. Therefore, it seems to be a good advice to apply a more general mental screening procedure, as proposed by [47] before starting a mental imagery-based BCI application.
Acknowledgments
The authors thank Patricia Linortner for her help in EEG measurements. This work was partially supported by the FP7 Framework EU Research Project BackHome (no 288566). This paper only reflects the authors' views and funding agencies are not liable for any use that may be made of the information contained herein.