

Abstract
The adoption of the Sustainable Development Goals (SDGs) and the new international climate treaty could put 2015 into the history books as a defining year for setting human development on a more sustainable pathway. The global climate policy and SDG agendas are highly interconnected: the way that the climate problem is addressed strongly affects the prospects of meeting numerous other SDGs and vice versa. Drawing on existing scenario results from a recent energy-economy-climate model inter-comparison project, this letter analyses these synergies and (risk) trade-offs of alternative 2 °C pathways across indicators relevant for energy-related SDGs and sustainable energy objectives. We find that limiting the availability of key mitigation technologies yields some co-benefits and decreases risks specific to these technologies but greatly increases many others. Fewer synergies and substantial trade-offs across SDGs are locked into the system for weak short-term climate policies that are broadly in line with current Intended Nationally Determined Contributions (INDCs), particularly when combined with constraints on technologies. Lowering energy demand growth is key to managing these trade-offs and creating synergies across multiple energy-related SD dimensions. We argue that SD considerations are central for choosing socially acceptable 2 °C pathways: the prospects of meeting other SDGs need not dwindle and can even be enhanced for some goals if appropriate climate policy choices are made. Progress on the climate policy and SDG agendas should therefore be tracked within a unified framework.
Export citation and abstract BibTeX RIS

Original content from this work may be used under the terms of the Creative Commons Attribution 3.0 licence. Any further distribution of this work must maintain attribution to the author(s) and the title of the work, journal citation and DOI.
1. Introduction
There is hope that 2015 will be remembered as a defining year for setting human development on a more sustainable pathway. Two important milestones were reached. On 25 September, a new development agenda was adopted in New York aimed at eradicating poverty and facilitating inclusive development within ever tighter planetary boundaries. Economic, social and environmental progress will be tracked across a set of agreed sustainable development goals (SDGs). The SDG framework is intended to manage trade-offs and maximize synergies across the 17 different goals and associated 169 targets (Griggs et al 2013).
On 12 December, countries agreed upon a new international climate treaty, the Paris Agreement, at the United Nations Framework Convention on Climate Change (UNFCCC) Conference of Parties (COP21) in Paris. It 'aims to strengthen the global response to the threat of climate change, in the context of sustainable development and efforts to eradicate poverty, including by holding the increase in the global average temperature to well below 2 °C above pre-industrial levels' (UNFCCC 2015a).
Both processes are highly interrelated: SD is an explicit part of the Paris Agreement, while avoiding dangerous climate change features as one of the SDGs (#13). In fact, failure in one process would undermine the success of the other. Stringent and sustained mitigation is a necessary condition for SD, because unabated climate change will exacerbate many of today's development issues and negate future improvements (see Fleurbaey et al 2014). However, it is an insufficient condition for SD, because some 2 °C pathways could, if not designed properly, undermine SD in non-climate dimensions. For example, pathways with a limited short-term ambition like the current INDCs may have higher SD risks than more ambitious ones. Such broader SD implications could delegitimize some 2 °C pathways or even the 2 °C target itself (Edenhofer and Kowarsch 2015). SD further hinges on the successful implementation of non-climate policies that complement or support climate policies in other dimensions. Thus, identifying socially acceptable 2 °C pathways requires framing climate policy in a broader SD context.
Assessments of alternative mitigation pathways so far have mainly focused on characterizing the underlying technological and economic challenges (Clarke et al 2014), but less is known about the wider social, economic and environmental implications. For example, many 2 °C pathways project large amounts of bioenergy demand in the second half of this century. It is highly debated in the literature whether these can be provided sustainably: food security, place-specific livelihoods, water availability and biodiversity are amongst the critical issues being discussed (Creutzig et al 2012, Smith et al 2014). At the same time, many 2 °C pathways project potential health gains and co-benefits for other sustainability objectives. The balance of these co-effects is poorly understood, particularly on the supply side, because risks of alternative 2 °C pathways for non-climate sustainability objectives have not yet been systematically analyzed (von Stechow et al 2015).
In this letter, we analyze the implications of alternative 2 °C pathways for SD risk dimensions by drawing on existing, publicly available inter-model comparison results from integrated energy-economy-climate models—henceforth referred to as integrated models (see SI section 1, available at stacks.iop.org/ERL/11/034022/mmedia). We demonstrate how broadening the analytical framework can allow both for a more informed public debate about alternative 2 °C pathways and how achieving the climate SDG may affect the prospects of meeting other energy-related SDGs. This is important both for critically discussing the relationship between the international climate policy and SDG agendas as well as for identifying stringent mitigation pathways that are socially acceptable.
2. Methods
Choosing appropriate climate policies is an exercise in risk management for which it is key to understand and evaluate relevant uncertainties (Kunreuther et al 2013). We focus on uncertainties related to different model structures and assumptions, i.e. 'model uncertainty' (Drouet et al 2015) and draw on results from a structured inter-comparison exercise of integrated energy-economy-climate models, AMPERE (Kriegler et al 2015, Riahi et al 2015). To complement existing literature, this data is used to assess relevant SD implications of alternative clusters of mitigation pathways that are consistent with the 2 °C target (see table S2) to initiate a public debate on their wider sustainability implications.
2.1. Choice of indicators for SD risks
The analysis builds on recent literature that explores a growing number of mitigation challenges with implications for non-climate sustainability objectives. Comprehensive discussions can be found in Clarke et al (2014, section 6.6) and von Stechow et al (2015, section 4). Table 1 summarizes the indicators that can be calculated from integrated model variables. Our choice of indicators is further constrained by the model structures, scenario runs, and reported variables as aggregated in the publicly available AMPERE database (https://secure.iiasa.ac.at/web-apps/ene/AMPEREDB). For example, the coarse regional disaggregation of reported data in AMPERE impedes the analysis of indicators that are most relevant for inequality and poverty outcomes, such as energy supply per capita to satiate basic human needs (see Steckel et al 2013, Lamb and Rao 2015 and SI section 2 for a discussion of further model limitations). By systematically linking the chosen set of indicators to global SD risks, we can present a first, rough approximation of how alternative clusters of 2 °C pathways perform with respect to energy-related SDGs and other multilaterally agreed sustainable energy objectives (see table 2 and SI section 3 for a discussion on the indicator choice).
Table 1. Integrated model literature on mitigation challenges with implications for non-climate sustainability objectives, with a focus on indicators that can be calculated from model variables. The different categories largely follow table 4.1 in Fleurbaey et al (2014). Due to strengths and weaknesses of the models, some mitigation challenges were only analyzed by individual models while others were covered by multiple models—mostly in the context of model inter-comparison projects. A comprehensive review on co-benefits and risks of mitigation is provided in von Stechow et al (2015).
| Mitigation challenges | Indicators used | Selected literature |
|---|---|---|
| Economic/affordability challenges | ||
| Aggregate economic costs of mitigation | Aggregated and discounted GDP/consumption losses | Kriegler et al 2013, Paltsev and Capros 2013, Clarke et al 2014, Kriegler et al 2014, Rogelj et al 2015 |
| Transitional economic costs of mitigation | Consumption growth reduction | Kriegler et al 2013, Luderer et al 2013a, 2013b, Bertram et al 2015b |
| Carbon price growth | Carbon price jump over a decade | Rogelj et al 2013a, 2015 |
| Global energy price index | Luderer et al 2013b, Bertram et al 2015b | |
| Energy price growth | Electricity price growth rate | Kriegler et al 2013, Rogelj et al 2015 |
| Stranded fossil investment | Idle power plant capacity per year | Luderer et al 2013a, Rogelj et al 2013a, Bertram et al 2015a, Johnson et al 2015 |
| Energy dependence | Trade flows between regions | Cherp et al 2013, Jewell et al 2013, 2014, Riahi et al 2012 |
| Resilience of energy systems | Diversity of energy carriers in individual sectors (SWDI, HHI) | Cherp et al 2013, Jewell et al 2013, 2014 |
| Depletion of oil reserves | Cumulative oil extraction | Sathaye et al 2011, Jewell et al 2013 |
| Technological/innovation challenges | ||
| Integration challenges of low-carbon technologies | Technological upscaling (rates) | Wilson et al 2013, Kim et al 2014, Eom et al 2015, Riahi et al 2015, van Sluisveld et al 2015, Bertram et al 2015a |
| Carbon intensity improvement | Carbon intensity reduction rates | Luderer et al 2013a, Edenhofer et al 2014a, Kriegler et al 2014, Riahi et al 2015 |
| Social/institutional challenges | ||
| Food price increase | World and regional market prices | von Braun et al 2008, PBL 2012, Lotze-Campen et al 2014, Wise et al 2014, van Vuuren et al 2015 |
| Energy supply per capita/energy access | Final energy supply per year/access to modern fuels | van Ruijven et al 2012, Daioglou et al 2012, Krey et al 2012, Steckel et al 2013, Riahi et al 2012, Pachauri et al 2013, Lamb and Rao 2015, van Vuuren et al 2015 |
| Nuclear proliferation | Enrichment/reprocessing facilities | Lehtveer and Hedenus 2015 |
| Carbon market value | Value of cumulative emissions | Luderer et al 2013b, Bertram et al 2015b |
| Environmental challenges | ||
| Resource extraction/use | Cumulative coal/uranium extraction | Rogner et al 2012, Bauer et al 2013, McCollum et al 2014 |
| Bioenergy expansion | Biomass supply for energy | Creutzig et al 2012, Smith et al 2014 |
| Air pollutant concentration | SO2, BC, OC and NOx emissions/concentrations | Riahi et al 2012, McCollum et al 2013a, Rogelj et al 2014, Rose et al 2014, Strefler et al 2014, van Vuuren et al 2015 |
| Environmental risks of CO2 capture and storage | CO2 (fossil/biomass) captured and stored underground | Kriegler et al 2013, Eom et al 2015, Rogelj et al 2015, Smith et al 2016 |
| Land use change | Global area changes for cropland, pasture, biomass, unmanaged land | Wise et al 2009, Reilly et al 2012, Lotze-Campen et al 2014, Popp et al 2014, Calvin et al 2014 |
| Water shortage | Water use (mainly for bioenergy supply) | De Fraiture et al 2008, Arnell et al 2011, PBL 2012, Hejazi et al 2013, Bonsch et al 2016 |
| Biodiversity loss | Mean species abundance (MSA) | PBL 2012, van Vuuren et al 2015 |
| Peak atmospheric CO2 concentration | Cumulative CO2 emissions until mid-century | Joos et al 2011, Zickfeld et al 2012 |
| Exceedance likelihood/ overshoot risk | Likelihood of exceeding specific temperature/concentration target | Kriegler et al 2013, Luderer et al 2013b, Rogelj et al 2013a, 2013b |
Table 2. The link between relevant and available indicators calculated from integrated model variables, SD risk dimensions, and SDGs and other sustainable energy objectives. See figure S2 and SI section 3 for more details.
| Indicators calculated from integrated model variables | SD risk dimensions affected by mitigation | SDGs and other sustainable energy objectives |
|---|---|---|
| Biomass supply for energy per year | Bioenergy expansion | Food security (SDG 2) |
| Cumulative BC and SO2 emissions | Air pollutant concentration | Health via air quality (SDG 3.9) |
| Maximum decadal energy price growth | Energy price growth | Energy access (SDG 7) |
| Maximum decadal growth reduction | Consumption growth reduction | Economic growth (SDG 8.1) |
| Idle coal capacity per year | Stranded fossil investment | Full employment (SDG 8.3) |
| Maximum decadal PV and Wind upscaling | Wind & PV grid integration | Resilient infrastructure (SDG 9) |
| Cumulative global oil trade, cumulative oil extraction, fuel diversity of transport sector | Oil insecurity, transport sector reliance on oil | Ensure energy securitya |
| Nuclear capacity expansion in Newcomersb | Nuclear proliferation | Peaceful use of nuclear power |
| Cumulative CO2 emissions until mid-century | Peak atmospheric CO2 concentration | Minimize ocean acidification (SDG 14.3) |
| CO2 captured and stored per year | Environmental risks of CCS | Sustainable production (SDG 12.4) |
aDue to the focus on global risks, the analysis is limited to oil security—the fuel with the highest scarcity concerns and high import dependence in most countries, lacking substitutes in transport (see SI section 3.1.7). bWe designed a new indicator that can draw on existing model variables (see SI section 3.2).
Due to the limited data availability, the analysis cannot address all relevant SDGs explicitly. But it enables us to provide an early contribution to public and scientific debates on the relationship between the international climate policy and SDG agendas and contribute to important early learning processes. To simplify the complex relationship between indicators, energy-related SDGs and other sustainable energy objectives (see figure S2), table 2 focuses on the strongest links between them. However, many indicators are also relevant for some cross-cutting SDGs, such as poverty and inequality, which are not addressed in the analysis (see SI section 3.1). The resulting set of indicators is relevant for judging both co-benefits of mitigation (air quality, oil security) and mitigation risks (upscaling of bioenergy and low-carbon electricity technologies) and has been shown to have substantial sustainability implications in many integrated models (Jewell et al 2013, McCollum et al 2013a, von Stechow et al 2015). It also includes an indicator for ocean acidification (Joos et al 2011, Zickfeld et al 2012) as well as three indicators that relate to transitional socioeconomic mitigation risks (growth in mitigation costs and energy prices as well as early retirement of coal capacity).
Our analysis presents SD risk profiles for alternative clusters of 2 °C pathways (see figures 2– 4). The figures plot percentage changes over baseline projections in each dimension rather than comparing different metrics to each other and/or identifying critical thresholds because of the difficulty of incommensurability across different SD dimensions (von Stechow et al 2015). Care needs to be taken in the interpretation, because the different risks analyzed cannot be directly compared to each other, i.e. a larger increase in one risk is not necessarily more important than a smaller increase in another risk. Any interpretation of these risk profiles and any trade-off across risk dimensions requires evaluation and weighting—and this depends on the locally specific policy contexts and differ depending on individual priorities and risk perceptions (Slovic 1987, Jakob and Edenhofer 2014, Kunreuther et al 2014). The provided risk profiles therefore allow readers to make their own judgement about the relevance of changes in risk levels across SD dimensions. In this sense our analysis provides a starting point for a more informed public debate about the interaction between the mitigation and other energy-related SDGs that will put the normative aspects of such evaluation centre stage (see Edenhofer et al 2014b).
2.2. Choice of scenario data
Using model inter-comparison results from AMPERE allows us to take advantage of an internally consistent set of scenario specifications and harmonized input assumptions (Kriegler et al 2015, Riahi et al 2015). AMPERE work package 2 was chosen because (i) the data is publicly available, (ii) it consistently defines alternative short-term climate policy pathways across models until 2030, which is particularly relevant from an SDG perspective with a focus on short/medium-term developments, and (iii) it is the only model inter-comparison project that combines different types of constraints with respect to the stringency of short-term climate policies and the availability of mitigation technologies or energy demand growth assumptions (see table 3 and SI section S4). This is a key requirement for comprehensively exploring the SD risk dimensions of alternative 2 °C pathways. Yet the reported data does not shed light on all relevant dimensions. One shortcoming is the simplifying assumption of regionally homogeneous carbon prices without consideration of burden sharing regimes. This impedes an analysis of regional mitigation cost distributions (see den Elzen et al 2008, Luderer et al 2012, Tavoni et al 2013, Aboumahboub et al 2014, Tavoni et al 2015) and related SD implications.
Table 3. Naming of AMPERE mitigation scenarios (see table S3 and Riahi et al 2015 for details).
| Model constraints | Description | Scenario name |
|---|---|---|
| Short-term targets (2030) | ||
| Optimal policy | Emissions follow optimal 2 °C pathway | 'OPT' |
| Low short-term target | High-ambition pathway (low short-term target): 53 Gt CO2eq | 'LST' |
| High short-term target | Low-ambition pathway (high short-term target): 61 Gt CO2eq | 'HST' |
| Technology cases | ||
| Full portfolio of technologies | Full portfolio of mitigation technologies | 'Full-Tech' |
| Low energy intensitya | Energy intensity improvements rate doubles | 'LowEI' |
| Limited biomass | Limited global potential for bioenergy (<100 EJ/yr) | 'LimBio' |
| No CCS available | CO2 capture and storage never becomes available | 'NoCCS' |
| Limited solar/wind potential | Limited potential (<20% of regional electricity supply) | 'LimSW' |
| No new nuclear plants | No new nuclear capacity is added; older plants are retired | 'NucOff' |
aLowEI scenarios assume lower final energy demand due to improvements in energy efficiency and behavioral changes so that equivalent levels of overall energy service are supplied with lower final energy. Due to the limited representation of end-use technologies in some models, many models represent this in a stylized way.
The analysis draws on more than 20 scenario specifications from seven models: DNE21+, GCAM, IMAGE, MESSAGE, POLES, REMIND, and WITCH (for further information, see Riahi et al (2015) and SI section 4). To avoid comparisons of scenario results from different sets of models, most figures only draw on a subset of models as (i) not all models ran or found a solution for all mitigation scenario specifications, and (ii) not all models report results for all indicators due to model type, assumptions on parameters and constraints, or respective system boundaries (see table S1). The results are presented similarly to the scenario ranges in the Working Group III contribution to the IPCC Fifth Assessment Report (WGIII AR5) because this shows variability across models. However, given that the sample size is small and no systematic variation of all relevant model input assumptions was performed this variability does not represent full model uncertainty.
3. Results
The analysis is divided into two parts: we assess co-benefits of alternative 2 °C pathways before turning to their mitigation risk profiles. In each part, we systematically analyze different clusters of 2 °C pathways to understand the implications for SD outcomes of variations in (i) short-term climate policy stringency, (ii) availability of mitigation technologies or (iii) a combination of the two. Analyzing these clusters is highly relevant, because the current and projected INDC emission trajectories are not consistent with optimal 2 °C pathways (UNFCCC 2015b) and the standard assumption of full technological flexibility is inhibited as significant upscaling of low-carbon technologies faces many different hurdles in practice8 . Our analysis here focuses on the first half of the 21st century in which the interaction of short-term climate policies and the long-term climate target is strongest (Kriegler et al 2013, Luderer et al 2013a, 2013b, Riahi et al 2015, Eom et al 2015, Bertram et al 2015a).
3.1. Synergies across mitigation and sustainable energy objectives
Figure 1 uses cumulative indicators for (i) CO2 emissions (Zickfeld et al 2012), (ii) the co-emitted air pollutants black carbon (BC) and sulphur dioxide (SO2) and (iii) global oil extraction and trade as well as transport sector reliance on oil to present reduced SD risks, i.e. co-benefits of mitigation scenarios compared to baseline developments. Figure 1 shows that co-benefits in terms of lower ocean acidification, health and oil security increase relative to optimal 2 °C pathways by limiting the availability of key mitigation technologies, though considerable differences exist for different technologies and different sustainable energy objectives. This is for three main reasons:
- (i)The unavailability of low-carbon technologies limits long-term mitigation potential, resulting in greater near-term emissions reduction requirements to meet a particular long-term climate goal. This leads to a decrease in fossil fuel use in the medium term (with lower cumulative global oil trade, oil extraction as well as transport sector reliance on oil) and the associated CO2 emissions and co-emitted air pollutants. Limiting technologies that play a smaller role in reaching the long-term goal results in less dramatic transition requirements and fewer additional co-benefits.
- (ii)
- (iii)Limiting the deployment of bioenergy or CCS technologies that are associated with co-emitted air pollutants themselves (see SI section 3.1.9) additionally reduces air pollutant emission levels—which is not the case for limiting the availability of non-combustible RE or new nuclear capacity.
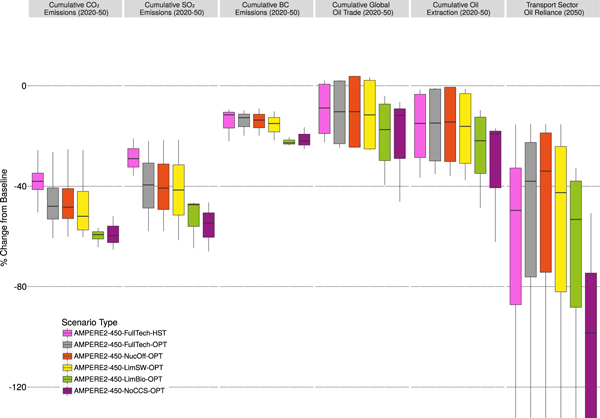
Figure 1. Percentage changes in indicators for co-benefits for reduced ocean acidification, air quality, oil security, and transport sector fuel diversity in alternative 2 °C pathways for four integrated models (GCAM, MESSAGE, POLES, REMIND) relative to baseline scenarios, comparing immediate mitigation scenarios assuming full availability of mitigation technologies (grey) with delayed mitigation scenarios (pink) and immediate mitigation scenarios assuming no new nuclear capacity (red), limited potential for solar and wind energy (yellow) limited global bioenergy potential (green) or unavailability of CCS (purple). The thick black lines show the median of results, the coloured ranges show the interquartile ranges and whiskers show the minimum and maximum results.
Download figure:
Standard image High-resolution imageAdmittedly, these results only cover a small subset of potential co-benefits from mitigation. However, the literature suggests that this finding may apply more broadly (see von Stechow et al 2015 for a review and synthesis): climate policy that leads to less fossil fuel use and energy demand growth in the near term drives a broad range of co-benefits beyond air quality and oil security, such as reduced water use and pollution, reduced ecosystem impacts, reduced health impacts (also due to more physical activity under changed mobility patterns and less fuel poverty in insulated housing) as well as more local employment opportunities.
Comparing optimal 2 °C pathways with scenarios assuming weak short-term climate policies confirms the positive effect of stringent mitigation in the near term on the magnitude of co-benefits (see figure S5 for the year 2030): weak short-term climate policies imply a reduction in co-benefits relative to those that could materialize in optimal 2 °C pathways. This effect is, however, not as obvious for cumulative 2050 values (see figure 1) because some of the additional mitigation efforts in the period 2030–2050 partially compensate for weak climate policies until 2030. Since the transport sector is characterized by faster capital turnover rates (at least with regard to the vehicle fleet) (Bertram et al 2015a), it can react more quickly to carbon price changes, compensating for higher emissions from sectors that are less flexible. This may lead, for example, to a higher fuel diversity in the transport sector in the year 2050 in delayed mitigation scenarios compared to optimal 2 °C pathways albeit at high uncertainty.
3.2. Trade-offs between mitigation and sustainable energy objectives
While constraining a particular mitigation technology may minimize the mitigation risks specific to that technology, it usually implies an increase in the deployment of other low-carbon technologies, which may incur other mitigation risks. Figure 2 shows that limiting the availability of specific technologies in 2 °C pathways with immediate global climate policies substantially increases the risk of not meeting other sustainable energy objectives. While the unavailability of CCS and limitation of bioenergy potential lead to the largest co-benefits (see figure 1), they also entail significantly higher SD risks. This can be explained by the promise of greater flexibility in near-term emission pathways that are still able to meet the long-term climate goal through the presence of carbon dioxide removal technologies, such as bioenergy with CCS (BECCS). Constraining BECCS deployment by limiting the global bioenergy potential or ruling out CCS deployment results in substantially higher deployment of other mitigation technologies in the medium term. The increase is much less pronounced for limiting the potential for solar and wind energy or assuming no new nuclear capacity (see figure S6).
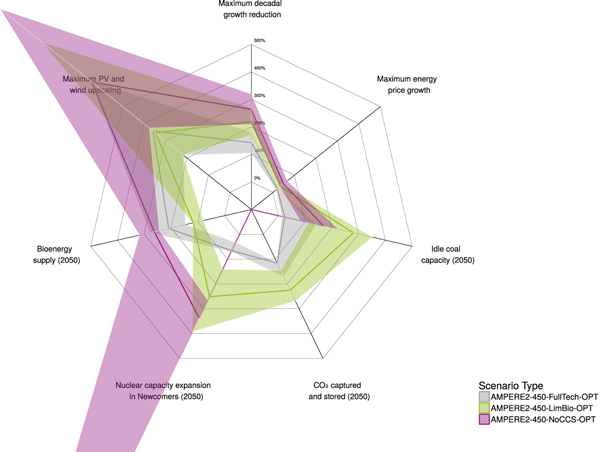
Figure 2. Percentage changes in mitigation risk dimensions in alternative 2 °C pathways for three integrated models (GCAM, MESSAGE, REMIND) relative to baseline scenarios and a CCS reference value, comparing immediate mitigation scenarios assuming full availability of mitigation technologies (grey), with scenarios assuming limited global bioenergy potential (green) and unavailability of CCS (purple). Thick coloured lines show median results; coloured ranges show interquartile ranges. Neither the distance to the 0%-line nor the total area covered by the shaded areas are good guidance for the overall mitigation risk of particular scenarios. Instead, the evaluation differs for locally specific contexts with varying priority settings and risk perceptions (see discussion in section 2.2).
Download figure:
Standard image High-resolution imageDue to the different nature of the mitigation risks, it is unclear how decreasing risks in one dimension (e.g. bioenergy expansion or environmental risks associated with CCS deployment), can be traded off with risk increases in others (e.g. transitional growth reduction, energy price growth, nuclear proliferation or the technological challenges of integrating high amounts of fluctuating RE into existing power grids in a very short time frame). For example, a 20%–30% increase in energy prices may have a much more immediate, adverse effect on the poor in many countries than a 4-7-fold increase in maximum decadal upscaling of variable renewable energy sources, which is primarily a technological and institutional challenge for infrastructure provision. Rather than aggregating effects across different risk dimensions, the purpose of this analysis is to make the trade-offs across alternative clusters of mitigation pathways transparent. Hence, the way the climate SDG is met can substantially alter the risks of not meeting other SDGs and sustainable energy objectives.
This is confirmed by figure 3: delaying stringent mitigation in the near term leads to a significant increase in mitigation risk levels in the medium term compared to optimal 2 °C pathways. With more GHG emissions before 2030, subsequent reductions are more expensive (Luderer et al 2013b) and need to be faster to stay below 2 °C (Eom et al 2015)—with implications for the grid integration of fluctuating RE (see SI section 3.1.6) and for stranded investments in coal capacity (Johnson et al 2015) and the associated job losses (Rozenberg et al 2014). The carbon lock-in effect hence manifests itself particularly in technological and economic risk dimensions. To a lesser degree, these effects can also be seen for delayed mitigation scenarios with more optimistic assumptions about short-term climate policies (see figure S7). Hence, delaying stringent mitigation implies forgoing potential paths with lower risks along multiple SD dimensions.

Figure 3. Percentage changes in mitigation risk dimensions in alternative 2 °C pathways for six integrated models (DNE21+, GCAM, MESSAGE, POLES, REMIND, WITCH) relative to baseline scenarios and a CCS reference value, comparing immediate (grey) with delayed mitigation scenarios (pink) and immediate mitigation scenarios with lower energy demand growth (blue). Neither the distance to the 0%-line nor the total area covered by the shaded areas are good guidance for the overall mitigation risk of particular scenarios. Instead, the evaluation differs for locally specific contexts with varying priority settings and risk perceptions (see discussion in section 2.2).
Download figure:
Standard image High-resolution imageIn contrast, assuming lower energy demand growth entails mitigation risk reductions relative to optimal 2 °C pathways (see figure 3). As each unit of energy not produced is free of pervasive supply-side risks, reducing energy demand by promoting energy efficiency in end-use sectors (e.g., consumer appliances), lifestyle changes (e.g., people living in higher-density areas and eating less dairy and meat) and structural changes in the economy (e.g., shifting to more service-oriented economies) is an important strategy both for mitigation and other sustainable energy objectives (von Stechow et al 2015).
Note that these reductions in energy demand growth are assumed to happen in the baseline scenarios, i.e. independent of the mitigation efforts and hence without a cost mark-up; it is unclear how future energy demand levels would develop under real-world conditions where clean energy and energy efficiency projects may compete for limited funds (McCollum et al 2013b). Furthermore, the models do not simply prescribe lower energy supply at the expense of energy service supply, but alter assumptions on the average energy intensity improvement rates and, e.g., on the viability of more compact, public transit-friendly urban areas (Riahi et al 2015). This does not imply, however, that all integrated models project final energy supplies in mitigation scenarios that are consistent with minimum thresholds of energy consumption to satiate basic needs related to cooking, heating, health and other infrastructure (Steckel et al 2013, Lamb and Rao 2015). Hence, projections of energy demand from individual models need to be interpreted with care (see discussion in SI section 2).
3.3. Trade-offs between mitigation and sustainable energy objectives for combined model constraints
As current GHG emission trends keep tracking along business-as-usual (Edenhofer et al 2014a) and societal concerns grow with regard to upscaling of many low-carbon technologies (see footnote 8), 2 °C pathways with multiple constraints seem to mirror most closely developments observed in the real world. In fact, delaying stringent mitigation in combination with technological constraints risks no longer meeting the climate goal (Riahi et al 2015), substantially increases mitigation risks (see figure 4) and increasingly jeopardizes our ability to manage risk trade-offs. For CCS and bioenergy whose unavailability/limitations already show substantial risk trade-offs in immediate mitigation scenarios, most models can no longer find a solution (for CCS unavailability only DNE21+ and GCAM; for limited global bioenergy potential only GCAM, POLES, and REMIND) implying a high risk of not meeting the 2 °C target.

Figure 4. Percentage changes in mitigation risk dimensions in alternative 2 °C pathways for four integrated models (GCAM, MESSAGE, POLES, REMIND) relative to baseline scenarios and a CCS reference value, comparing delayed mitigation scenarios assuming full availability of mitigation technologies and weak short-term climate policies (purple) with delayed mitigation scenarios assuming limited global availability of bioenergy (green). Neither the distance to the 0%-line nor the total area covered by the shaded areas are good guidance for the overall mitigation risk of particular scenarios. Instead, the evaluation differs for locally specific contexts with varying priority settings and risk perceptions (see discussion in section 2.2).
Download figure:
Standard image High-resolution imageFigure 4 draws on AMPERE scenarios with multiple constraints but shows results for more optimistic—albeit not optimal — short-term climate policies9 , with and without limited global bioenergy potential. As models work close to their feasibility frontier, the additional constraint results in large mitigation risk increases. Even for non-biomass RE and nuclear energy, whose limitation/phase-out has rather small effects in immediate 2 °C pathways, risk trade-offs increase strongly for delayed mitigation scenarios in some dimensions (see figures S7 and S8).
4. Discussion
This letter presents a first attempt to shed light on the question of how alternative 2 °C pathways perform in non-climate SD dimensions and to draw conclusions about important interactions between stringent mitigation and other sustainable energy objectives. Figure 5 shows an overview of the different clusters of constrained 2 °C pathways relative to (each model's) optimal pathways (i.e., those with immediate mitigation, full technology portfolios, and conventional energy demand growth). We use 'optimal' scenarios as benchmarks because they show comparatively balanced risk profiles relative to baseline developments (see figures 2– 4) and because they are commonly used as reference point for policy analysis, e.g. in the WGIII AR5 (Edenhofer et al 2014a). This enables the comparison of the various SD implications of one cluster of 2 °C pathways to those of all others and therefore facilitates an informed public debate on socially acceptable SD risks and thus the interaction between the international climate policy and the broader SDG agendas.

Figure 5. Percentage changes in SD risk dimensions that can be linked to a set of SDGs and other sustainable energy objectives in constrained 2 °C pathways relative to optimal pathways (assuming immediate mitigation with full availability of mitigation technologies and conventional energy demand growth). The different shapes denote different short-term climate policy stringencies while the different colours denote different technology cases (see table 3). As the figure aims at showing trends in synergies and risk trade-offs of alternative clusters of 2 °C pathways rather than an exact quantitative analysis, results are plotted in logarithmic scale (see table S4 for the underlying data).
Download figure:
Standard image High-resolution image
Note that 'optimal' pathways are not necessarily the most socially desirable because they may already involve unacceptable risks. Scientific analysis alone cannot judge whether a particular 2 °C pathway poses acceptable or unacceptable risks to society (Edenhofer and Minx 2014). Science can, however, explore alternative mitigation pathways and inform an enlightened public debate across SD risk dimensions in an iterative learning process (Edenhofer and Kowarsch 2015). For example, annual bioenergy supply is projected to reach up to 168 EJ (median: 158 EJ) in 2050 in optimal scenarios. These levels of biomass extraction may already be associated with fundamental challenges with respect to food security, place-specific livelihoods, water availability and biodiversity (Creutzig et al 2012, Smith et al 2014). These numbers further increase substantially over the second half of the century, reaching up to 862 EJ (median: 268 EJ) with growing requirements for removing CO2 from the atmosphere via bioenergy with CCS (BECCS) technologies in many available scenarios (Clarke et al 2014). Many 'optimal' 2 °C pathways have therefore been challenged on these grounds (Fuss et al 2014, Smith et al 2016).
In a world which is increasingly unlikely to develop along 'optimal' scenario trajectories, an informed public debate about synergies and risk trade-offs implied by alternative clusters of constrained 2 °C pathways is key for identifying those which are socially acceptable. For example, current INDCs at best add up to emission trajectories similar to those 2 °C pathways with low short-term ambition ('LST' scenarios, see table 3)10 . According to figure 5, these pathways (presented as circles) not only lead to fewer co-benefits compared to optimal 2 °C pathways (except for cumulative BC emissions and transport sector oil reliance) but also to significantly higher mitigation risk levels, particularly in socioeconomic dimensions—with higher risks of not meeting those SDGs related to economic growth, energy access, job preservation, food security and resilient grid infrastructure (see also figure S7).
When a technology constraint is added, only the risks specific to that technology can be lowered (e.g. reduced nuclear proliferation risks for scenarios with no new nuclear capacity or fewer grid integration challenges for scenarios with limited potential for solar and wind energy, see also figures S8 and S9). The other risk levels are exacerbated, particularly for those SDGs that relate to economic growth, job preservation, resilient infrastructure, and ocean acidification. This is particularly obvious for scenarios with limited global potential of bioenergy in which the risks related to bioenergy expansion are lower (including environmental effects related to BECCS deployment) but the risks of not meeting socioeconomic SDGs are significantly higher (see green circles in figure 5). Limiting the global use of bioenergy to 100 EJ per year by 2050—widely believed to be more sustainable (Creutzig et al 2014)—hence introduces a trade-off with socioeconomic objectives for weak short-term climate policies (see green circles in figure 5).
While there are uncertainties around acceptable levels of bioenergy deployment, the development and deployment of CCS technology is lagging behind expectations (IEA 2009), despite its important role in keeping mitigation costs at relatively low levels (Edenhofer et al 2014a). Our results highlight two things: first, those models that are flexible enough to compensate for the unavailability of CCS can only do so with increased upscaling requirements for other low-carbon technologies and related SD risks (see pink circles in figure 5). This also implies high near-term mitigation requirements with associated co-benefits. Second, the absence of CCS seriously questions the achievability of the 2 °C target in a world with delayed climate action and therefore threatens the climate SDG itself—only two models can report results for the combination with weak short-term climate policies.
In contrast, 2 °C pathways with lower energy demand growth generally entail a substantial reduction in SD risk levels (blue shapes in figure 5). This confirms results from a bottom-up assessment of the wider SD implications of technology-specific studies from a cross-sectoral perspective (von Stechow et al 2015). While these scenarios typically do not feature many additional co-benefits due to lower supply-side transition requirements, achieving lower energy demand growth has considerable synergies with the SDG agenda related to economic growth, food security, resilient grid infrastructure as well as with the peaceful use of nuclear energy. Delaying mitigation in scenarios with low energy demand growth only entails moderate risk increases—although some co-benefits are reduced and more coal capacity is likely to be retired early. Pursuing aggressive energy efficiency improvements across all sectors and rethinking high-energy lifestyles therefore seems essential to increase synergies and keep the trade-offs across SDGs manageable in a world that is characterized by multiple constraints. Unfortunately, model inter-comparison projects have not yet analyzed the combination of technology constraints and low energy demand growth pathways, which is a promising research area to better understand synergies between SDGs. Future research should also ensure that mitigation scenarios are consistent with minimum thresholds of energy demand necessary to satiate basic human needs (see discussion in SI section 2).
This letter has analyzed the changes in SD risks across alternative 2 °C pathways. These effects depend to a great extent on the development context, i.e., assumptions about baseline developments (Moss et al 2010, O'Neill et al 2014). To circumvent this potential caveat, the analysis used AMPERE data that stands out in its comprehensive effort to harmonize future socio-economic drivers of SD across models in the baseline scenarios: e.g., regional-level gross domestic product (GDP), population, and energy demand growth. This makes the results more comparable across models but begs the question of how the results would have changed for alternative assumptions beyond changes in energy demand growth. Research can and should build on alternative baseline developments as expressed by the 'shared socioeconomic pathways' (O'Neill et al 2014) that will soon be published even though important, non-trivial discussions remain on how SDGs can be adequately built into these baselines (O'Neill et al 2015).
Indicators that were used to track the changes in SD risks are only rough and sometimes very rough approximations of individual SDGs. There is no doubt that individual models—particularly those coupled to a detailed agro-economic and land-use model—could already provide better indicators, such as for water availability and ecosystem impacts which are important concerns in stringent mitigation pathways (see SI section 3.1.1). However, these have not yet been analyzed in a multi-model study (von Stechow et al 2015). We believe that such inter-model comparison results are crucial for a meaningful public debate about SD risks.
Another important caveat of the analysis is that we focus on 2050 and the preceding decades when looking at the implications of alternative 2 °C pathways for SD risk dimensions. The risks of some 2 °C pathways, however, only unfold later in that century when some particularly risky negative emissions technologies, such as BECCS, are being deployed at large scale to compensate for lower mitigation efforts in the first decades and residual GHG emissions in other sectors (Fuss et al 2014, Smith et al 2016). For illustrative purposes, figures S10 and S11 show how mitigation risks change from 2050 to 2080 for scenarios with substantially different amounts of negative emission requirements. Since the AMPERE scenario specifications do not allow for a meaningful comparison across scenarios with low or high amounts of negative emissions, we use the amount of radiative forcing overshoot to cluster scenarios with respect to their dependence on negative emissions (also used in the WGIII AR5 scenario database, see Krey et al 2014). It shows that the magnitude of the mitigation risk levels can change substantially over time for those dimensions that are related to negative emission technologies such as CCS and bioenergy deployment.
Our analysis points to important future challenges: first, the chosen indicators do not represent all SDGs as some touch on socio-cultural and institutional aspects which are challenging—if not impossible—to represent in an economic model framework (see SI section 2). Second, the changes in the indicators across scenarios are merely indicative for the change in risks to meet the related SDGs and sustainable energy objectives because there are many more relevant drivers that cannot be analyzed based on the available scenario data. Third, many relevant issues play out at lower geographic and time scales which are difficult to represent adequately in global-scale integrated models. For example, food security is driven by many socioeconomic drivers both on global and local scales and bioenergy expansion represents but one of those (Tscharntke et al 2012). And according to Creutzig et al (2012), the models are not (yet) suitable for operationalizing important global SD dimensions of bioenergy supply such as the socioeconomic convergence across different countries. Nevertheless, we argue that the indicators used in this letter are relevant for evaluating additional pressure on the energy-economy-climate system from additional constraints as represented in the models. As such, they supply important information from internally consistent model frameworks taking into account inter-sectoral and inter-regional interactions (von Stechow et al 2015 and SI section 1).
We provide this early contribution to a public debate on the relationship between the international climate policy and the SDG agendas based on existing multi-model scenario data that was not specifically developed for this particular purpose. This stimulus seems important because results from model inter-comparisons that are tailored towards the SDG-climate nexus will not be published for some years. Only by working with the available data can we start discussing relevant (risk) trade-offs and synergies. Based on our analysis, we argue that SD considerations are central for determining socially acceptable climate policies and that the prospects of meeting other SDGs need not dwindle and can even be enhanced for some goals if appropriate climate policy choices are made. Moreover, experiences and caveats of this analysis can help guide future research efforts at a relevant moment in time when new model comparison exercises are being designed. For example, to remain policy-relevant, SDG-focused multi-model comparisons will need to address inequality, poverty, and basic human needs as major drivers of the policy process much more adequately. This requires a serious discussion, e.g., on how to deal with the coarse regional disaggregation in the integrated modelling frameworks. Equally, successful efforts to address SDG-relevant issues in one model, e.g., for the analysis of water availability or ecosystem impacts (see SI section 2), will need to be lifted into a multi-model context.
5. Conclusion
Until now, no multi-model study has been used to systematically analyze the changes in SD risks implied by stringent mitigation scenarios and evaluate them across a set of SDGs. This letter addresses this research gap by analyzing a comprehensive set of alternative clusters of 2 °C pathways consistently formulated across many integrated models from the AMPERE model inter-comparison study, drawing on publicly available scenario results to calculate indicators for global SD risks. We shed light on the implications of alternative clusters of 2 °C pathways for meeting a set of energy-related SDGs and other sustainable energy objectives and to inform the public debate about the synergies and trade-offs across the international climate policy and the SDG agendas.
Our analysis shows that the near-term choice of 2 °C pathways has implications for the extent of synergies and trade-offs across energy-related SDGs in the medium term. Given current trends in emissions and technology deployment, we argue that mitigation pathways are likely to be characterized by multiple constraints. But adding limits on the availability of specific mitigation technologies on top of weak short-term climate policies decreases synergies and locks in substantial trade-offs across environmental and socioeconomic objectives. From an SDG perspective, the challenges of meeting other sustainable energy objectives substantially change with the way the climate SDG will be met. In some cases, meeting the 2 °C target is even threatened itself. Achieving low-energy demand growth, e.g., through aggressive energy efficiency improvements, helps to manage these trade-offs and attain multiple energy-related SDGs together. We find the greater the constraints on flexibility in meeting the 2 °C target, the higher the risks of not meeting other SDGs and the flexibility to manage these risks. Governments at all levels need to be informed about such implications of their collective decision for the attainability of global SDGs. This could avoid additional pressures on the sustainability of each region's development pathway.
After COP21, decision makers need to rethink their commitment to the SDG agenda, given that the short-term ambition for mitigation action falls short of the mitigation efforts consistent with staying below 2 °C in a cost-effective way. According to our results, this is likely to decrease co-benefits and increase the risks for attaining energy-related SDGs and other sustainable energy objectives. Since many of these SD risks are best dealt with at the global level, however, they might be good entry points into additional incentives for international cooperation. We suggest that the review of INDCs should provide for an assessment of policies at all scales to monitor global risks for non-climate sustainability objectives that arise from specific global mitigation pathways. Monitoring these risks could avoid unintended consequences (which might even delegitimize the 2 °C target), finding new entry points for global cooperation and providing rationales for ramping up mitigation ambition in the short to medium term.
Future research should extend the current system boundaries and, based on a comprehensive review of model literature on the climate-SDG nexus, establish indicators that help evaluate integrated policies addressing multiple SDGs in a unified framework. This would be a prerequisite for model inter-comparison projects with a focus on the interactions across multiple SDGs that could result in meaningful and robust results for better decision making. Climate policy will not be successful unless it seriously considers other policy objectives and therefore wider SD implications. Dividing the huge effort of achieving more sustainable development pathways into isolated policy problems will fall short of reaping synergies and successfully managing trade-offs across the many SDGs.
Acknowledgments
We are grateful to Ad-Willem Dashorst, Michael Jakob, Jan C Steckel, Nils Johnson, and Felix Creutzig for helpful comments on earlier versions of this manuscript. We acknowledge the work by integrated model teams that contributed to the AMPERE scenario database and thank IIASA for hosting the AMPERE scenario database. The AMPERE scenario work received funding from the European Union's Seventh Framework Programme (FP7/2007-2014) under grant agreement No. 265 139 (AMPERE). The research leading to this publication was supported by the German Federal Environment Agency (UBA) under UFOPLAN FKZ 3714 411 670 as well as the European Union's Horizon 2020 research and innovation programme under grant agreement No. 642 147 (CD-LINKS).
Footnotes
- 8
For example, CCS technology demonstration lags behind early IEA technology roadmaps (IEA 2009); nuclear power plant investments face high public acceptance challenges and even renewable energy (RE) investments are often opposed (Bruckner et al 2014). Unforeseen events or accidents (e.g., Fukushima) change risk perceptions of technologies (Rogers 1997, Patt and Weber 2014) making the analysis of limited mitigation technology portfolios interesting and relevant. To avoid unavailability of specific technologies, complementary technology policies (Somanathan et al 2014) could reduce additional costs (Kalkuhl et al 2013, Bertram et al 2015b) and ensure innovation activity, such as for CCS (von Stechow et al 2011) or PV (Peters et al 2012).
- 9
- 10