

Abstract
The developed world has pledged to mobilize at least US $100 billion per year of 'new' and 'additional' funds by 2020 to help the developing world respond to climate change. Tracking this finance is particularly problematic for climate change adaptation, as there is no clear definition of what separates adaptation aid from standard development aid. Here we use a historical database of overseas development assistance projects to test the effect of different accounting assumptions on the delivery of adaptation finance to the developing countries of Oceania, using machine algorithms developed from a manual pilot study. The results show that explicit adaptation finance grew to 3%–4% of all development aid to Oceania by the 2008–2012 period, but that total adaptation finance could be as high as 37% of all aid, depending on potentially politically motivated assumptions about what counts as adaptation. There was also an uneven distribution of adaptation aid between countries facing similar challenges like Kiribati, the Marshall Islands, and the Federated States of Micronesia. The analysis indicates that data allowing individual projects to be weighted by their climate change relevance is needed. A robust and mandatory metadata system for all aid projects would allow multilateral aid agencies and independent third parties to perform their own analyses using different assumptions and definitions, and serve as a key check on international climate aid promises.
Export citation and abstract BibTeX RIS

Original content from this work may be used under the terms of the Creative Commons Attribution 3.0 licence. Any further distribution of this work must maintain attribution to the author(s) and the title of the work, journal citation and DOI.
Introduction
A core tenet of international climate policy, since the creation of the United Nations Framework on Climate Change (UNFCCC) in 1992, has been that the developed world, which is largely responsible for greenhouse gas emissions, will assist the developing world in adapting to climate change. The cost of adapting to climate change in the developing world over the next few decades has been estimated at up to or over $100 billion yr−1 (Parry 2009, World Bank 2010), although there are questions about the reliability of such estimates (Fankhauser 2010). Yet adaptation in the developing world to date is thought to represent only a small fraction of total climate financing. By one estimate, only 10%–12% of the global public and private finance in 2012 and 2013 flowed from developed countries to developing countries, and only 1% supported adaptation in developing countries (Buchner et al 2014).
In Cancun in 2010, the developed country parties to the UNFCCC agreed to mobilize climate financing of US $100 billion yr−1 by the year 2020 to assist the developing world in responding to climate change, including both adaptation and mitigation. In order to not jeopardize other development efforts, the targeted $100 billion yr−1 in climate aid is expected by the UNFCCC to be 'new' and 'additional' to development aid (Donner et al 2011). However, even after the Paris Climate Agreement, there is no clear agreement on what classifies as climate aid, on the expected baseline trajectory of development aid, or on what separates climate projects from development projects. As it stands, recommended and pledged baseline levels of development aid are rarely being met (Ayers and Huq 2009); in 2013 only 5 of the 28 member countries of the Organisation for Economic Co-operation and Development (OECD) met their 0.7% of GNP in official development assistance target (OECD 2015a).
Reports on climate finance repeatedly warn that the question of what counts as 'climate aid' remains unresolved (Buchner et al 2011, Donner et al 2011, UNFCCC 2014). This is not surprising because international climate finance is a complicated ecosystem with many providers and intermediaries, each using their own definition of climate aid. For example, the countries who provided the $35 billion in initial fast start financing (FSF) over the 2010–2012 period each employed their own method to define whether aid was new and additional (Brown et al 2010, Stadelmann et al 2011, Nakhooda et al 2013), and even used different methods in reporting to different bodies (Haites 2014). The UNFCCC itself concluded that depending on the method of analysis 'virtually none' to 'almost all' of the FSF could be considered additional (UNFCCC 2014). For these reasons, accurately tracking climate finance to the developing world has proven to be difficult. The 2013–2014 climate finance estimates released by the OECD in advance of the Paris climate summit (OECD 2015b) were strongly challenged; the Government of India argued that confirmed climate finance flows to the developing world were only 4% of the reported total (Dasgupta et al 2015).
Tracking climate finance transfers is a particular challenge for climate change adaptation. Accounting of adaptation finance depends heavily on assumptions about what counts as adaptation, which some argue is more difficult than mitigation to clearly separate from other development efforts (Buchner et al 2011), and reflects a long-standing debate about whether adaptation can be distinct from development (Pickering et al 2015). Unlike carbon mitigation, for which the UNFCCC has experience with defining counterfactuals to quantify additionality for clean development mechanism (CDM) projects (Schneider 2009), there are no existing 'bright lines' to distinguish between adaptation and development aid. An aid-funded project to replace a broken water reticulation system in a country that happens to be threatened by groundwater salinization from sea-level rise may not be seen as an 'adaptation' project by some donors or by the recipients. The labelling is complicated further by political incentives; development institutions, for example, are competing to demonstrate their capacity to implement climate change adaptation in order to secure donor funds and to grow in the climate finance market (Webber 2015). The Rio Markers in the OECD's Creditor Reporting System (CRS) require donors to indicate if an aid project contributes 'principally' or 'significantly' to climate change mitigation or adaptation. Yet independent analyses have suggested the system is rife with inconsistencies and over-reporting of adaptation aid due to unclear definitions and political motivation in the coding done by donor institutions (Michaelowa and Michaelowa 2011, Junghans and Harmeling 2012, Adaptation Watch 2015).
The answers to such dilemmas have real-world consequences on the delivery and efficacy of development and adaptation aid. The categorization of aid can determine the priorities and outcomes of a country's development or adaptation budget with significant impacts on their ability to develop or adapt (Ayers and Huq 2009). Without a transparent and independent system to track and measure adaptation funding, climate finance accounting practices could skew funding amounts and practices towards adaptation at the expense of other development needs by influencing the priorities of governments and aid institutions as well as the selection and design of individual aid projects (Michaelowa and Michaelowa 2011).
This work assesses the impact of accounting assumptions on climate adaptation 'aid' using Aiddata 3.0, the most comprehensive available global database of bilateral and multilateral overseas development assistance projects (Tierney 2011). The focus is the small island developing states (SIDS) of Oceania, which includes 19 independent nations and trust territories. Quantifying how assumptions about adaptation map onto actual aid flows is especially important to SIDS, which are highly vulnerable to climate change and often serve as a testing ground for climate change adaptation initiatives (Donner and Webber 2014). We present the estimated adaptation aid flows to the region as a whole, and then disaggregated by recipient and by donor, under different accounting assumptions. Based on these findings, we then discuss the need for more robust project-level metadata, so that aid agencies, recipients and third parties can score projects based on their relevance to climate change, and properly monitor international climate aid promises.
Materials and methods
Each of the 30 794 Oceania overseas development assistance projects from 1992 through 2012 in Aiddata 3.0 was classified via machine-coding into five categories: (i) 'explicit' adaptation, (ii) 'implicit' adaptation, (iii) mitigation, (iv) not climate-related or (v) indeterminate based on the information available in the database. Categorizations were based on project descriptions and the pre-assigned OECD CRS project purpose codes that indicate the sector and general purpose of a given project (e.g., basic health infrastructure, early childhood education). The implicit category embraces the wider range of activities which can reduce societal vulnerability to external stresses like climate events (e.g., capacity building), but may not be explicitly designed to adapt to a particular range of projected climate outcomes (e.g., building coastal protective measures to a set height). The multi-step machine coding algorithm was developed and validated based on an iterative manual pilot study conducted using three observers and one year's worth of data, representing 6.5% of the total records (see Methods in supplementary data for details). The existing 'climate' category in Aiddata, which is based partly on the Rio Markers system, was intentionally excluded from the pilot study and the classification algorithm in order to serve as an independent dataset for comparison. The machine coding approach enabled a controlled test of the effect of different accounting assumptions on estimate of climate finance.
The algorithm classified projects that included the terms 'climate' or 'adaptation' in English or French in the title or short or long description as explicit adaptation. Second, if a project was not explicit adaptation, a coding matrix (see supplementary data) based on the OECD CRS purpose code listed in Aiddata identified projects as mitigation (e.g., purpose code 'ocean power'), indeterminate (e.g., education policy and admin. management) or not climate-related (e.g., air transport). Third, in order to test the effect of accounting assumptions on implicit adaptation aid flows, three different adaptation classification schemes were employed: (i) a low assumption that includes projects with purpose codes directly linked to the physical environment, like coastal and water resource protection with an unambiguous climate link (e.g., purpose code is 'water resource protection'), (ii) a medium assumption, that in addition to projects included in the low scenario, also includes projects that could help communities develop capacity to adapt to climate change (e.g., also includes purpose code 'water resources policy'), (iii) a high assumption, that also includes any other projects that fall within the broad sectoral categories (e.g., coastal and water resources) used in the national adaptation programmes of action (NAPA) reports prepared by least developed countries to identify and prioritize urgent adaptation needs, following Article 4.9 of the UNFCCC. Remaining projects were classified as not climate-related.
There was agreement between the algorithm and manual observers for >99.6% of the explicit projects and 82.7%–86.1%, 77.6%–80.1%, 56.4%–58.7% of the implicit projects under the low, medium and high assumptions respectively (see supplementary data). By definition, there is no correct answer for the number of implicit projects; the different levels of agreement with manual labelling of implicit project indicates that the classification schemes become progressively more inclusive and uncertain from low to high as intended. The nature of the CRS codes can lead to mislabelling of projects as adaptation (e.g. some 'water resources protection' projects could be maladaptive). Nevertheless, the use of three different classification schemes presents a set of plausible accounting procedures for demarcating projects that contribute to climate change adaptation. Rather than produce a definitive estimate of adaptation finance to Oceania, this approach allows us to test how different coarse accounting methods, like the reported 'greenwashing' in OECD reports (Dasgupta et al 2015), influence estimates of adaptation finance. Annual aid flows (reported in 2011 US dollars) were computed for each category as well as donor and recipient, based on individual project commitments, with new financing assigned to the year of the award.
Results
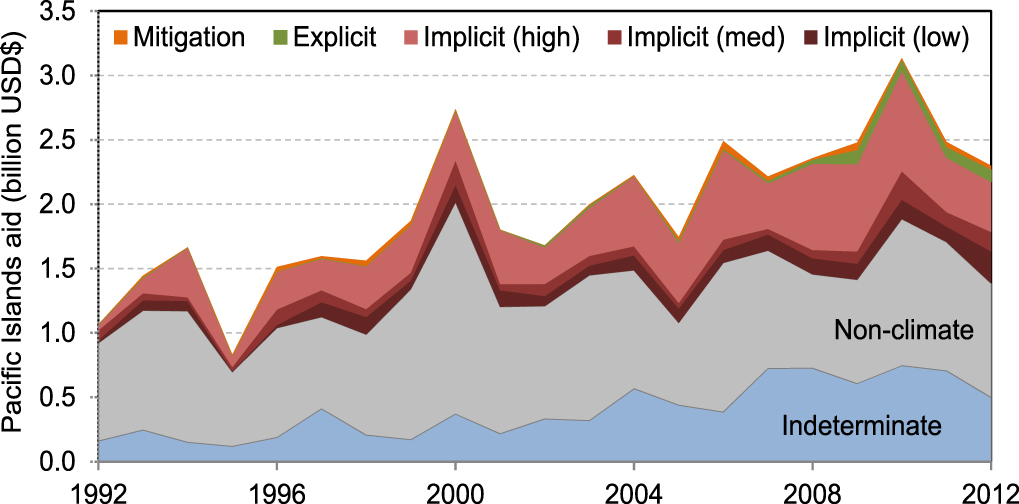
Explicit adaptation aid to the SIDS in Oceania was a small portion (<1%) of total aid flows until the mid-2000s and was limited to specific bilateral projects and UNFCCC programs (figure 1). Total explicit adaptation funding grew in the mid-2000s, and since has remained relatively stable at 3%–4% of all aid flows by the end of the Aiddata record in 2012 (figure 2). Over 2008–2012, explicit adaptation funds averaged 79.7 million USD/year or 8 USD per person in the recipient countries.

Figure 1. Total overseas development assistance (ODA) to Oceania from 1992 to 2012. The chart shows total ODA to the Pacific Islands classified as explicit adaptation, mitigation, implicit adaptation (low, medium and high scenarios), not climate-related or indeterminate based on the analysis in this study. All values are based on 2011 USD.
Download figure:
Standard image High-resolution image
Figure 2. Breakdown of overseas development assistance (ODA) to Oceania for the (a) 1992–1996, (b) 2000–2004, and (c) 2008–2012 periods into ODA explicit adaptation, mitigation, implicit adaptation (low, medium and high scenarios), not climate-related or indeterminate based on the analysis in this study. The size of the pie charts is relative to the total ODA during that period: 1.3 billion yr−1 in 1992–96, 2.1 billion yr−1 in 2000–2004, 2.6 billion in 2008–2012. All values are based on 2011 USD.
Download figure:
Standard image High-resolution image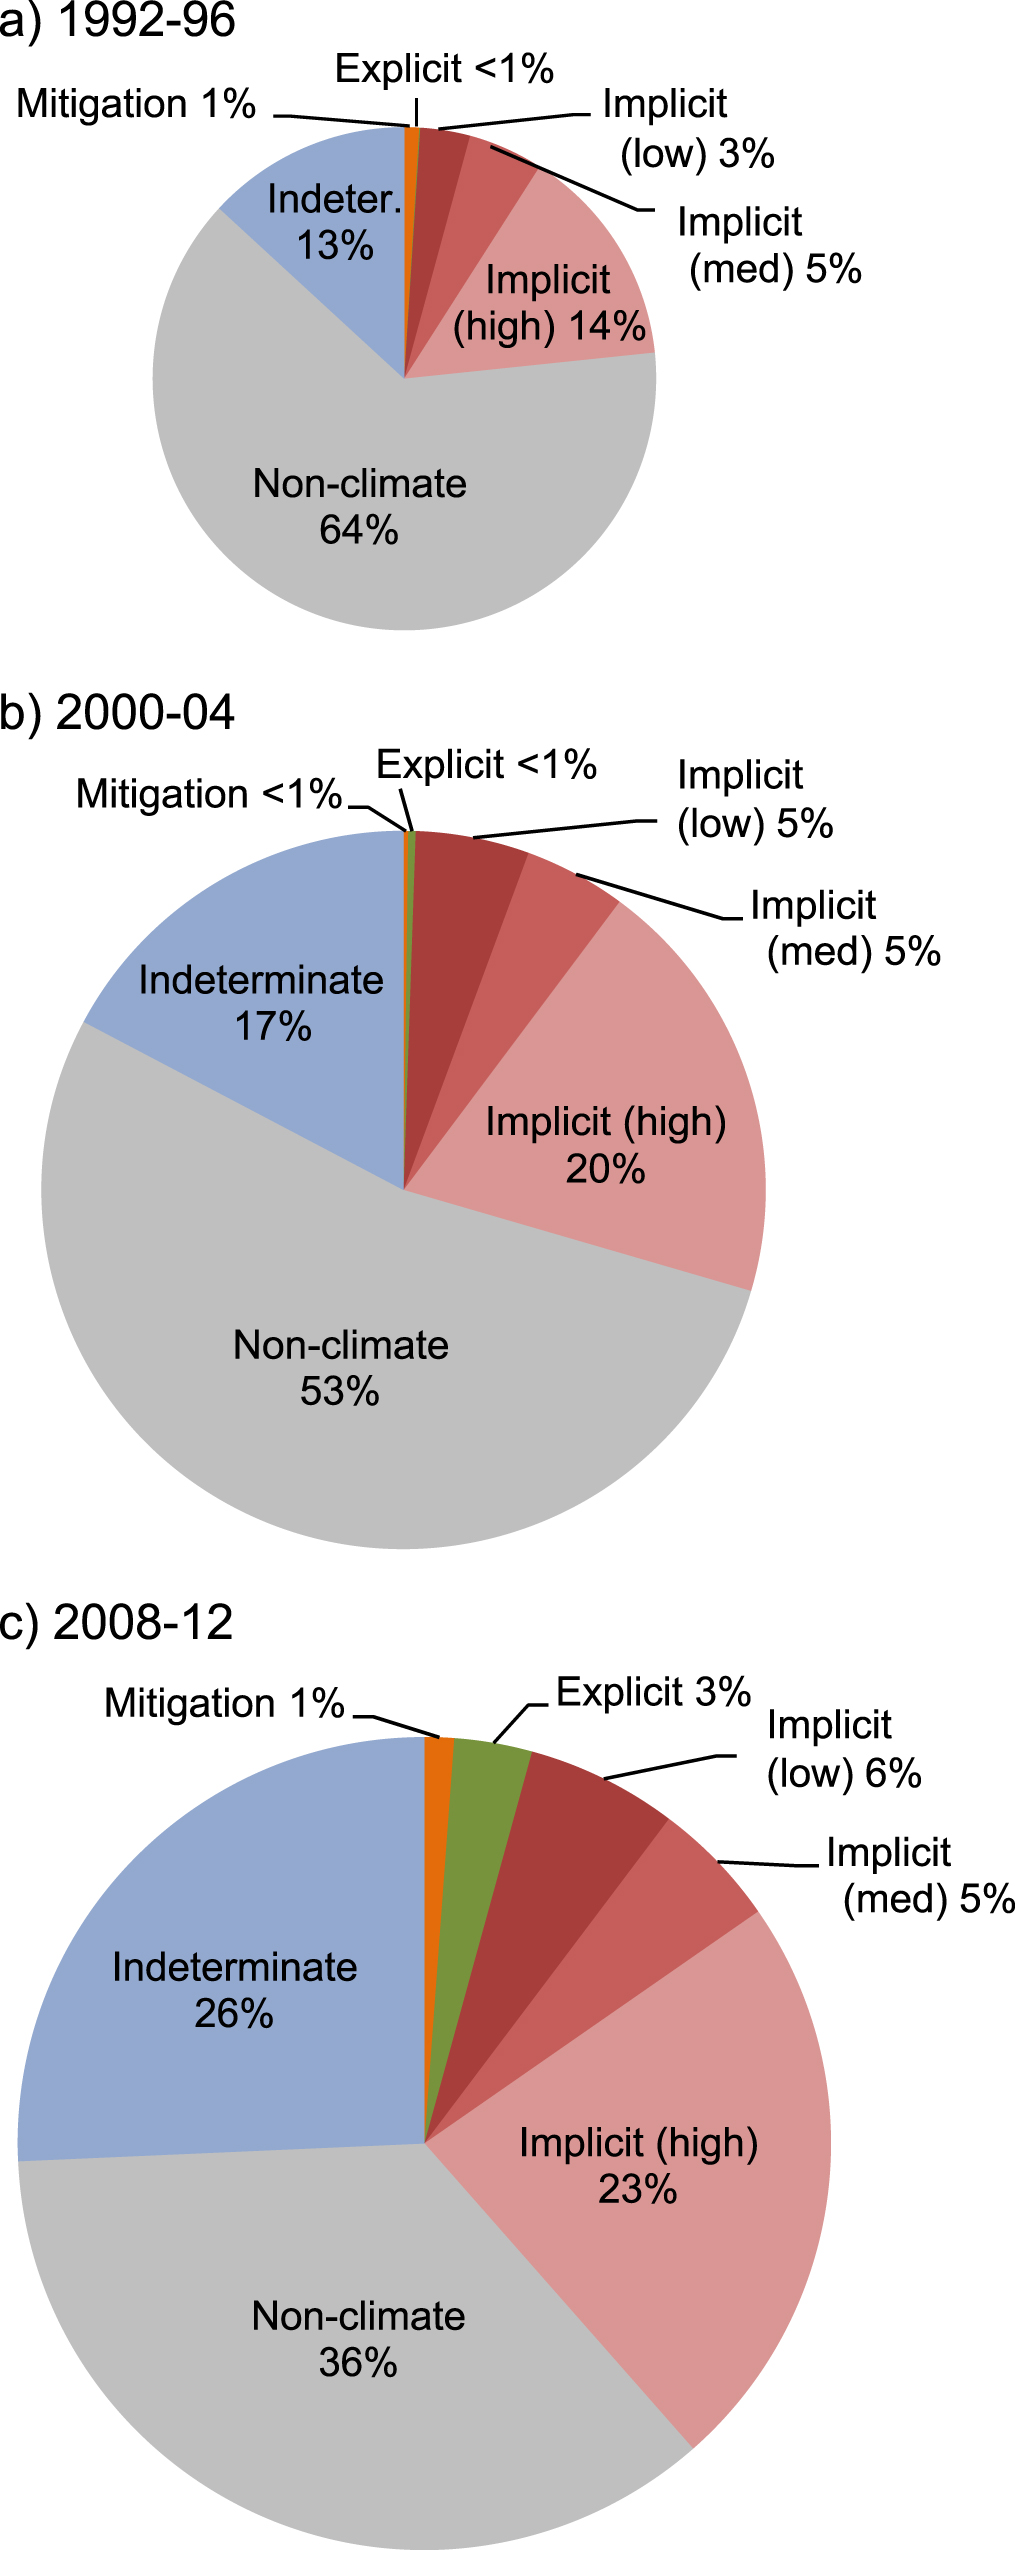
Overall, implicit adaptation was up to an order of magnitude greater than explicit adaptation funding, depending on the classification scheme. Under the low assumption, implicit adaptation was 5% (inter-annual range of 1%–11%) of annual aid flows to Oceania between 1992 and 2012. This increased to 10% (9%–17% range) of annual aid flows using the medium assumption, and 30% (13%–37% range) of annual aid flows using the high assumption based on the NAPA categories (figure 1). Implicit adaptation funding grew faster than total aid flows to the region; total aid flows doubled from the 1992–1996 to the 2008–2012 period, but implicit adaptation flows more than tripled in two of the three classification schemes (figure 2).
The large differences between the explicit and implicit adaptation aid flows and between different estimates of implicit flows highlights that the estimates of adaptation financing depends heavily on definitions and on the classification system. This is illustrated further by comparing the results to estimates of adaptation aid to Oceania from other datasets (table 2). Explicit adaptation flows for 2010–2012 are >50% higher than aid flows with the 'principal' objective of climate change adaptation according to the OECD Rio Markers. If aid 'significantly' related to climate change adaptation is included, the OECD total is more than twice the explicit total in this study. This discrepancy indicates that the Rio Markers are classifying many projects as 'significantly' related to climate change adaptation despite having titles and project descriptions which do not mention climate or adaptation, as is required in this analysis.
Similarly, the total climate aid flows to Oceania for 2010–12 using the existing 'climate' categorization in Aiddata, which is based on the OECD data and machine coding and includes both adaptation and mitigation, is one-third of the explicit total here (table 2). The discrepancy in this case is also due in part to basic classification procedures. For example, projects with the word 'adaptation,' but not 'climate,' in the title or description—like the Kiribati Adaptation Project, a landmark World Bank-managed climate change adaptation project—do not register as climate adaptation in Aiddata's existing system.
Not climate-related financing comprised the majority of aid flows, even in the high implicit adaptation assumption, until the mid-2000s. While total aid continued to grow after the mid-2000s, not climate-related financing amounts remained steady, decreasing as a fraction of total aid. Roughly a quarter of records were classified as indeterminate throughout the record, and the proportion of such records grew over time. This indicates information on these projects was so lacking that they could not be classified as either implicit adaptation, mitigation or not climate-related based on the project purpose codes. The large fraction of indeterminate projects provides a further demonstration of how estimates of adaptation financing are limited by the information available in databases.
Distribution of climate adaptation finance in recipient countries
The majority (64%) of explicit adaptation funding from 2008 to 2012 went to projects labelled as regional in the database, which on average were 3.5 times as large as individual country projects (table 1). In contrast, only 15% of overall aid flows from 2008 to 2012 went to regional projects, indicating that explicit adaptation projects tend to be regional whereas other aid projects tend to be country-specific. Nevertheless, there was a large range between countries in total and in per capita adaptation funding (table 1). The countries with small populations tended to receive more total aid and more adaptation aid per capita; Niue (1190 people), Tokelau (1137 people), and Tuvalu (10 782 people) received $430 person, $234/person and $118/person in explicit adaptation funding from 2008 to 2012. Countries which could be more vulnerable to climate change than predicted by their economic status, according to the ND-GAIN GDP-adjusted climate change vulnerability index (although, see Barnett et al 2008), received an order of magnitude more explicit adaptation funding per capita ($23.93 per person) than other countries in the region ($2.18 per person).
Table 1. Estimated aid flows by recipient nations, 2008–2012.
| Adaptation aidb | ||||||||
|---|---|---|---|---|---|---|---|---|
| Total aid | Explicit | + med. implicit | ||||||
| Countrya | Population | US$ mil | $ per person | US$ mil | $ per person | US$ mil | $ per person | ND-GAIN indexc |
| Regional projects | 958 5804 | 391.1 | 40.8 | 51.2 | 5.3 | 87.3 | 9.1 | — |
| Cook Islands | 10 134 | 27.2 | 2,682.0 | 0.5 | 53.0 | 5.3 | 520.6 | — |
| Fiji | 903 207 | 110.8 | 122.7 | 1.1 | 1.2 | 17.8 | 19.7 | 0.05 |
| Kiribati | 104 488 | 78.3 | 749.5 | 4.5 | 42.8 | 21.1 | 202.0 | −1.56 |
| Marshall Islands | 70 983 | 89.8 | 1,264.5 | 0.6 | 8.0 | 4.9 | 68.7 | −1.51 |
| Micronesia (FSM) | 105 681 | 130.8 | 1,237.9 | 0.8 | 7.5 | 3.1 | 28.9 | −1.51 |
| Nauru | 9488 | 32.9 | 3,464.5 | 0.3 | 33.0 | 1.8 | 191.7 | −1.93 |
| Niue | 1190 | 16.3 | 13,734.0 | 0.5 | 430.2 | 1.0 | 808.4 | — |
| Palau | 21 186 | 42.3 | 1,998.5 | 0.3 | 14.5 | 2.5 | 118.8 | −1.41 |
| Papua New Guinea | 655 2730 | 783.8 | 119.6 | 3.8 | 0.6 | 87.0 | 13.3 | 0.10 |
| Samoa | 196 628 | 103.2 | 524.9 | 5.3 | 27.0 | 32.8 | 166.7 | 0.06 |
| Solomon Islands | 609 883 | 351.6 | 576.4 | 5.4 | 8.9 | 29.9 | 49.0 | 0.12 |
| Tokelau | 1137 | 21.7 | 19,077.5 | 0.3 | 233.7 | 3.9 | 3424.4 | — |
| Tonga | 106 440 | 82.9 | 778.7 | 1.3 | 12.2 | 15.6 | 146.2 | 0.03 |
| Tuvalu | 10 782 | 28.6 | 2,648.8 | 1.3 | 117.9 | 7.7 | 717.3 | −1.51 |
| Vanuatu | 266 937 | 129.5 | 485.1 | 1.9 | 7.2 | 37.1 | 139.0 | 0.04 |
| Wallis and Futuna | 15 561 | 130.1 | 8,358.4 | — | 0.0 | 3.4 | 216.5 | — |
| Total | 958 5804 | 2550.8 | 266.1 | 79.7 | 8.3 | 361.9 | 37.8 | — |
aPopulation based on most recent available national data (2011–2014), available in CIA World Factbook; New Caledonia, French Polynesia and Northern Marianas Islands received no explicit aid and are excluded from table. bSee supplementary table 3 for low and high scenarios. cGDP-adjusted climate change vulnerability index for 2008–2012 (negative value = more vulnerable than predicted by GDP), available at http://index.gain.org.
There is some evidence of an uneven distribution of adaptation aid between countries with similar levels of vulnerability, although the pattern may also be due to the higher marginal cost of implementing projects in the smaller and more physically isolated nations. For example, Samoa received five times as much total explicit adaptation funding as neighbouring Fiji, which has similar GDP per capita and close to five times the population but experienced a cut in international aid after a 2006 coup (table 1). Moreover, there was a six-fold range in explicit adaptation funding, and a minimum two-fold range in implicit adaptation funding, between Tonga, the Federated States of Micronesia, and Kiribati despite the nations' having similar sized populations and receiving similar total international aid.
Distribution of climate adaptation finance from donor countries
The majority of adaptation aid flows in Aiddata 3.0 (80% of explicit, 80%–89% of explicit and implicit for 2008–2012) are bilateral, flowing from government agencies in the developed world to the Pacific Islands. The remainder of the aid flows originate with multilateral funds, UN institutions and the multi-lateral development banks. These totals, however, can be misleading, as some of the bilateral aid is delivered to the recipient country through multilateral organizations like the World Bank or Asian Development Bank.
Australia was the largest source of explicit adaptation aid for the 2008–2012 period (54%) followed by the Global Environment Facility (11%), Germany (9%), the European Community (9%), and Canada (7%) (see supplementary data). Identification of the primary contributors of adaptation funding, however, depends on the definition of implicit. For example, while Australia is by far the largest contributor to aid under both explicit and implicit scenarios, if the implicit funds are included, Japan may be responsible for as much as 25% of adaptation flows. Similarly, the fraction of an agency's or country's aid classified as adaptation depends heavily on definition of implicit adaptation. Adaptation aid could be anywhere from 3%–43% of all Australian aid and 0%–68% of Japanese aid to the region for the 2008–2012 period.
Discussion
The lack of a clear definition of activities that count as adaptation and the limited or inconsistent level of detail on aid projects in available databases constrain the ability to measure either all or 'additional' adaptation finance. Projects that explicitly aim to adapt to impacts of climate change may best fit the standard categorization of adaptation. Yet even in Oceania, where the present and future vulnerability to climate change is well-documented, such projects still comprised only 3%–4% of aid flows from 2008 to 2012. At the same time, many studies have concluded that it is vital to mainstream climate change adaptation into broader development efforts (e.g., Huq and Reid 2004, Klein et al 2007). Mainstreaming is especially important in SIDS where the capacity and expertise needed to manage an explicit adaptation project is limited (Jones et al 2012), and where climate change is one of several stressors affecting livelihoods and wellbeing (McCubbin et al 2015). Such broader development projects aimed at strengthening livelihoods, which can in turn reduce vulnerability to climate change and enhance adaptive capacity, may not be classified as adaptation projects under existing classification methods like the OECD Rio Markers.
Without an adaptation finance tracking system that accounts for such 'implicit' or vulnerability-centred projects, there may be political pressure for donors and recipients to create projects that can clearly be labelled as explicitly 'climate' aid, regardless of whether it is the most efficient use of resources to build resilience in the recipient country. The results of this study corroborate the charges of 'rampant mis-categorization' of aid as significantly related to adaptation by the Rio Markers (Adaptation Watch 2015). They also demonstrate how a broad interpretation of implicit adaptation aid, like the 'high assumption' employed here, could contribute to inflating accounts of climate finance by donor institutions (Dasgupta et al 2015). The inverse can also happen; some donors may intentionally not label aid that contributes to adaptation as 'climate' because of internal politics surrounding climate change. Furthermore, the demand to demonstrate that aid clearly contributes to climate change adaptation could also lead to funding being concentrated in regions or countries where the threat of climate change has been popularized. Donors and aid recipients may fall into the trap, common throughout the history of international development, of international priorities rather than local needs influencing aid priorities.
These politics of climate aid accounting may explain why the atoll country of Kiribati, a least developed country which has become an international 'poster child' for climate change vulnerability (Donner 2015), received eight times more explicit adaptation financing and five times more per capita than the neighbouring and similarly threatened Republic of the Marshall Islands (RMI). However, such disparities decrease if implicit adaptation aid is considered; with the high assumption, Kiribati receives 60%, not 500%, more adaptation funding per capita than the RMI. The sensitivity of relative adaptation financing to different recipient countries points to the geopolitical ramifications of methods of defining and tracking adaptation finance. It is no surprise that numerous reports from international organizations involved in climate finance have called for the development of common reporting and assessment methods (e.g., UNFCCC 2014).
A new system for tracking adaptation finance
How might we develop an accounting system for verifying whether funding targets are being met in a more honest and effective way? The system must account for the degree to which a new project contributes to climate change adaptation and is 'additional' to some projected baseline level of development aid. Although insisting on 'additionality' may pose challenges for integrating adaptation and development programs without duplicating administrative and governance efforts, it is crucial given the long history of new aid priorities detracting from funding for outstanding development challenges and that existing markers for development aid are already not being met. The system must also contain checks and balances to control against bias in the labelling of projects and aid as adaptation.
A solution to mediating the subjectivity of the project-level labelling and to addressing information gaps noted in our analysis may be to develop a more robust and mandatory metadata system for all aid projects. The provision of project metadata that stretches beyond the limited descriptions and broad categories in existing databases to include detailed project summaries, itemized budgets, georeferencing (Adaptation Watch 2015), institutional contacts and other information vital to monitoring and evaluation would help control against biases in labelling and help address the discrepancies between different estimates of adaptation aid (table 2). Without more detailed information available, there is a substantial risk of 'false positives'—non-adaptation projects being labelled adaptation projects—because the limited available information necessitated a simple coding scheme (e.g. the use of CRS codes in this study) and/or was unintentionally, or intentionally, misleading. More robust metadata is particularly valuable given that aid is increasingly being delivered as undefined general budget support rather than as funding for specific projects with clear goals (Brown et al 2010); this trend explains the large fraction of indeterminate projects in this study. If sufficiently detailed project-level metadata were publicly available through a clearinghouse like Aiddata 3.0 or the UNFCCC, then multilateral aid agencies and independent third parties could perform their own analyses using different assumptions and definitions as recommended in recent reports (e.g. Adaptation Watch 2015).
Table 2. Comparison of estimates of adaptation aid to Oceania, 2010–2012a.
| Year | Explicit | OECD 'principally' adaptation | Aiddata 'principally' climate change | OECD all adaptation | Aiddata all climate | Implicit |
|---|---|---|---|---|---|---|
| 2010 | 83.0 | 34.0 | 33.4 | 71.3 | 121.6 | 232.6–1239.0 |
| 2011 | 81.0 | 75.9 | 21.7 | 224.4 | 147.7 | 200.4–738.5 |
| 2012 | 93.8 | 53.8 | 31.4 | 277.3 | 198.9 | 342.4–884.5 |
| Average | 85.9 | 54.6 | 28.8 | 191.0 | 156.1 | 258.5–954.0 |
A robust metadata system for classifying projects could separate the more implicit 'vulnerability-centred adaptation' from the more explicit 'climate change adaptation' (Dupuis and Knoepfel 2013) and help address the question of what activities count as climate change adaptation (and mitigation) at the project level. Notably, metadata can be used to develop a weighting system for the climate change-related relevance of a project, as well as the sector and type of activity. A zero to 100% adaptation weighing system would avoid the conflict inherent in the existing binary coding methods, including that employed in this study, and allow an appropriate fraction of the funding for each implicit or vulnerability-centred projects is included in estimates of adaptation aid. It would also particularly help classify aid delivered via large umbrella projects and general budget support.
An effective model for both weighting projects by climate relevance and assessing the trajectory of climate spending is the country-level Climate Public Expenditure and Institutional Review (CPEIR) process developed by the Overseas Development Institute (Jones et al 2012) that has been piloted in some Asia-Pacific countries, including Samoa (ODI 2013). In this intensive process, outside agencies (e.g. U.N. Development Program) work collaboratively with multiple branches of a national government to determine government and donor expenditures of high (assigned a weight of 80%), medium (50%) and low (20%) relevance to climate change. The Samoa CPEIR demonstrates the value of a system that weights projects not explicitly related to climate change; that review estimated adaptation funding to be 15% of total external aid for 2008–2012, three times the explicit funding in this study and similar to the sum of the explicit and low implicit funding.
Such a coordinated and detailed assessment, however, is not currently feasible at the regional or global scale because of the limited information available in international aid databases. A test of the CPEIR weighting method that we conducted in conjunction with our manual pilot study found that the 86% of the project records (n = 670), representing 79% of the aid flow, did not feature sufficient information to assign a weight for climate change relevance (see supplementary data section 4 for details). The estimated adaptation funding based on the remaining records was 53% higher than the explicit and low implicit funding computed using this study's method, which further confirms the importance of considering implicit projects in estimates of adaptation aid. A robust metadata system for all aid projects would help ensure that a comprehensive weighting process is plausible and, importantly, consistent across different countries.
With project weights estimated from a metadata system, it may be possible for additionality to be determined at the national level based on aggregated data and trends in aid flows computed from project-level data. The difficulties in defining baselines for identifying what is additional aid are well known (Powell 2003) and commonly encountered in quantifying carbon emissions credits under the CDM (e.g. Michaelowa and Purohit 2007). The CDM experience has been the subject of extensive scrutiny (Schneider 2009) and some of the lessons, specifically those related to the need for flexibility in setting baselines across sectors, could be transferred to the design of adaptation aid. If sufficient metadata were available, rather than settle on one accounting of climate finance from the OECD and/or donors, third parties—whether academics, non-governmental organizations, or UN organizations—would be able to independently assess whether the pledged adaptation financing is being provided and not detracting from other development aid. This is critical to building trust between donors and recipients, and eliminating concerns that the development institutions are 'setting up incentives for agencies to game the system' (Dasgupta et al 2015).
The template for project metadata could be developed by querying the needs of expected users, who will range from officials at development banks to finance officers in SIDS to academics. The recent UNFCCC biennial assessment of climate finance recommended inviting experts and institutions involved in climate finance to suggest ways to develop a common reporting method, especially for adaptation (UNFCC 2014). To avoid increasing the bureaucratic demands in recipient nations, where institutional capacity to manage climate finance may be limited, donors could be charged with completing the initial universal project metadata forms. Final approval of the forms before final budget authorization could still lie with the recipients, in order to minimize misreporting. The new three-step method used by the multilateral development banks to track what proportion of individual projects address documented climate vulnerability (MDBs 2014) shows the value of the experienced and well-supported donor organizations doing initial categorization of projects but also making robust metadata available so it can be assessed by recipients and third-parties.
Given the decentralized nature of climate finance, a solution might be for the UNFCCC to lead the development of a metadata reporting system and database, but also to establish a rotating cross-institutional analytical team including representatives from NGOs, development banks and academia. Such a system could help hold parties responsible for the pledge to provide new and additional funding and help build the trust among between the governments, institutions and the public in both donor and recipient countries. In the long run, it could serve a role akin to 'sunshine laws' regarding government transparency, ensuring that adaptation funding is targeted where it is most needed and can be most effective, rather than where it best suits a political or accounting goal.
Acknowledgments
This research was funded by the UBC Hampton Research Endowment Fund. We thank Aiddata 3.0 for providing the core data for this study, and to M Beamish and F Hasanain for assistance with the data analysis.