
Abstract
We studied the interannual variation of late summer snow covered area (SCA), i.e. snowbeds and permanent snow patches, in northern Finland and analyzed the role of topographical factors and climatic conditions on the recent and future occurrence of summer snow. SCA for the years 2000, 2004, 2006 and 2009 was derived from Landsat images using a normalized difference snow index (NDSI). Late summer SCA varied notably between the years (1.5–23.0 km2). A major part of the late summer snow was located above 900–1000 m and on northern and eastern slopes. A generalized additive model (GAM) showed that the number of years with snow present in 1 km grid squares was strongly positively related to altitude and terrain ruggedness. Parallel examination of interannual variation of SCA and climatic conditions showed that snow cover declines were linked to relatively low snowfall-to-rainfall ratios. Annual mean air temperatures, particularly spring and early winter temperatures, showed increasing trends during the study period. Projected increases in air temperatures and rainfall suggest earlier and more efficient snow melt in the future. This may threaten the occurrence of species and communities related to snowbeds and decrease the β-diversity of the landscape, and could also affect ecosystem services of the region.
Export citation and abstract BibTeX RIS

Content from this work may be used under the terms of the Creative Commons Attribution-NonCommercial-ShareAlike 3.0 licence. Any further distribution of this work must maintain attribution to the author(s) and the title of the work, journal citation and DOI.
1. Introduction
Long-lasting snow cover is a prominent feature of high-latitude environments. Snow cover has a major impact on climate, hydrology and ecological systems, as it regulates surface energy and water balance, thermal regimes, biogeochemical processes and vegetation (Callaghan et al 2011a). High-latitude ecosystems are predicted to be the most affected by global change (IPCC 2007). Warming climate and changes in precipitation regimes alter the spatial and temporal extent of snow cover, which threatens the existence of species directly dependent on snow, but also those dependent on moist microhabitats at high altitudes (Björk and Molau 2007).
Land-surface air temperatures in the Arctic have increased by approximately 0.4 °C/decade since the mid-1960s (ACIA 2005), and the highest Arctic temperatures of the instrumental records have been measured during the past decade (Kaufman et al 2009, Walsh et al 2011). The warm season is generally lengthening, as recent observations and climate models indicate a shorter frost season and fewer days with frost (Jylhä et al 2008). Arctic precipitation shows considerable interannual and regional variability, with no statistically significant trends during recent decades (ACIA 2005, Walsh et al 2011). Snow amounts are predicted to increase in the coldest regions in the northern hemisphere, whereas a decreased fraction of solid precipitation and more efficient melting will reduce snow amounts elsewhere (Räisänen 2008). There have been long-term increases in snow depths in northern Scandinavia and Eurasia, but decreases in snow cover have been recorded since the 1980s (Callaghan et al 2011b).
Local variations in the duration and depth of snow cover at high latitudes are related to precipitation, wind conditions, temperatures below 0 °C and topography. Snow controls microclimate and plant growing conditions, and variations in snow cover are thus reflected in the distribution and composition of vegetation (Evans et al 1989). Snow cover insulates vegetation against low air temperatures and high temperature fluctuations, and protects it from physical damage in winter (Bokhorst et al 2009). In summer, snowbeds and (semi)permanent snow patches can exist in locations where large amounts of snow accumulate in winter and thaw slowly during the warm period (Billings and Bliss 1959, Walker et al 2001). Summertime snow packs regulate the start and the length of the growing season and influence hydrological conditions by providing a local source of water (Galen and Stanton 1995). These harsh environmental conditions sustain specialized plant communities, consisting of chinophilic vascular plants, bryophytes and lichens (Walker et al 2001).
Climate change poses a serious threat to snow habitats (Björk and Molau 2007). In Finland, most of the snowbeds have been classified as near-threatened or vulnerable habitat types, and persisting snow patches as endangered habitats (Norokorpi et al 2008). Despite snowbeds and snow patches are a crucial component of arctic and alpine ecosystems, their spatial distribution and interannual variation have not earlier been studied at high latitudes and over wide geographical regions (see however Watson et al 1994, Green and Pickering 2009). We studied recent spatiotemporal changes in the distribution of late summer snow covered area (SCA) in Enontekiö Lapland, northwestern Finland using Landsat TM and ETM+ data. Most of the late summer snowbeds and snow patches of the whole country are located in this region.
Specifically, the aims were:
- (1)To study interannual variation in late summer SCA in 2000–9.
- (2)To analyze topographical factors affecting late summer snow occurrence in the landscape.
- (3)To relate recent climate variations and future projections to late summer SCA.
2. Study area
The study area was located in Enontekiö Lapland, northern Finland between 20.55–22.40°E and 68.50–69.35°N and covered 3176.5 km2 (figure 1). The high fells in the northern part of the region are part of the Scandinavian mountain range. The maximum altitude of the study area is 1324 m.
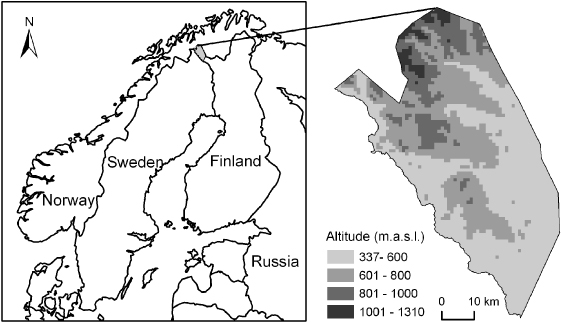
Figure 1. The location and altitude of the study area in Enontekiö Lapland, northern Finland.
Download figure:
Standard imageThe study area is characterized by sub-arctic birch forests and treeless tundra heath. Birch forests exist approximately up to 600 m (about 50% of the study region). About 10% of the study area is located above 850 m.a.s.l in middle and high oroarctic zones (Eurola et al 2003). Hemioroarctic and low oroarctic zones are dominated by Empetrum and Myrtillus mountain heaths. Low-graminoid mountain heaths, mountain meadows, snowbeds and frost-influenced heaths are typical vegetation types of the middle oroarctic zone (Eurola and Virtanen 1991).
3. Materials and methods
3.1. Satellite images and aerial photography
Late summer SCA was mapped from cloud free or nearly cloud free Landsat ETM+ and Landsat TM data obtained in late July and early August in 2000, 2004, 2006 and 2009 (USGS 2011, table 1). Five orthorectified false color aerial photographs from 2000 were used as ground truth in snow cover classification (National Land Survey of Finland). Aerial photographs covered a total of 118 km2 of the northern part of the study region.
All spatial analyses were carried out using ArcGIS 9.3 software (Esri Inc.). Late summer SCA was derived from Landsat data using a normalized difference snow index with the following equation: NDSI = (band 2 − band 5)/(band 2 + band 5). NDSI is based on high reflection of visible radiation and absorption of middle infrared by snow (Dozier 1989). NDSI is particularly effective in the separation of snow from clouds and sunlit bright surfaces, such as roads and rocks. However, water bodies and moist land can have NDSI values in the same range as snow (Hall et al 1995, Salomonson and Appel 2004). In order to remove these errors from the snow maps, an unsupervised maximum likelihood classification including bands 1–5 and 7 was performed for the four Landsat datasets to produce a mask containing water bodies and moist land.
Accuracy assessment of snow cover mapping was carried out by selecting a total of 500 random points from the snow cover map for the year 2000, of which 250 points were classified as snow and 250 points as other land cover. These points were compared to aerial photographs taken close to the date when the Landsat imagery was acquired (table 1). The overall classification accuracy and the errors of commission (false inclusion) and omission (false exclusion) were calculated for both classes.
Table 1. Summary of remote sensing data used in the study.
| Date | Resolution | Path/row | |
|---|---|---|---|
| Satellite images | Bands 1–5, 7 | ||
| Landsat ETM+ | 27 July 2000 | 30 m | 195/11, 12 |
| Landsat TM | 30 July 2004 | 30 m | 195/11, 12 |
| Landsat TM | 27 July 2006 | 30 m | 196/11, 12 |
| Landsat TM | 4 August 2009 | 30 m | 196/11, 12 |
| Aerial photographs | 25 July 2000 | 0.5 m | — |
3.2. Topographical data
Topographical variables were derived from a digital elevation model (DEM; National Land Survey of Finland) with a spatial resolution of 25 m. The mean values of altitude, terrain ruggedness and incoming solar radiation, or insolation (i.e. how much solar radiation energy a surface receives over a period of time, ignoring variations from year to year due to cloudiness but describing a shielding effect) were calculated for the 1 km grid squares. Terrain ruggedness was defined as a standard deviation of altitude. Insolation was calculated using the solar radiation analysis tools in ArcGIS for the period from March to September. Furthermore aspect, or slope direction was derived from a DEM, and the values were classified into three groups: (1) northern and eastern slopes ('cold'), (2) southern and western slopes ('warm') and (3) flat land. The dominant aspect in a 1 km grid square was determined by the majority value of the pixels.
3.3. Climate data
Climate data consisted of monthly mean air temperature and precipitation data interpolated into 10 km grid squares for the years 1995–2009. Grid square values are calculated on the basis of measurements by nearby observation stations (Finnish Meteorological Institute; Venäläinen and Heikinheimo 2002, Venäläinen et al 2005). The Kilpisjärvi Weather Station is located in the northwestern part of the study area. The other nearest observation stations to the study area are located circa 95–170 km southeast from Kilpisjärvi.
Climate variables were calculated as a mean of 30 grid squares included in the study area. Climate variables included annual and monthly: (1) mean air temperatures (°C), (2) numbers of frost days (minimum daily air temperature< 0 °C), (3) mean rainfall (mm), and (4) mean snowfall (mm). Rainfall and snowfall were estimated from daily precipitation data simply based on daily mean air temperature above or below zero. As satellite images were acquired in late July or early August, annual mean air temperature and precipitation values were calculated from August to July. Temperature trends and their statistical significance were examined using the Excel LINEST function.
Projections of future climate change were based on regional climate model (RCM) simulations conducted within the ENSEMBLES (Van der Linden and Mitchell 2009) and PRUDENCE projects (Christensen and Christensen 2007). The study area includes about ten grid boxes in the 25 km × 25 km ENSEMBLE RCM grid and about five grid boxes in the 50 km × 50 km PRUDENCE RCM grid. The RCM climate change projections show good continuity in space, particularly when averaged over multiple models, and are therefore insensitive to the exact definition of the area. Annual and monthly mean air temperature, snowfall and rainfall based on ENSEMBLES simulations were calculated for the periods 1971–2000, 2010–39, 2040–69, and 2070–99. These climate variables were based on mean values of eleven simulations run at 25 km horizontal resolution (Räisänen and Eklund 2012). The number of frost days was derived from the average of seven PRUDENCE RCM simulations performed at about 50 km horizontal resolution for the periods 1961–90 and 2071–100 (Jylhä et al 2008).
3.4. Spatial and statistical analyses
In order to examine topographical factors affecting late summer snow occurrence in the landscape, two analyses were carried out at different spatial scales. First, the distribution of late summer SCA in relation to altitude and aspect was studied at the pixel level (30 m resolution) in each of the four study years. Second, the factors affecting the occurrence of late summer snow was examined in 1 km grid squares.
The number of years with snow present (range: 0–4) was calculated for each 1 km grid square, and a generalized additive model (GAM) was constructed to examine the effects of altitude, terrain ruggedness, insolation and aspect on interannual variation of late summer snow occurrence. GAMs are non-parametric extensions of generalized linear models that allow different statistical distributions of response variables and estimate response curves with a non-parametric smoothing function (Hastie and Tibshirani 1990). A GAM for the number of snow years was built using a Poisson distribution of errors and log link function and smoothed with three degrees of freedom. Analyses were conducted using a GAM package of the R statistical software (R Development Core Team). The most parsimonious model was selected using Akaike's Information Criterion (AIC). Correlations between continuous variables included in the model were generally low (<0.5). Further, univariate GAMs were constructed in order to study the individual contributions of the explanatory variables. Spatial autocorrelation in the residuals of the final GAM model was estimated by calculating Moran's I statistics for 10 distance classes at a 1 km interval (Legendre and Legendre 1998).
4. Results
4.1. Accuracy of late summer snow classification
The overall accuracy of the classification of late summer SCA in 2000 was 95.2%. The error of commission was 6.3% for snow and 3.2% for other land cover. The error of omission was 3.3% for snow and 6.2% for other land cover.
4.2. Spatial distribution and occurrence of late summer snow
Late summer snow covered 23.0 km2 in 2000, 2.7 km2 in 2004, 1.5 km2 in 2006, and 5.0 km2 in 2009 (figure 2), and was typically found at altitudes above 900–1000 m. In the year 2000, approximately half of the snow cover was found above 900 m (where 7% of the total study area is located), compared to circa 75% in 2004 and 2006, and 62% in 2009 (figure 3). Northern and eastern slopes accounted for 59% of the total snow cover in 2000, whereas this proportion was considerably higher in 2004 (75%), 2006 (78%) and 2009 (69%).
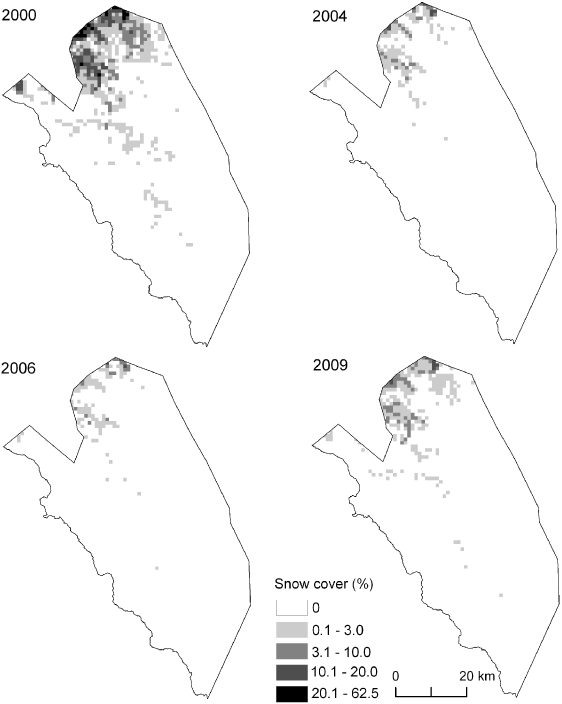
Figure 2. The proportion of late summer snow cover in 1 km grid squares in the years 2000, 2004, 2006 and 2009.
Download figure:
Standard image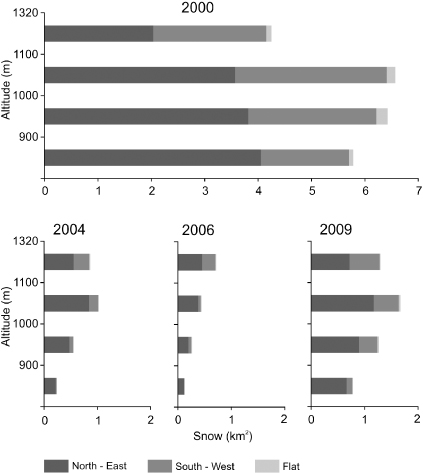
Figure 3. Observed distribution of late summer SCA in relation to altitude and aspect at 30 m resolution (a pixel-level analysis) in four study years. An x-axis describes SCA (km2) and its distribution between northern and eastern ('cold') slopes and southern and western ('warm') slopes.
Download figure:
Standard imageThe most parsimonious GAM model included altitude, terrain ruggedness and insolation smoothed with three degrees of freedom, and aspect. The model explained 72.7% of the variation in the number of snow years in 1 km grid squares. The number of snow years had a positive relationship with altitude and terrain ruggedness (figure 4) that alone explained 66.5% and 27.2% of the variation, respectively. Insolation had a negative humped relationship with the number of snow years and explained alone 8.3% of the variation. Aspect alone explained 2.5% of the variation in the number of snow years.

Figure 4. Response shapes of the continuous explanatory variables (altitude, m; terrain ruggedness, m; and insolation, kWh m−2) included in a GAM model for the number of snow years in 1 km grid squares.
Download figure:
Standard imageMoran's index calculated for the residuals of the model showed statistically significant (p = 0.000) spatial autocorrelation at the shortest distances (0.33, 0.24 and 0.18 at distance classes 1, 2 and 3 km, respectively). Autocorrelation decreased rapidly at greater distances (0.14–0.06 at distance classes 4–10 km).
4.3. Climatic variation in 1995–2009 and projections for 2010–2099
The mean annual air temperature increased on average by 0.17 °C per year (P < 0.001 disregarding interannual autocorrelation) between August 1995 and June 2009 (figure 5). Warming was most remarkable in April–May (0.33 °C;P < 0.001) and in November–December (0.37 °C,P < 0.001). In April–May the mean air temperature increased from sub-zero to above-zero temperatures. The number of frost days in May decreased on average 0.6 days per year between 1995 and 2009 (P < 0.05). In our four-year sample, the mean April–May air temperature was 2.0–2.9 °C lower, and there was 1.3–6.8 more frost days in May in the most snow-rich year 2000 compared to less snow-rich years 2004, 2006 and 2009.

Figure 5. Annual mean air temperature (from August to July) and mean air temperatures for April–May and November–December in 1995–2009, and mean simulated temperatures for the periods 1971–2000, 2010–39, 2040–69 and 2070–99 derived from ENSEMBLES models.
Download figure:
Standard imageThe simulated increase in annual mean air temperature based on 11 ENSEMBLES models was 4.4 °C between 1971–2000 and 2070–99 (min 3.5 °C, max 5.6 °C; figure 5). The greatest warming in the simulations takes place between November and March (mean increase of 5.3–5.8 °C). Simulations indicated greater increases in spring and late autumn temperatures (April–May, October; 3.7–4.4 °C) than in summer and early autumn temperatures (June–September; 2.8–3.5 °C). The annual number of frost days based on the mean of seven PRUDENCE models is projected to decline from 240 (min 221, max 256) in 1961–1990 to 185 (min 163, max 200) in 2071–2100. The greatest projected decline in the number of frost days occurs in May (from 21.5 to 6.7 days) and in October (from 25.2 to 11.9 days).
Precipitation showed strong interannual variation in terms of the total amounts and the relative proportions of snowfall and rainfall, with an annual mean of 552 mm for the total amount and 1.0 for the snowfall-to-rainfall ratio between July 1995 and August 2009 (figure 6(a)). Annual mean snowfall declined by 14.1 mm per year (P < 0.05) and mean snowfall in October by 3.1 mm per year (P < 0.05) in 1995–2009. Rainfall in May and September increased on average 1.5 mm (P < 0.05) and 2.2 mm (P < 0.05) per year, respectively. The years 2000, 2004 and 2006 had high annual rainfall amounts (331–369 mm), but annual snowfall was much higher in 2000 (428 mm) than in 2004 and 2006 (225 and 163 mm, respectively). In 2009, both snowfall (204 mm) and rainfall (195 mm) were relatively low. Comparing these numbers with the late summer SCA, the latter is strongly related to the snowfall-to-rainfall ratio within this four-year sample, which varied from nearly 1.2 in the most snow-rich year 2000 to less than 0.5 in the least snow-rich year 2006.
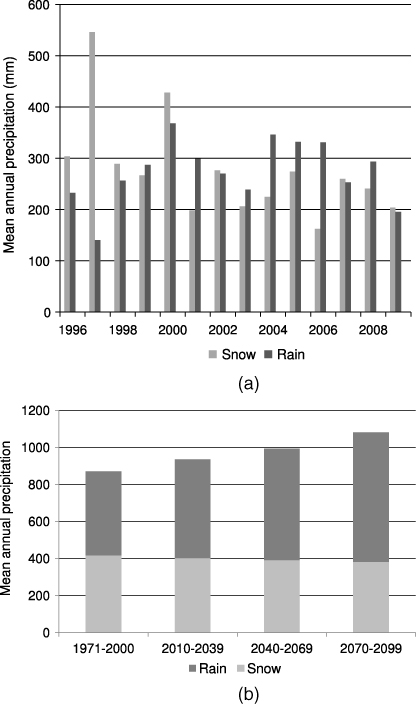
Figure 6. (a) Annual snowfall and rainfall for the period August 1995–July 2009. (b) Simulated precipitation for the periods 1971–2000, 2010–39, 2040–69 and 2070–99 derived from ENSEMBLES models.
Download figure:
Standard imageClimate simulations indicated a notable increase in annual rainfall and a slight decline in annual snowfall from 1971–2000 to 2070–99 (figure 6(b)). Declines in snowfall, and major increases in rainfall are projected to take place between early spring and late autumn. The greatest simulated changes in precipitation occur in May, September and October with 15–20 mm per month decline of snowfall, and 35–47 mm increase of rainfall. Spring and autumn declines of snowfall are not compensated by 5–13 mm increases between November and March.
5. Discussion
Our results showed that topographical factors, particularly altitude and terrain ruggedness, strongly control the occurrence of late summer snow in alpine landscapes. Cold temperatures at high altitudes support the persistence of snow due to slow-melting processes. Snow accumulation in open environments is driven by the interplay between wind and topography. Ridges and felltops can be extremely windblown, with a shallow snow cover that melts early in the summer. Valleys and depressions accumulate snow that can persist for a long time because of the suitable microclimate (Walker et al 2001). The pixel-level analysis showed that the most persistent snowbeds and snow patches were restricted largely to northern and eastern slopes. The number of snow years in 1 km grid squares was only weakly related to aspect, probably due to the relatively large scale of the analysis. The relatively small contribution of insolation to the snow year model is probably related to the fact that in addition to insolation, surface air temperatures affecting snow melt rates are also regulated e.g. by elevation, proximity to sea and prevailing winds (Dobrowski et al 2009, Green and Pickering 2009). Late summer snow occurs both in valleys and gorges with relatively low insolation values as well as on high-altitude plateaus with relatively high insolation values.
Observed air temperature increases in our study region are in line with observations from elsewhere in northern high latitudes, showing both overall warming and disproportionate increase in minimum temperatures that have resulted in lengthening of the warm season (Easterling et al 1997, ACIA 2005). Virtanen et al (2010) reported an increase of 8–10 days in the growing season in northwestern Finland since the 1960s, with simultaneous significant increases in the sums of daily temperatures above 3 °C. The annual mean air temperature in Finland has increased by 0.93 °C during the past 100 years (1909–2008) (Tietäväinen et al 2010). The increase in the mean temperature has been greatest during spring (1.6 °C), and during the past 50 years in winter (3.5 °C). It should be noted that significantly greater increases in temperatures in our study area within the shorter period 1995–2009 are most likely partly related to random variation in climate in addition to long-term climate change.
Watson et al (1994) reported that the number and length of summer snow patches are strongly related to winter and summer temperatures and they could be thus used as a short-term integrative index of climatic variation. Furthermore, the findings of Green and Pickering (2009) suggest that snow patches are sensitive to summer warmth and only the accumulation of sufficient snow in winter guarantees the long-time survival of snow patches. The cover and distribution of late summer snow varied strongly during the past decade in our study region. The parallel analysis of snow cover and recent climate records showed that low snow abundances occurred simultaneously with a relatively low snowfall-to-rainfall ratio. Model simulations suggest that future winters will be capable of accumulating snow in the landscape. However, increases in rainfall and decreases in snowfall between spring and late autumn together with increasing temperatures are likely to result in more efficient snowmelt during the warm season. Late-melting snowbeds are likely to disappear earlier in the summer. Further, the depth of (semi)permanent snow patches will be reduced and they are likely to melt completely during the warm season (Green and Pickering 2009).
Landscape heterogeneity associated with summer snow increases habitat diversity and thus, biological diversity (Wookey 2007). Earlier snowmelt was found to be most harmful to the snowbed specialists adapted to the coldest temperatures and shortest growing season (Schöb et al 2009). These species will suffer from both altered abiotic conditions, such as wide springtime temperature variations and decreased soil moisture content in summer, as well as more intensive competition by more productive species of surrounding habitats (Nagy 2006, Scherrer and Körner 2010, Venn et al 2011). As climate change proceeds, the snowbed communities are likely to turn into mountain heaths and meadows (Norokorpi et al 2008) resulting in homogenization and lowered β-diversity (the change in species composition between habitats) of alpine landscapes (Britton et al 2009).
The changes in plant abundance and their nutritional value may have cascading effects on ecosystem functioning via their influence on herbivores. Lemmings (Lemmus lemmus) are specialist herbivores which are dependent on bryophytes during winter (Stenseth and Ims 1994, Virtanen et al 1997), and transformations of bryophyte-rich snowbed vegetation would limit their overwintering habitats and potentially affect their population dynamics. In summer, snowbeds and permanent snow patches are favored habitats by reindeer (Rangifer tarandus tarandus) as they facilitate thermoregulation, provide insect relief on the warmest days (Moen et al 2008), and offer fresh, high-nutritious forage throughout the summer at the edge of the melting snow (Mårell et al 2006).
Remote sensing provides an efficient method for mapping threatened snow habitats. As snow is a distinct feature in the summertime treeless tundra, classification accuracy was high (see Hall et al 1998). Classification errors were associated mainly with small snow patches beyond the spatial resolution of Landsat data and mixed pixels in the borders of narrow snow patches. Direct mapping of snowbed vegetation from satellite images produces notably lower classification accuracies (Edenius et al 2003). High-resolution updated habitat data at the regional scale combined with local-scale field observations of arctic and alpine biota (Grabherr et al 2010) could greatly improve the estimates of climate change impacts on high-latitude biodiversity. The results of a GAM model showed that interannual snow occurrence tended to be correlated among 1 km study squares located close to each other. This spatial autocorrelation in the residuals may indicate e.g. variation in local processes, such as the effects of wind drift or vegetation on snow accumulation (Green and Pickering 2009).
6. Conclusions
High-latitude snowbeds and snow patches have geographically limited distribution that is related to topographical factors. The cover and distribution of late summer snow showed strong variation between the years. Our results suggest that increasing proportion of rainfall compared to snowfall particularly in spring will accelerate snow melting in the future. Increasing temperatures and the decreasing number of frost days will further contribute to faster snowmelt. This is likely to result in smaller cover and more scattered distribution of snowbeds and snow patches. Based on our modeling results we hypothesize that topography will become an even more important driver of the distribution of snowbeds and snow patches, as they will be even more restricted to microclimatically suitable locations (e.g. shady gorges and valleys at high altitudes) in warmer climate. These changes may have negative effects on biological diversity and ecosystem services in high-latitude landscapes.
Acknowledgments
We thank Risto Virtanen for his constructive comments on the manuscript and Pentti Pirinen from the Finnish Meteorological Institute for the management of climate data. Michael Bailey checked the language of the manuscript. This study was funded by the Academy of Finland (Project number 128615). The ENSEMBLES and PRUDENCE simulations used in this work were funded by the EU FP6 Integrated Project ENSEMBLES (Contract number 505539) and the EU FP5 Project PRUDENCE (EVK2-CT2001-00132), respectively.