
Abstract
This letter consists of a first-order analysis of the primary energy embedded in water in the United States. Using a combination of top-down sectoral assessments of energy use together with a bottom-up allocation of energy-for-water on a component-wise and service-specific level, our analysis concludes that energy use in the residential, commercial, industrial and power sectors for direct water and steam services was approximately 12.3 ± 0.3 quadrillion BTUs or 12.6% of the 2010 annual primary energy consumption in the United States. Additional energy was used to generate steam for indirect process heating, space heating and electricity generation.
Export citation and abstract BibTeX RIS
1. Introduction
The relationship between energy and water, commonly referred to as the energy–water nexus, has received increasing attention in recent years in light of growing water and energy resource demand in the United States (US). The US water system is comprised of many stages of collection, treatment, conveyance, distribution, end-use preparation, reconditioning and release, each of which has important energy implications. National water-related energy use is expected to increase as water-stressed states such as Texas, Florida, Arizona and California shift toward more energy-intensive technologies such as desalination plants and interbasin water pipelines to address current and future water-scarcity concerns. Although these shifts toward more energy-intensive water are likely to have an appreciable impact on future energy demand, very little analysis has been done to quantify water-related energy use at the national-level to establish a benchmark for today's conditions. Thus, there is a knowledge gap about the energy needs of the water system. This analysis serves to fill that gap by quantifying a baseline estimate of 2010 water-related energy use in the US.
2. Background
The United States Geological Survey (USGS) estimates that total US water withdrawals in 2005 were approximately 410 billion gallons per day. Of this amount, 349 billion gallons per day was freshwater. Water is allocated to several categories of users that either collect their own water for their own internal uses ('self-supplied users') or draw their water from the public water supply. Table 1 organizes 2005 water withdrawals reported by the USGS into four categories that are consistent with the end-use sectors defined by the Energy Information Administration (EIA). (These end-use sectors include Residential, Commercial, Industrial and Power, which deviate slightly from USGS's standard reporting notation.) The vast majority (89%) of water withdrawals were by self-supplied users, divided among the sectors as listed in table 1. The public supply only accounted for 11% of 2005 water withdrawals by volume [1].
Table 1. The US withdrew 410 billion gallons of water per day in 2005. Freshwater withdrawals represent 85% of total water withdrawals [1].
| Sector | Description of water withdrawals | Withdrawals (billion gallons per day) | Percentage (%) |
|---|---|---|---|
| Residential | Self-supplied | 3 830 | 0.9 |
| Public supply | 25 600 | 6.3 | |
| Commercial | Self-supplied | Not reported | — |
| Public supply | 14 100 | 3.4 | |
| Industrial | Self-supplied (non-irrigation) | 33 100 | 8.1 |
| Self-supplied (irrigation) | 128 000 | 31.2 | |
| Public supply | 4 420 | 1.1 | |
| Power | Self-supplied | 201 000 | 49.0 |
| Public supply | Not reported | — | |
| Total | All withdrawals | 410 000 | 100 |
The energy intensity of a volume of water is influenced by factors such as source water quality, proximity to a water treatment facility and end-use, intended end-use and sanitation level, as well as conveyance to and treatment at a wastewater treatment facility. The energy intensity of a given water treatment technology correlates to the size, concentration, and nature of the contaminant to be removed. As source water becomes more degraded, more energy-intensive water treatments are required to remove contaminants. Likewise, water requiring a high end-use quality typically requires more energy for treatment than water requiring a lesser end-use quality. Since these requirements differ by geographic location, climate, season and local water quality standards, the energy consumption of regional water systems vary significantly.
While public water supply withdrawals are considerably smaller than those of the thermoelectric power and irrigation sectors, these withdrawals typically have higher energy requirements because this volume of water must be treated to the acceptable drinking water standard specified by the US Environmental Protection Agency's (EPA) Safe Drinking Water Act (SDWA). Water delivered in the public water supply is also typically pumped longer distances, since self-supplied industrial and agricultural users generally draw water in close proximity to where it will be used [2, 3]. Providing water at this quality and at these volumes requires significant amounts of energy to pump, treat and distribute water to end-users, who are likely to heat, chill or pressurize this water to suit their needs on-site. After water is used, much of it is collected and sent to a wastewater treatment plant where it is reconditioned to an acceptable standard so that it can be released back into a water reservoir. In some cases, water is recycled or reclaimed, that is, it is treated to an acceptable standard for use in non-potable applications (e.g. agricultural and landscape irrigation, groundwater recharge, industrial cooling/process water, toilet flushing, etc). Depending on the circumstances, reclaimed water might require tertiary treatment following standard wastewater treatment to meet an end-quality level appropriate for its intended end-use. However, in many regions of the US, wastewater is treated to a standard acceptable for non-potable reuse and requires no treatment in addition to standard practice. Thus, most of the current energy expenditures for recycled water are those for pumping water from the wastewater treatment facility, to its end-user [4]. However, the use of reclaimed water for potable reuse in the US is limited, comprising only 0.1% of the total volume municipal wastewater treated annually.
The US public water supply serves several different end-uses that are highlighted in table 1. Over half of the public supply (58%) is delivered to Residential users, while 12% is delivered for use in the Industrial sector (three-quarters of the total water used in the Industrial sector is self-supplied) [1]. Of the remaining 30% of the public water supply, about half is delivered to commercial users and the other half is used in public locations, such as municipal buildings and recreation spaces, and for public services such as street washing, fire hydrants and fire fighting. A small percentage of the public use category includes water that is 'lost' or unaccounted for. The USGS includes water used for public services and leaks in the same category, since a significant volume of this water is unmetered, so there is no way to distinguish this water use from losses in water systems [1]. Consequently, the actual volume of water that is lost through leakages is not known since this category is determined by calculating the difference between water released into the distribution system and the volume of water delivered to billed customers. Some of this category might also include errors in water-metering. Statewide public use and losses have been reported anywhere in the range of 3–41% of the total public supply [5]. Since the EIA includes municipal, public and recreational energy use in its Commercial sector category, we include all water delivered to commercial, municipal and public users in the 'Commercial' category of table 1.
Self-supplied water collected by power generators, irrigators and industrial facilities is not required to meet the sanitation standards defined by the SDWA and is not typically treated to potable quality. (However, some industrial users such as producers of semi-conductors require water of extremely high standards to prevent equipment fouling [6].) Although less rigorous water treatment uses less energy, other aspects of water use often cancel out any energy savings. For example, self-supplied users often use less-efficient pumps than public utilities (due to reduced scales of pumping [7]) and might also pressurize, heat or cool water according to their intended end-use. Many of these users are also required to treat their wastewater before discharging it to a reservoir to remain in compliance with the EPA's Clean Water Act [8]. Chemical and refining industries often require primary, secondary and tertiary treatments before water is of sufficient quality to discharge to public water treatment facilities or water reservoirs. Additionally, these industries must often strip wastewater with hot steam or gas streams to remove chemicals and oil from wastewater prior to primary wastewater treatment [9].
Figure 1, adapted from a 2005 report from the California Energy Commission (CEC) [10], defines a range of energy-intensities for each life-cycle stage included within the dotted boundaries of the flow diagram. In addition to rigorous data collection in respect to the energy consumption of Californian water utilities, these benchmarks are useful since several of the state's public water supplies are among the most energy-intensive in the world, while others require very little energy. Data reported by other states such as New York, Massachusetts, Wisconsin and Iowa regarding the energy intensity of water supply segments fall well within the prescribed ranges defined in figure 1 [11]. The upper bound of each range represents an energy-intensive scenario based on empirical data collected on Californian public water systems. High-energy scenarios usually include water systems that require extensive water pumping (e.g. the State Water Project and the Central Valley Project) and/or advanced water treatment. The lower-bound represents a scenario requiring very low-energy inputs. Low-energy scenarios generally include situations in which gravity can be used to move water without pumping and/or raw water is of very high quality.
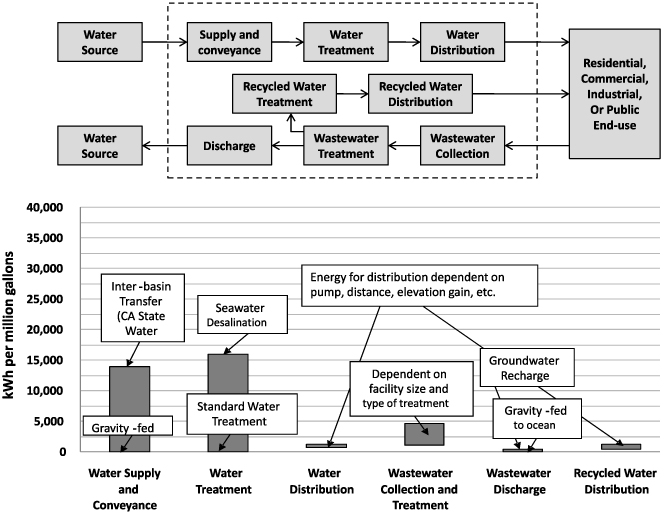
Figure 1. The energy intensity of each stage of the public water supply life-cycle varies according to regional topography, climate, and policy framework. The range in energy intensity of each stage included within the dotted region of the flowchart (top panel) is depicted in the bar graph below it (bottom panel). Water is not always discharged to the same water source that it was originally extracted from. (Data and flowchart adapted from [12].)
Download figure:
Standard imagePrevious analyses have concluded that over 3% of national electricity consumption is used for the production, conveyance, and treatment of water and wastewater in the US and much more when considering the additional energy required for on-site heating, cooling, pumping, and softening of water for end-use [7, 13]. Most of the estimates made to date regarding the energy intensity of water are based on work done by the Electric Power Research Institute (EPRI) over the past few decades. In 2002, EPRI published a report regarding the electricity consumed for providing water and wastewater treatment in the US. The report estimates the average electricity intensity of the water supply by considering the energy to supply, treat and recondition wastewater effluent. Electricity data from public water supply agencies, publicly and privately owned wastewater facilities, and self-supplied sectors including domestic, commercial, industrial, mining, irrigation, livestock and thermal power generating sectors were analyzed to conduct the analysis. The report does not, however, attempt to quantify water-related energy needs of end-use preparation such as heating, cooling and pressurization [7].
A report released in 2009 by the River Network extends the 2002 EPRI analysis to quantify water-related energy for end-use in the Residential and Commercial sectors, as well as the CO2 emissions associated with this energy use [14]. While this report advances the state of understanding about water-related energy and carbon for all public and self-supplied water-users by including end-use, its assumption that all end-use consumption of energy-for-water is in the form of electricity fails to consider the likelihood of direct use of fuels on-site (for example natural gas for water heating). Consequently, the assumptions for conversion efficiency are likely to yield an over-estimate for total energy consumption in context to the report's scope. The work in this letter seeks to update and extend calculations in this body of prior work by using more recent data, performing more detailed analysis at the component levels, and refining the assumptions about conversion efficiencies at the power plant and in water heaters and treatment systems to account for direct and indirect uses of water.
While national studies have aggregated averages for the energy use and energy intensity of various stages of the US water system, these estimates do not capture the wide disparity between regional water systems. Several studies have been completed to estimate water-related energy use at the state-level. California, a state that uses 19% of its electricity and 32% of its natural gas to withdraw, collect, convey, treat, distribute, and prepare water for end-use, has been especially diligent in accounting its water-related energy use [12, 15]. While other states such as Massachusetts, Wisconsin, Iowa, and New York have also begun quantifying their water and wastewater utility energy consumption at the state-level, the data are sparse for most states [11].
Considering the disparity across regional water systems, calculating water-related energy consumption in the US is not straightforward, as it requires analysis with temporal and geographic fidelity. Furthermore, analysis is hindered by data gaps, the largest being outdated information on energy consumption by water and wastewater plants; incomplete data for water-related end-uses, especially in non-residential sectors; and poor accounting for losses and leaks. The following manuscript will describe a first-order method of quantifying baseline water-related energy consumption in the US.
3. Methodology
This analysis builds on the work done by CEC, using data from the US EIA, the US Department of Energy (DOE), EPRI and private sources, to derive a first-order approximation for the primary energy embedded in water in the US. We considered water-related energy in the Residential, Commercial, Industrial and Power sectors, which represent just over 70% of total US primary energy consumption [16]. (Transportation, representing the remainder of energy use, was not included.) Results are reported for primary energy consumption in terms of British Thermal Units (BTUs) to be consistent with the notation of most US authoritative energy agencies.
3.1. Data sources
Residential and Commercial sector energy consumption data reflect DOE's 2010 Building's Energy Data Book [17, 18], various sources from the EIA [19–21], and EPRI's projections regarding 2010 water and wastewater utility energy use [7]. Industrial data reflect energy consumption projections for 2010 published in EIA's Annual Energy Outlook 2011 [19]. (EIA projects industrial energy consumption on an annual basis based on the Manufacturing Energy Consumption Survey (MECS), which is only published every few years. The latest edition, as of early 2012, was the 2006 MECS, published in 2008.) Data regarding the Power sector are from the 2010 DOE/EIA Form EIA-923 database, which characterizes combined heat and power (CHP) and electric power plants in terms of electric power generation, fuel consumption, operation cooling water data, primary mover type, location, etc [22].
Supplementary reports were used in addition to these large, aggregate datasets, to gain insight into the technology and/or fuel distribution across certain technologies (e.g. the fuel distribution across industrial boilers or commercial air-conditioners). Although we only used energy consumption data from 2010, we did not scale any fuel distribution estimates based on industry reports published prior to 2010, assuming that the general distribution of technologies changed very little in the past decade. (For example, if 40% of industrial boilers in the Refining industry were fueled by natural gas in 2005, we assume that this distribution was the same in 2010.)
3.2. Allocation methods
Definition of water-related energy classifications. Total primary energy consumption data from 2010 were aggregated and organized by sector and primary fuel consumption. Each sector included between 3 and 12 categories that were analyzed on a line-by-line basis to determine the fraction of energy, if any, that was attributable to water-related services. (Table 2 organizes these energy-consuming activities by category, j, and sector, i.)
Table 2. The sectors, i, and activities, j, that were aggregated in equations (1)–(3) are listed here.
| Residential | Commercial | Industrial | Power | |
|---|---|---|---|---|
| j | i = 1 | i = 2 | i = 3 | i = 4 |
| 1 | Space heating | Space heating | Chemical | Power plant use |
| 2 | Water heating | Water heating | Refining | Steam-driven power |
| 3 | Air conditioning | Public water/wastewater utilities | Paper and pulp | Pumped storage |
| 4 | Wet cleaning | Air conditioning | Construction | |
| 5 | Ranges, stoves, ovens | Ventilation | Mining | |
| 6 | Hot tubs, pools, spas | Refrigerators and freezers | Food | |
| 7 | Refrigerators | Food service equipment | Iron, steel, aluminum | |
| 8 | Separate freezers | Cooking | Agriculture | |
| 9 | Televisions | Electronics/computers | Other | |
| 10 | Personal computers | Lighting | ||
| 11 | Lighting | Other | ||
| 12 | Other |
We defined three general classifications of water-related energy use based on whether energy was used to prepare water to be delivered to an end-user or as a secondary product used directly or indirectly to produce another good or service.
These classifications are as follows:
- (i)Direct water services. Direct primary fuel consumption for water heating, cooling, pumping, pressurization, evaporation, softening, removal and treatment. (Assigned a fraction, F(DWS)ij of total energy use, Eij. This direct energy-for-water is included in figure 3.)
- (ii)Direct steam use. Energy for on-site steam generation that is used directly (i.e. steam comes into direct contact with feedstocks) in processes. Examples would include steam used for sterilization and cleaning; boiling, steaming and blanching for food preparation; steam stripping in chemical manufacturing and refining processes; and direct injection of steam in paper–pulp industry processes. (Assigned a fraction, F(DSU)ij of total energy use, Eij. This direct energy-for-water is also included in figure 3.)
- (iii)Indirect steam use. Energy for on-site steam production that is used for indirect process heating (i.e. steam does not come into direct contact with process feedstocks), space heating, and electricity generation. (Assigned a fraction, F(ISU)ij of total energy use, Eij. This energy, considered indirect, is not included in figure 3.) Although steam for electricity generation is commonly considered as an 'energy-related water use' in energy–water nexus studies, it must also be considered as a 'water-related energy use' in this analysis, since water must be boiled in order to be used for electricity generation. That is, without an initial conversion into steam, water cannot be used to generate power.
We used these three definitions to allocate a fraction of energy to one, two or all of these categories depending on the nature of the energy use of each energy-consuming category included in table 2. Each fraction represented the ratio of water-related energy use to total energy use in a given category.
Equations (1)–(3) were used to determine total energy for direct water services (EDWS), direct steam use (EDSU) and indirect steam use (EISU), respectively. Total direct and indirect energy embedded in water is categorized in equations (4) and (5), respectively.


Water-related energy in the residential sector. The Residential sector was divided into 12 energy-consuming categories based on energy end-use splits defined in EIA's 2010 Buildings Energy Data Book [17]. Although the EIA defines total energy consumption in each category by fuel, it does not include any further data resolution. Thus, each category had to be painstakingly analyzed to determine (1) the percentage of energy in each category, j, that was consumed exclusively for water-related purposes, (2) the fraction of water-related energy consumed for direct water services, direct steam use, and indirect steam use in each category, j, and (3) the subset of fuels that were consumed for each energy-consuming activity.
The EIA, for example, reports that 5.84 quads of primary energy was consumed for Residential Space Heating in 2010 [17], but it does not split this category into smaller device-specific subsets. Since some space heating devices require water as a heat delivering medium (i.e. hydronic systems including residential boilers, water-driven heat-pumps, hot water radiant floors, etc) and others do not (e.g. central heating, ventilation and air conditioning systems), we first had to estimate the distribution of water-driven space heating technologies across the US. Based on the literature, we assumed that 11% of total energy for Space Heating was consumed by hydronic systems [20, 23, 24]. Secondly, we had to determine how to classify this water-related energy. In this case, the entire fraction (i.e. 11% of 5.84 quads) of water-related energy was considered in the indirect steam use category since hydronic systems use steam or hot water to deliver heat in a closed-loop system and, thus, the heat-carrying fluid does not come into direct contact with the air being heated. Thirdly, we approximated the distribution of fuels that made up this energy consumption based on EIA's 2009 Residential Energy Consumption Survey and other sources in the literature [17, 18, 20, 25]. (When there were no data to indicate otherwise, we assumed that the general fuel distribution across technologies did not change from earlier reports, as shifts in technology generally occur over many years.) We assumed that fossil-fuels supplied the majority of the energy consumed by these systems, primarily in boilers, but renewables such as wood and geothermal also contributed a small fraction of energy for hydronic space heating.
The remaining 11 Residential sector categories were analyzed with similar rigor to determine total water-related energy for each. Most water-related energy in the Residential sector was considered in the direct water services category, with the aforementioned exception of energy consumed in residential space heaters. Categories such as water heating, hot tubs and pools were relatively straightforward to analyze, since most, if not all, of consumed energy was attributed to heating or pumping water. Categories such as lighting, television and personal computers were also straightforward as they consume essentially no energy for water-related purposes. Other categories were less clear and, like the space heating category example, required device-specific interpretation. For example, the majority of the energy used to run clothes washers, dryers, and dishwashers was considered in the direct water services category since water is the required medium for cleaning; in the case of clothes dryers, operation is dependent on effectively removing water from clothes. Cooking related activities were also difficult to estimate since steaming, blanching, boiling, and other water-related cooking processes vary widely across residences and are not well documented. Categories that required more analysis or had less available data at the device or activity-specific level, were assigned greater levels of uncertainty. (See subsection on uncertainty below.) All assumptions for all sectors and categories are detailed in supporting information (available at stacks.iop.org/ERL/7/034034/mmedia). Water-related energy in the commercial sector. Eleven energy-consuming categories were defined and analyzed in the Commercial sector with the same methodology discussed in the Space Heating example above. Activities such as public water and wastewater treatment, and distribution and water heating were assigned values of F(DWS)ij = 1, as all of the energy consumed in these categories was to move and treat water. Since the public water and wastewater utility category is not explicitly defined in EIA's 2010 Buildings Energy Data Book [18], we base this category on EPRI's projections for 2010 public water and wastewater utility energy consumption [7]. (We subtracted this primary energy use from EIA's other category, where it would otherwise be included.) EPRI's projection regarding energy use by public water and waste water utilities in 2010 was based on data from 2000, and is therefore subject to error. However, more recent energy data on public water utilities at the national scale are unavailable. Other categories required more rigorous analysis based on more detailed sources such as EIA's 2006 Commercial Building Energy Consumption Survey [21] and the 2005 Commercial Boiler Inventory published by [26].
Although category definitions were generally similar to those in the Residential sector, results were generally very different, reflecting large sectoral differences. For example, central chillers and district chilled water systems are two common technologies that use water as a means to extract heat from large spaces; air-conditioners in the Residential sector, on the other hand, generally use air to cool residences (an exception being swamp coolers that are only used in a very small percentage of homes). We also assumed that some large commercial computer and electronics facilities (such as data centers) used some water-related energy for cooling devices. Commercial refrigerators, freezers and ice-makers were also assumed to use an appreciable amount of energy for chilling water and freezing ice. Although freezers and refrigerators are also used for chilling drinking water and ice in the Residential sector, we did not consider this energy use since it is difficult to estimate this quantity of energy as a fraction of all energy consumed in these categories. However, this omission is unlikely to affect our results since this energy consumption is relatively small in comparison to other water-related, energy-consuming activities.
The Commercial and Industrial sectors use a significant fraction of their energy for generating steam in boilers. This energy was generally assigned to the direct steam use and/or the indirect steam use categories, depending on the nature of the steam use. Process heating and boilers consume a large fraction of US industrial energy use to provide hot water (generally 250 °F) and steam (generally 350–400 °F). The DOE estimates that 34% of 1994 Industrial sector energy was consumed to produce steam [27]. This energy use was considered in the indirect steam use category unless boiler steam or hot water was injected directly into a process [26]. Twelve per cent of the nation's 4.7 million commercial buildings are served by boilers that consume approximately 1.6 quads of primary energy in the sector, the majority of which are fueled by natural gas [26]. While industrial boilers tend to drive large industrial applications such as power generation, industrial process, and district heating with steam, commercial boilers are used primarily to provide hot water for space heating (2/3 of commercial boilers) and hot water (1/3 of commercial boilers) for buildings such as hospitals, food service, office buildings and apartment buildings [26]. Consequently, the majority of commercial boilers are used in colder regions of the US. Hot water production by boilers is included in as a direct water service, while space heating is considered in the indirect steam use category. Water-related energy in the Industrial sector. The EIA's Manufacturing Energy Consumption Survey (MECS), the authoritative data set on the manufacturing industry, was last published in 2006, so the nine 2010 energy consumption categories we analyzed are reference case estimates documented in the 2011 EIA Annual Energy Outlook [25]. More detailed energy data for industrial processes are not generally available since most industries consider their energy consumption proprietary, so more uncertainty was generally assigned to activities in this sector. Consequently, assignments made in the Residential and Commercial sectors tended to be more straightforward than those made in the Industrial sector. Residential and Commercial water heating energy data, for example, are explicitly reported by the EIA [17, 18], whereas the energy consumed for on-site water treatment and pumping in manufacturing industries had to be estimated based on white papers, industry reports, boiler inventories, and correspondence with industry experts [9, 27–34]. Water-related energy in the power generating sector. We characterize the energy consumed by all steam-driven power generators contained in the 2010 DOE/EIA Form EIA-923 inventory as indirect steam use since steam is used for electricity generation. Steam-driven power generation technologies represented 75.5% of approximately 40 quadrillion BTUs (1 quadrillion BTUs= 1 quad) of total primary energy consumed in the US Power sector in 2010. These technologies include steam turbines, the steam portion of combined-cycle systems, and combined-cycle single-shaft combustion turbines and steam turbines that share a single generator (representing 74%, 0.8%, and 0.6% of total 2010 US primary energy consumption for electric generation, respectively) [22].
A small fraction of energy consumed by the Power sector is allocated to the direct water services category. This fraction includes energy for pumping and pressurizing cooling water, which is used to extract heat from steam after it exits the turbine. Based on interviews with industry experts, we estimate that this amount is less than half of a generator's internal plant energy use [35]. (This energy use is included in the industrial sector of figure 3, rather than in the electricity generation portion of the figure since this quantity of energy is generated and consumed on-site, rather than sold as retail electricity. It reflects the general US electricity mix, which is why there is a small quantity of nuclear fuel consumed in the industrial sector of figure 3.)
Electricity consumption for pumped storage systems was also considered since pumped storage systems move water from lower elevations to higher elevations when electricity demand and price are low, so that it can be released through turbines during periods of high demand to generate electricity. The US consumed 29.5 billion kWh for pumped storage in 2010 in order to generate 25.5 billion kWh, resulting in a net electricity consumption of 4.09 billion kWh (36 trillion BTUs of primary energy) [22]. (Although pumped storage systems are net-electricity consumers, they are valuable load balancers in times of high electricity demand.)
To avoid double counting electricity generated in the Power sector and sold to the Residential, Commercial, Industrial and Power sectors, we summed all electricity consumed for direct water-related services in these four sectors (5364 trillion BTU) and multiplied this value by 75.5% to determine what quantity of this retail electricity was generated in the Power sector using steam-driven technologies (4050 trillion BTU). We included this quantity as a negative value in table 3 so that this energy would not be double counted in the tally of steam-driven power generation in the power sector. The remaining 1314 trillion BTU was assumed to be provided by non-steam-driven power such as hydropower, natural gas turbines, wind, and solar photovoltaics. (See figure 2 for clarification.) Uncertainty assignments. To account for error, we assigned an uncertainty value to each water-related, energy-consuming activity. (For example, we assigned a 20% error to our estimate regarding the water-related energy consumption for Residential Space Heating and repeated for every energy-consuming activity listed in table 2.) Uncertainty estimates only considered the anticipated error in our prescribed estimate of water-related energy and did not assign any value of error to the original data reported by EIA. We calculated total uncertainty in the analysis, Utot, for the energy embedded in direct water services and direct steam use with the relationship  , where, ui,j, refers to the uncertainty in each energy-consuming category, j, of sector category, i. We repeated this methodology to calculate the uncertainty associated with the indirect steam use category. Table 3 details the resulting uncertainty in each end-use sector after all energy-consuming activities were considered, as well as the total uncertainty embedded in the analysis. (Note: since the equation for uncertainty is not additive, the total error embedded in the analysis is not the sum of the individual end-use categories.) The uncertainty assignment for each energy-consuming activity can be found in the supporting information (available at stacks.iop.org/ERL/7/034034/mmedia).
Table 3. Total energy use in the direct water services and direct steam use categories was approximately 12.3 quadrillion BTUs in 2010. An additional 34.1 quads of energy was consumed in the indirect steam use category for on-site electricity generation, indirect process heating and space heating. Note: direct water and steam services is the sum of the direct water service and the direct steam use categories, which are individually listed in the supporting document (available at stacks.iop.org/ERL/7/034034/mmedia).
| Category | Description | Water-related energy consumption by primary fuel [trillion BTU] | |||||||
|---|---|---|---|---|---|---|---|---|---|
| Coal | Natural gas | Oil | Renewable/other | Sub-total | Primary energy for purchased electricity | Total energy use | Error | ||
| Residential | Direct water and steam services | 0 | 1472 | 191 | 5 | 1 668 | 2802 | 4 470 | ±70 |
| Indirect steam use | 20 | 395 | 231 | 22 | 668 | 0 | 668 | ±100 | |
| Commercial | Direct water and steam services | 0 | 737 | 283 | 9 | 1 029 | 1812 | 2 841 | ±96 |
| Indirect steam use | 53 | 849 | 180 | 0 | 1 082 | 0 | 1 082 | ±162 | |
| Industrial | Direct water and steam services | 252 | 2366 | 1422 | 60 | 4 100 | 714 | 4 814 | ±324 |
| Indirect steam use | 753 | 1838 | 1396 | 96 | 4 083 | 0 | 4 083 | ±373 | |
| Power | Direct water and steam services | 96 | 10 | 2 | 50 | 158 | 36 | 194 | ±19 |
| Indirect steam use | 19 662 | 2058 | 365 | 10 249 | 32 334 | −4050 | 28 284 | ±1616 | |
| Total | Direct water and steam services | 348 | 4585 | 1898 | 124 | 6 956 | 5364 | 12 319 | ±346 |
| Indirect steam use | 20 488 | 5140 | 2172 | 10 367 | 38 167 | −4050 | 34 117 | ±1670 | |

Figure 2. Approximately 46.4 quads of 2010 US annual energy consumption was used for water-related purposes. The majority of this energy (33.1 quads) was used to make steam for electricity, space heating and industrial process use. Only 12.3 quads of energy was used for direct water services (i.e. 8.2 quads for heating, chilling, treating, pressurizing and pumping water) and direct steam use (i.e. 4.1 quads for direct steam-injection, steam stripping, etc).
Download figure:
Standard image3.3. Reporting results
Direct water-related energy included in the direct water services and direct steam use categories was summed across sectors and fuel-types and incorporated into a flow diagram that considers energy-conversion losses at the point of electricity generation, transmission and distribution, and end-use (see figure 3 and equation (4)). These efficiencies consider the average efficiency of US generation in 2010 based on average heat rates reported in [25], average transmission and distribution losses across the grid [36], and end-use efficiencies of water-related devices and processes. The distribution of primary fuels for power generation in figure 3 was assumed to mirror the average distribution of fuels consumed for US electricity generation in 2010 as reported in [25]. (On a primary energy basis this distribution is as follows: coal 47%, natural gas 19%, petroleum 1%, nuclear 21% and renewables 11%.) These assumptions are discussed further in subsequent sections. Water-related energy consumption considered in the indirect steam use category is not included in the figure.

Figure 3. This diagram summarizes the water-related energy flows in the United States included in the direct water services and direct steam use categories. Primary fuels (on the left) are used directly and indirectly via electricity generation for different purposes (on the right). The thickness of the flows is proportional to the amount of energy consumed. About 58% of the total energy consumption is lost as waste heat. Note: the 5.4 quads used for electricity generation only includes retail electricity sold to residential, commercial and industrial customers; the primary energy consumed for electricity generated and used on-site is included in the sector where it was generated.
Download figure:
Standard image4. Results and discussion
Our analysis indicates that direct water-related energy consumption (i.e. energy considered in the direct water services and the direct steam use categories) was 12.6% (12.3 ± 0.346 quads) of 2010 national primary energy consumption. (Total primary energy consumption was 98.0 quads for all sectors (including transportation) in 2010 [16].) Approximately 8.2 quads of energy was consumed for direct water services (see equation (1)) and about 4.1 quads were consumed in the direct steam use category (see equation (2)). An additional 34.1 quads of energy was consumed for indirect steam use. Figure 2 summarizes the energy used in each of these three categories.
Table 3 details the water-related energy consumption in each of the end-use sectors analyzed. Although water-related energy in the transportation sector was not included in the analysis, the majority of the energy consumed in this sector is for petroleum-based transportation fuels, which would not be considered within the scope of the analysis. An exception would be fuel consumed for the transportation of water products, but this energy consumption is not likely to be large.
Figure 3 summarizes the 12.3 quads of water-related energy flows in the US for the direct water services and direct steam use categories (Note that the indirect steam use category is not included). Primary fuels (on the left) are used directly and indirectly via retail electricity generation for the three end-use sectors (on the middle-right). The thickness of the flows is proportional to the amount of energy consumed. In order to visualize primary retail electricity used in the Residential, Commercial and Industrial (which includes Power) sectors, primary electricity data from the EIA were proportioned to reflect the distribution of primary fuels consumed to generate net US electricity in 2010 as reported in the EIA's Annual Energy Review [25]. Losses at the point of electricity generation were calculated using a normalized average national 2010 net heat rate of HRavg = 8830 BTU kWh−1 [25]. (Heat rate is weighted based on 2010 heat rates for fossil-fuel and nuclear generators.) Approximately 56% (6955 trillion BTUs) of primary energy was burned directly for water; the remaining proportion (5364 trillion BTUs) was converted into electricity for retail sale and then used for water. As figure 3 indicates, much of the primary energy used in retail electricity production is lost as waste heat. National electricity production in 2010 was 38.5% efficient based on the aforementioned average national heat rate. Of the useful electricity generation, an additional 6%–8% is lost during transmission and distribution [36], but these losses are considered in figure 3 at the point-of-use, rather than at the point of electricity generation.
Heating water consumed nearly three-fourths of the Residential sector's and approximately one-third (35%) of the Commercial sector's direct water-related energy, respectively. (Note that the proportions highlighted in the blue boxes of figure 3 reflect energy consumption at the point-of-use and do not include energy losses at the power plant. See the supporting information (available at stacks.iop.org/ERL/7/034034/mmedia) for details regarding the total primary energy use for each energy-consuming activity.) On-site water pumping was relatively low in the Residential sector, in comparison to the Industrial and Commercial sectors, as housing units tend to be smaller. Residential water systems often operate off the prevailing pressure of the water distribution network, so often times pumps are not needed at all. Large industrial facilities and high-rise buildings, by contrast, tend to require large quantities of energy to move water around on-site.
Determining the average efficiency of each end-use sector required additional engineering assumptions as national data sets do not detail specific water-related processes and technologies when they report energy consumption data. We assume that electric power losses between the point of power generation and final end-use average 18% when average electric device end-use efficiencies are also considered. (This estimate assumes average transmission and distribution losses and 10%–12% losses at end-use based on [36, 37].)
For on-site primary energy consumption, we estimated efficiencies based on known, commercial-scale technologies. For example, according to the American Council for an Energy-Efficient Economy (ACEEE), average residential electric and natural gas water heaters are 90% and 60% efficient, respectively; those fueled by petroleum by-products (namely fuel oil and liquid petroleum gas (LPG)) are about 55% efficient [37]. The efficiency rating of a particular water heater varies based on the effective transfer of thermal energy from the heating element to the water, energy losses during storage, and the energy consumed by the device by switching between active and idle modes and does not include power plant losses or distribution losses. Additional energy losses occur during the conveyance of water from the water heater to the point-of-use at a particular appliance within the home or facility. However, these losses vary a great deal depending on piping network characteristics such as total pipe length, geometry and insulation properties, and the ambient temperature around the pipe. Commercial water heating efficiency varies considerably depending on the facility. Some highly efficient commercial facilities have natural gas water heaters approaching 75%, while less-efficient facilities are comparable to average residential water heaters.
For the purpose of this analysis, we assume that the average end-use efficiency of non-electric energy consumption in the Residential, Commercial and Industrial/Power sectors were 55%, 65% and 45%, respectively. We base these assumptions on the premise that Residential and Commercial sector water-related energy consumption is dominated by water heating (discussed above), while the energy consumed in the Industrial and Power sectors is mainly in boilers to make steam and generate electricity. Although, non-steam processes and devices in the Industrial and Power sectors tend to be more efficient than in the Residential and Commercial sectors due to economies of scale, these processes consume much less energy than industrial steam boilers.
The efficiency of any boiler is sensitive to its size, age and fuel type. New boilers typically fall in the range of 60%–85% efficient [27, 38]; however, two-thirds of large, industrial boilers are greater than 30 yr old and have much lower efficiencies [26]. Efficiencies for electricity generation technologies in the industrial sector vary by technology but are generally in the range of 15% (for simple-cycle wood boilers) to 51% efficient for combined-cycle applications [38]. Based on the literature [26, 27, 33, 38], we chose an average end-use efficiency for the Industrial/Power sector of 45% as a conservative estimate.
Energy losses at the point of electricity generation, transmission and distribution, and end-use are represented by the quantity 'rejected energy' in figure 3. This quantity represents 58% of the total primary energy that was consumed for water-related purposes in 2010. It is important to note that this quantity reflects broad estimates about the average efficiency of each sector's water-related energy processes, which are extremely diverse, and is therefore subject to uncertainty.
Useful observations can be derived from these general trends. Firstly, economies of scale, such as those in the Industrial sector and large commercial facilities, are typically more efficient than those that are smaller in scale, such as individual households. Secondly, when considering end-to-end efficiency, it is much less energy-intensive to heat water by direct use of natural gas on-site, rather than by using that natural gas to first make electricity that is used to heat water because of the large conversion losses at power plants [39]. From the perspective of displacing fossil-fuel use, solar thermal water heater systems are even more advantageous.
5. Conclusion
This analysis is the first to quantify water-related energy consumption in the US Residential, Commercial, Industrial and Power sectors, that differentiates consistently between primary and secondary uses of energy-for-water, incorporates the relative efficiencies for power plants and direct use, integrates the most recent primary data and statistics collected by relevant agencies, and allocates embedded energy from a broad range of relevant appliances and functions.
Results indicate that the energy embedded in the US water system represents 12.3 ± 0.346 quads (12.6%) of national primary energy consumption in 2010. To put this result in context, 12.3 quads of energy is the equivalent annual energy consumption of roughly 40 million Americans [40]. We estimate that 5.4 quads of this primary energy (611 billion kWh delivered) were used to generate electricity for pumping, treating, heating, cooling and pressurizing water in the US, which is approximately 25% more energy than is used for lighting in the Residential and Commercial sectors [40]. (Despite this equivalency, much more policy attention has been invested in energy-efficiency for lighting, rather than reducing hot water consumption or investing in energy-efficient water heating methods, even though the latter might have just as much impact.)
Future analyses will assess the opportunities for carbon and energy reductions by water-conservation efforts, efficiency improvements, and new technologies. They will also include the increasing role of the bottled water industry which has large energy and carbon implications that were not explored in this analysis [41]. Additionally, future work will aim to identify a general framework for characterizing the energy and carbon intensities of water systems based on regional variability in geography, climate and policy frameworks. This extension of the analysis will become increasingly significant as population growth, water-scarcity and increasing drinking water quality standards force regional planners to identify solutions for ensuring adequate drinking water to the US population without exacerbating energy and carbon expenditures.
Acknowledgments
This work was sponsored by the Energy Foundation and the Cynthia and George Mitchell Foundation. We also thank Gary Klein for his insight and expertise.