
Abstract
The temperature sensitivity of the snowfall season (start, end, duration) over northern Eurasia (the former USSR) is analyzed from synoptic records of 547 stations from 1966 to 2000. The results find significant correlations between temperature and snowfall season at approximately 56% of stations (61% for the starting date and 56% for the ending date) with a mean snowfall season duration temperature sensitivity of −6.2 days °C−1 split over the start (2.8 days) and end periods (−3.4 days). Temperature sensitivity was observed to increase with stations' mean seasonal air temperature, with the strongest relationships at locations of around 6 °C temperature. This implies that increasing air temperature in fall and spring will delay the onset and hasten the end of snowfall events, and reduces the snowfall season length by 6.2 days for each degree of increase. This study also clarifies that the increasing trend in snowfall season length during 1936/37–1994 over northern European Russia and central Siberia revealed in an earlier study is unlikely to be associated with warming in spring and fall seasons.
Export citation and abstract BibTeX RIS

Content from this work may be used under the terms of the Creative Commons Attribution 3.0 licence. Any further distribution of this work must maintain attribution to the author(s) and the title of the work, journal citation and DOI.
1. Introduction
The potential for detecting a climate change signal using trend analysis in historical records is affected by natural climate variability, the sensitivity of the variable to climate warming, spatial averaging, the time period of available records, instrumentation changes, inconsistencies in observation practices, station relocations, and other human-related environmental factors (Callaghan et al 2011, Groisman et al 2006, Huntington 2006, Hurrell 1995, Solomon et al 2007). Another way to understand potential changes that are associated with climate change is to examine their relationships with air temperature directly (Ye 2008). Instead of using the year as the independent variable in the simple linear regression analysis for trend determination, the temperature is the independent variable. This method can be called temperature sensitivity analysis because the product is the rate of change per degree of air temperature increases. Like trend analysis, this approach holds that past relationships may shed light on future ones. Given solid evidences of overall increasing global surface air temperatures based on observations Jones and Moberg (2003) and projected by general circulation models (Alley et al 2007, Meehl et al 2005), temperature sensitivity analysis is a valuable tool to predict future changes associated with a warming climate.
Snow is the dominant type of winter precipitation and contributes a significant portion of precipitation events in spring and fall over northern Eurasia (Bulygina et al 2011, Ye 2008, Ye et al 2008). Studies have indicated that snow accumulation has been increasing throughout the historical records since 1936 up to 1995, possibly associated with significant warming of winter temperatures (Ye et al 1998, Ye 2000, 2001a). On the other hand, snow cover has been decreasing during 1956–1991 (Groisman et al 2006) and during 1966–2007 (Bulygina et al 2009), but increased during 1966–1990 and 1936–2000 (Kitaev et al 2004, 2006). These different results are likely specific to corresponding time periods that may have been associated with different seasonal temperature trends. Among all snow-related variables, snow cover duration is considered most sensitive to temperature change (Brown and Mote 2009).
An early study revealed trends of earlier snowfall starting and later snowfall ending dates and thus increased snow season length over northern European Russia and Siberia during 1936/37–1994 (Ye 2001b). However, the continuous snow cover length has not changed much during the same period (Ye and Ellison 2003). These results seems to be consistent with the fact that no significant increasing temperature trends are found during the same time period (Groisman et al 2006) due to warmer periods in the late 1930s followed by cooling in the 1960s–1970s and warming that only started in the 1980s in the Arctic region (Lugina et al 2005). Studies suggest that the period from 1980 has been characterized by widespread reductions in snow cover duration in response to later onset and earlier melt (Callaghan et al 2011, Radionov et al 2004). The warming that started in the 1980s also seemed to match the reversed trend in snow starting and ending dates and season length at the end of the time series at some stations shown in figure 5 of Ye (2001b). Thus, the results of these trends may not be interpreted as corresponding to a warming background.
In light of the complex results of snow conditions derived from varying time periods of study against the background of varying temperature trends and to clarify the interpretation of snowfall season trends in Ye's earlier (2001b) study, there is a need to adopt temperature sensitivity analyses to quantify the relationships to air temperature changes. This study uses 3-hourly synoptic observations of 547 stations across northern Eurasia (the former Soviet Union region) during 1966–2000 to assess and quantify the relationships of snowfall duration with air temperature.
2. Data and methodology
The data set used was the Global Synoptic Climatology Network, C: the former USSR, available from the National Climatic Data Center (NCDC 2005). It is the compilation of in situ hourly meteorological observations for the former USSR until January of 2001. The synoptic observation records include sea level pressure, station pressure, air temperature, vapor pressure, relative humidity, wind speed, wind direction, cloud cover and types, and weather condition. The weather condition has codes to indicate many varieties of precipitation types. This study extracts days that have at least one daily observation indicating the occurrence of solid precipitation (snow, snow shower, ice pellets, snow grains, or diamond dust) to identify the starting date and ending date of the snowfall season for each hydrological year. Using synoptic weather codes and multiple observation times per day, this study is less likely to miss solid precipitation events than earlier studies that used snow depth records that were measured only once per day, thereby missing some snowfall events that stayed on the ground for less than 24 h.
This study utilizes the time period starting from 1966 when regular 8-times daily observations based on local time zone were recorded. This avoids inconsistent changes in observation times and the number of observations per day among stations during earlier time periods which could lead to a bias in our results.
There was a potential problem with weather code '0' at some stations, which is normally used to indicate no weather; however, there is the possibility that missing values in weather codes are also labeled as '0' at some stations (NCDC 2005). Since it is difficult to distinguish missing weather observations from no weather condition, we use the air temperature observation as a safe guard. If the air temperature value was labeled as missing and the weather code was '0', we assume this was a missing value for that observation time. Because these observations were made manually, if the person was not able to make it to the station to do a reading of air temperature, it is likely that he or she would not have recorded the weather condition either.
The snow starting date is defined as the day when the first solid precipitation event is recorded after July. The snow ending date is defined as the day when the last solid precipitation event is recorded before July each year. Both dates are converted into Julian days from 1 to 365 or higher if the first snowfall occurred after December, which is uncommon. The length of snowfall season is calculated by 365 (or 366 for a leap year) minus the starting Julian day of the previous fall and adding the ending Julian day of the current spring. To determine what months should be considered as transitional snow onset and ending seasons, there are two methods we can adopt. The simpler method is to use September–November as fall and March–June (so as to include some later season snow events in colder regions) as spring transitional months for all stations. Another method is to define a window, specific to each station based on the range of dates when snowfall starts and ends. More specifically, for example, for snow onset season in fall, the month when the earliest snowfall date occurred during the 35 year study period is used as the starting month, and the latest observed snowfall occurrence month is considered as the ending month. There were a few occasions, at about 4 stations when the last snowfall day occurred on 1–2 July, but since there are only 1–2 events of snowfall in July over the entire study period, June is considered as the last month of snow ending transition season for these stations. Then the mean temperature averaged over these windows for each station is considered as spring and fall temperature in the analyses. If more than 10% of observations are missing, the temperature is considered as missing for the month, and thus missing for the season. Finally, 547 stations are retained for this study, having available records ranging from 25–35 years.
These starting and ending snowfall date time series are correlated with corresponding seasonal air temperatures. The snowfall season length is correlated with the average of the current spring and previous fall air temperatures. In addition, a simple linear regression is applied using snow date (day) as a dependent variable, and the air temperature as the independent variable to derive the rate of change per degree increase in air temperature for each snow date (or length) time series at each station. The authors have used both methods in calculating spring and fall seasonal air temperatures. The results from the correlation analyses are very similar using these two methods, with those of specific window definition producing slightly more significant stations, and thus selected for use in this study.
3. Results
The mean date of the first snowfall ranges from 3 September (Julian day 246) to 8 December (Julian day 343) among 547 stations during 1966–2000. Earlier snowfall occurred over northeastern Siberia at around the middle of September (Julian day 260) and was delayed towards the southern and coastal areas with the latest occurring over southern European Russia in late November (figure 1(a)). The range between the earliest and latest snowfall start date for each station varies from 12 to 114 days and seems to be larger in the southern and southwest regions where mean snowfall start date is later (figure 2(a)). As a result, the fall transitional season's air temperatures are averaged from 1 to 4 months from August to December determined by each station.
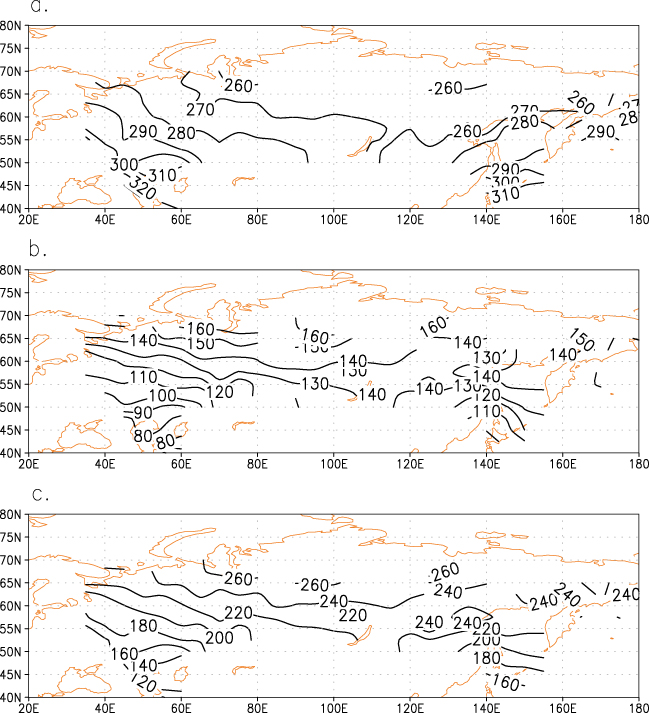
Figure 1. Distribution of the mean (a) first snowfall, (b) last snowfall, and (c) length of the snowfall season for the years 1966–2000.
Download figure:
Standard image
Figure 2. Distribution of the range of transitional snowfall season length defined by the difference between the latest and the earliest snow date of (a) onsets (fall season); (b) ends (spring season) during 1966–2000 for each station. The window length of seasonal air temperature for each station is determined by these ranges.
Download figure:
Standard imageThe average date of last snowfall ranges from 27 February (Julian day 58) to 27 June (Julian day 178) among these 547 stations during the study period. The earliest last snowfall dates occurred over southern European Russia around late March (Julian day 80–90) and increased towards the north and northeast to around the middle of June (Julian day 160) (figure 1(b)). The range of the earliest to the latest last snowfall event is from 8 to 101 days among these stations (figure 2(b)). Again, the southern region has a larger inter-annual variation in last snowfall day, thus a longer transitional spring snowfall season. The spring seasonal air temperatures are averaged from a range of 1–4 months varying from January to June depending on the station.
The snowfall season length is the shortest over southern European Russia varying between 120 and 140 days and increases toward the north and northeast reaching about 260 days or longer over northern and eastern Siberia (figure 1(c)). Compared to the climatology of the number of days when more than half the ground is covered by snow (Groisman et al 2006), the northern region is very similar, but the snowfall season length is much longer than the snow cover season in the southern region and European Russia.
The correlation coefficients between fall surface air temperature and the snow starting date are predominantly positive (at 98.2% of stations; figure 3(a)). Among the 332 stations (61%) that are statistically significant, 226 have a significant level of 0.01 or lower and 117 have a significant level of 0.05–0.01 and all are positive correlations (table 1). On the other hand, the correlation between spring air temperature and snow ending date are predominantly negative (at 97.8% stations; figure 3(b)). Among them, 185 have a significant level of 0.01 or lower and 119 have a significant level of between 0.05 and 0.01 (table 1), with a total of 56% of stations that are statistically significant. Consequently snowfall season length is negatively correlated with the mean temperature of spring and fall at a similar level of significance (figure 3(c); table 1). The results clearly indicate that increasing air temperature will delay the snowfall starting date and lead to an earlier snowfall ending date, thus shortening the snowfall season over northern Eurasia. Also, it is worth noting that insignificant stations are mostly located in inland eastern Siberia. This seems to confirm Brown and Mote's (2009) finding that snow cover duration in the colder inland continental interior shows the lowest temperature sensitivity.
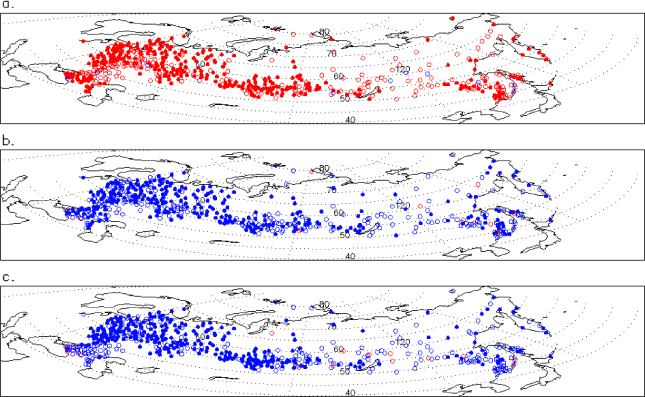
Figure 3. Distribution of correlation results between (a) snow starting date and fall air temperature; (b) snow ending date and spring air temperature; (c) snowfall season length and the mean of spring and fall air temperature. Red: positive correlation; blue: negative correlation; filled circles are statistically significant at 0.05 or lower; open circles are not significant (higher than 0.05).
Download figure:
Standard imageTable 1. Statistics of correlation results, indicated by the number of stations, between air temperature and starting snowfall date, ending snowfall date, and snowfall season length.
| Significant level | Starting date | Ending date | Season length | |
|---|---|---|---|---|
| Positive correlations | 0.01 or lower | 226 | 0 | 0 |
| 0.05–0.01 | 106 | 0 | 0 | |
| Not significant | 205 | 12 | 15 | |
| Negative correlations | 0.01 or lower | 0 | 185 | 187 |
| 0.05–0.01 | 0 | 119 | 119 | |
| Not significant | 10 | 231 | 226 |
The rate of delaying snowfall starting date per 1 °C increase in the fall temperature ranges from 1.1 to 8.0 days among the statistically significant stations, with an average of 4.3 days (figure 4). If all stations are included, the average is 2.8 days. In addition, the rate of change increases with increasing stations' fall air temperatures. Furthermore, given the same fall air temperature, for statistically significant stations the length of the delay in snowfall is greater with increasing temperatures.
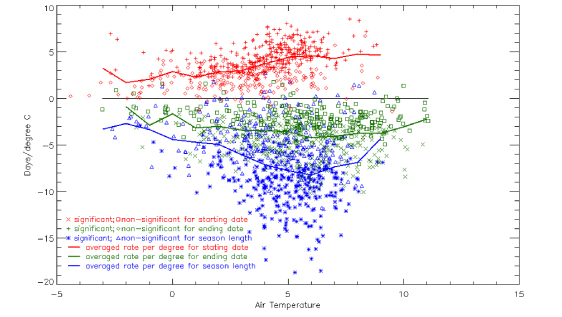
Figure 4. Temperature sensitivity (days °C−1) of snowfall start (red), end (green), and duration (blue) for the years 1966–2000.
Download figure:
Standard imageThe rate of earlier last snowfall with each degree of spring air temperature increase ranges from 2.1 to 10.9 days, with an average of 5.3 days for statistically significant stations (figure 4) and the average is 3.4 days for all stations. The magnitude also increases with stations' spring air temperature until it reaches about 6 °C, and then levels off. The rate of shortened snowfall season ranges from 0 to 21 days, with an average of 9.4 days for negatively statistically significant stations (figure 4) and 6.2 days for all stations.
To have a clear view of these relationships at the individual station level, the time series are plotted at a station (Mozajsk at 55.5N and 36.0E, elevation 185 m) randomly selected from those that have the fewest missing years and showed significant relationships (figure 5). The fall air temperature and snow starting date shows a synchronized pattern of inter-annual variability in most year, with a correlation coefficient of 0.6158 over 35 years (figure 5(a)). The time series of spring air temperature and snow ending date has an opposite inter-annual variability showing negative correlations, with a correlation coefficient of −0.6160 over 35 years (figure 5(b)). The mean fall and spring air temperature and snowfall season length also exhibit an opposite pattern of correlation coefficient of −0.6961 over 34 hydrological years. They are all statistically significant at 0.01 or lower. No significant trends in either spring or fall air temperatures or snow dates (length) are found at this station for the study time period of 1966–2000.

Figure 5. Time series of (a) snow starting date and fall air temperature; (b) snow ending date and spring air temperature; and (c) the length of snowfall season and the averaged fall and spring temperature for the station at Mozajsk (55.5N, 36.0E). Air temperature shown by dashed line and snow dates (length) shown by solid line.
Download figure:
Standard image4. Summary
This study uses daily synoptic records at 547 weather stations over northern Eurasia to identify snowfall starting and ending dates, and to quantify their associations with surface air temperatures. It is clear that increasing air temperature is associated with shortened snowfall season by delaying the onset of the first fall snowfall and by hastening the last snowfall day of the season in northern Eurasia. For each degree of air temperature increase in the fall, snowfall is delayed an average of about 2.8 days and up to 8.0 days for all stations. For each degree of spring air temperature increase, last snowfall event occurs earlier on average of 3.4 days and up to 10.9 days. As a result, for each degree of averaged spring and fall air temperature increase, the average snowfall season is shortened an average of 6.2 days, and up to 21 days over northern Eurasia. The rate of change also increases with a station's air temperature and reaches maximum at about 6 °C.
Change in snow condition is a result of the delicate balance between the air temperature and precipitation. The present trend of increasing snow accumulation is a transient state of warming climate over the Arctic region and the trend will switch in the opposite direction if air temperature continues to increase (Ye and Mather 1997). Similarly, the increase in snowfall days switches to a decreasing trend when winter season air temperature reaches −8 °C or above (Ye 2008). Results from this study suggest that the snowfall season length seems to be consistent with air temperature variation throughout the current range of temperature conditions over the study region. Therefore, we would not expect to see a pattern of snowfall season length similar to that of snowfall amount and frequency, which increases with air temperature initially and then eventually decreases with air temperature, as the warming continues. Thus, it verifies Ye's speculation (2001b) that increasing snowfall season length during 1936/37–1994 'may be consistent with surface air temperature changes in general'. During the time period covered in Ye's (2001b) research, surface temperature changes have 'not been monotonic' and 'Arctic warming was absent' (Groisman et al 2006). Earlier snow cover formation along the entire Eurasian coast was consistent with negative autumn air temperature trends based on station data analyses at Arctic coastal and island stations during 1951–2002 (Radionov et al 2004). The warming at high latitudes only commenced in the 1980s (Groisman et al 2006, Lugina et al 2005) and it was reflected in a trend reversal shown in the time series at some stations beginning in the late 1980s (Ye 2001b).
With projected air temperature increases of 4–6 °C in this region by 2090–2099 (Alley et al 2007, Trenberth et al 2007), the average snowfall starting date would be delayed by 11–17 days, the snowfall season would finish earlier by 14–20 days, and the snowfall season would be shortened 25–37 days. This does not take into account possible higher change rates at some stations as their mean seasonal temperatures increase. These changes would have significant consequences for the hydrological cycle, permafrost thawing, carbon cycle, atmospheric circulation, and ecosystems.
Acknowledgments
This research is supported by NSF grants BCS-1060788 for the first author and BCS-1060323 for the second author. The authors appreciate the two anonymous reviewers' valuable comments to improve this paper.