
Abstract
Upward migration of plant species due to climate change has become evident in several European mountain ranges. It is still, however, unclear whether certain plant traits increase the probability that a species will colonize mountain summits or vanish, and whether these traits differ with elevation. Here, we used data from a repeat survey of the occurrence of plant species on 120 summits, ranging from 2449 to 3418 m asl, in south-eastern Switzerland to identify plant traits that increase the probability of colonization or extinction in the 20th century. Species numbers increased across all plant traits considered. With some traits, however, numbers increased proportionally more. The most successful colonizers seemed to prefer warmer temperatures and well-developed soils. They produced achene fruits and/or seeds with pappus appendages. Conversely, cushion plants and species with capsule fruits were less efficient as colonizers. Observed changes in traits along the elevation gradient mainly corresponded to the natural distribution of traits. Extinctions did not seem to be clearly related to any trait.
Our study showed that plant traits varied along both temporal and elevational gradients. While seeds with pappus seemed to be advantageous for colonization, most of the trait changes also mirrored previous gradients of traits along elevation and hence illustrated the general upward migration of plant species. An understanding of the trait characteristics of colonizing species is crucial for predicting future changes in mountain vegetation under climate change.
Export citation and abstract BibTeX RIS

Content from this work may be used under the terms of the Creative Commons Attribution 3.0 licence. Any further distribution of this work must maintain attribution to the author(s) and the title of the work, journal citation and DOI.
1. Introduction
Many species in mountains have shifted their upper distribution limit upslope in recent decades, resulting in an increase in species richness at high elevations. This was recorded in long-term monitoring studies of summit flora in the Alps and the Scandes during the 20th century (see Stöckli et al 2011 for a review), and recently, such increases have also been observed over shorter time periods (Pauli et al 2007, 2012). Although some authors attribute this species enrichment to a re-colonization process after the Little Ice Age (Kammer et al 2007), climate warming is generally considered to have been the main driver (Grabherr et al 1994, Pauli et al 2007, Vittoz et al 2008, Walther et al 2005). Simultaneously with the upward shift of species, a decline in cold-adapted species is expected (e.g. Dullinger et al 2012), but has only rarely been observed to date (Klanderud and Birks 2003, Pauli et al 2007).
Colonization depends on both the dispersal ability of a species and the local ecological conditions, which act as filters on plant establishment, selecting for those species with traits suitable for the site's local conditions (Guisan and Rahbeck 2011). In the context of climate change, identifying the plant traits of newly appearing or disappearing species therefore helps us to understand these selection processes, which is important for predicting future species assemblages. For example, some studies have shown that traits related to wind dispersal play an important role in the successful colonization of alpine habitats (Holzinger et al 2008, Stöcklin and Bäumler 1996), and species with diaspores which enhance long-distance dispersal (Vittoz et al 2009) have been found to be particularly successful. Moreover, Vittoz et al (2008) and Gottfried et al (2012) observed that more thermophilous species appear, recently, to be colonizing cold, alpine habitats.
In mountains, trait distribution varies along elevational gradients (Pellissier et al 2010), especially traits related to life form and reproduction, e.g. pollen vector and diaspore dispersal. Hence, the traits of successful colonizers are likely to differ with elevation as well, but limited sample sizes have prevented verification studies. Similarly, until now, it has been unclear which plant traits are related to local extinctions.
Here, we use a large-scale revisitation study of 120 alpine summits located in the south-eastern Swiss Alps and spanning an elevational gradient of 1000 m (Wipf et al) to explore how plant traits relate to colonization and the extinction probability of species. Summits were re-inventoried in 2010 and 2011, and the floristic composition was compared to historical species lists from the early 20th century. An upwards shift in species maximum elevations and an increase in species richness could be identified (Wipf et al). Moreover, the majority of species had also become more frequent and had colonized more summits. We took advantage of this dataset to address the following questions: (1) do certain plant traits favour the colonization or the extinction of species under climate change, and (2) does the importance of these traits change along an elevational gradient?
2. Material and methods
2.1. Species data
A total of 120 summits in south-eastern Switzerland (figure 1) were revisited to record changes in floristic composition over the past century based on historical species lists (on average 102 years old). The summits are distributed across bedrock types (46 on limestone and 74 on siliceous rock) and across elevations between 2449 and 3418 m asl.
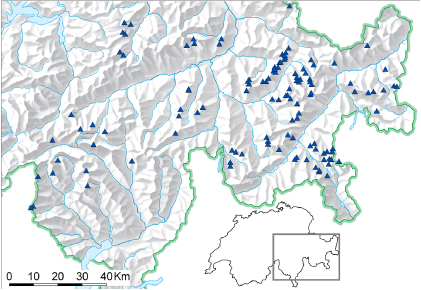
Figure 1. Location of the 120 re-surveyed summits in south-eastern Switzerland.
Download figure:
Standard image High-resolution imageThe historical data were judged to be highly reliable according to Stöckli et al (2011). They had been collected by qualified botanists to assemble complete species lists in a spatially restricted area, and thus can be regarded as presence/absence data. As in the earlier surveys, during the summers 2010 and 2011, all vascular plants within the uppermost 10 m were recorded without previous knowledge of the old data (Stöckli et al 2011; Wipf et al). 48 of the summits were simultaneously visited by two botanists. They worked completely independently and the longest species list was retained, considering that historical inventories were realized by highly skilled botanists. To avoid overestimating species turnover, doubtful identifications of difficult taxa (e.g. Festuca sp.) were excluded unless confirmed by the previous record, and pairs of similar species that differed between surveys were merged. The species nomenclature complies with Aeschimann et al (2004).
2.2. Plant traits
A total of twenty plant traits in three trait categories (species ecology, morphology and dispersal; table 1) were selected for their potential influence on whether a species colonized, established or became extinct. Traits related to ecology consisted of eight ecological indicator values (Landolt et al 2010), reflecting a species' requirements for climate (temperature, continentality, light) and soil conditions (moisture, pH, nutrients, humus content, aeration), as well as its sociological group (table 1). Morphological traits were the species life form, type of clonal growth, maximum height and plant strategy (competitive—stress tolerant—ruderal). Traits related to the dispersal ability of the species were reproduction type, pollen vector, fruit type, diaspore morphology, flowering duration, dispersal duration and diaspore mass. Trait values were gathered from the literature and databases (see table 1 for references). Where possible, missing values were extrapolated from closely related species. We measured the average diaspore mass of 36 plant species not present in the databases by weighing for each species a minimum of five viable, dry diaspores from three individuals in three populations (table S1, supplementary data available at stacks.iop.org/ERL/8/024043/mmedia). The final dataset contained <11% missing values per trait (NA), which we considered low enough for valid analyses.
Table 1. Plant traits considered in this study, classified into three categories, with the scale types, the states for the qualitative traits and the units for the quantitative ones.
| Category | Trait | Scale type | State or unit | References |
|---|---|---|---|---|
| Ecology | Temperature | Ordinal | From T1 (alpine-nival belt) to T5 (collinean belt) | Landolt et al (2010) |
| Continentality | Ordinal | From C1 (oceanic) to C5 (continental) | Landolt et al (2010) | |
| Light | Ordinal | From L1 (deep shade) to L5 (full light) | Landolt et al (2010) | |
| Soil moisture | Ordinal | From M1 (very dry) to M5 (flooded, i.e. submerged) | Landolt et al (2010) | |
| Soil pH | Ordinal | From R1 (extremely acid) to R5 (alkaline) | Landolt et al (2010) | |
| Nutrients | Ordinal | From N1 (very infertile) to N5 (very fertile and over-rich) | Landolt et al (2010) | |
| Humus content | Ordinal | H1 (little or no humus), H3 (moderate), H5 (high) | Landolt et al (2010) | |
| Soil aeration | Ordinal | A1 (bad, compacted or wet soils), A3 (moderate), A5 (good, loose, often rocky or sandy soils) | Landolt et al (2010) | |
| Sociological group | Categorical | ag (alpine grassland), mg (medium altitude grassland), forest, rs (rock and screes), other | Simplified from Landolt et al (2010) | |
| Morphology | Life form | Categorical | ChF (fruticose chamaephytes), ChR (reptant chamaephytes), ChS (suffruticose chamaephytes), ChC (cushion chamaephytes), ChSc (succulent chamaephytes), Geo (geophytes), HeC (caespitose hemicryptophytes), HeR (hemicryptophytes with rosette), HeS (stalked hemicryptophytes), Ph (phanerophytes and nano-phanerophytes), Th (therophytes) | Simplified from Pignatti (2005) |
| Plant strategy | Categorical | cc (competitor), cr (ruderal competitor), cs (stress-tolerant competitor), rs (stress-tolerant ruderal), ss (stress-tolerant) | Simplified from Landolt et al (2010) | |
| Clonal growth organ | Categorical | 0 (none), 1 (horizontal above-ground stem), 9 (epigeogenous stem—rhizome), 10 (hypogeogenous stem—rhizome), 14 (root-splitter) | Klimešová and de Bello (2009) | |
| Maximal height | Quantitative | cm | Aeschimann et al (2004) | |
| Dispersal | Reproduction type | Categorical | s (sexual only), ssv (mainly sexual, rarely vegetative), sv (sexual and vegetative), vvs (mainly vegetative, rarely sexual) | Klotz et al (2002) and authors' attributions |
| Pollen vector | Categorical | F (ferns, no pollen), in (insect only), j (insect and selfing), se (selfing), wi (wind) | Simplified from Klotz et al (2002); Aeschimann et al (2004); other references for isolated data | |
| Fruit type | Categorical | achene (including caryopsis and schizocarpe), capsule, fleshy, follicule, legume, no (no fruit, coniferous and ferns), siliqua | Simplified from Klotz et al (2002); authors' attributions | |
| Diaspore morphology | Categorical | awn (awn, hooks, calyx), fleshy, nude (no appendage), pappus, wings (wings or fringes) | Müller-Schneider (1986); Klotz et al (2002); Vogler (1901); authors' attributions | |
| Flowering time length | Quantitative | Number of months | Landolt et al (2010) | |
| Dispersal time length | Quantitative | Number of months | Müller-Schneider (1986) | |
| Diaspore weight | Quantitative | mg | Own measurements; Müller-Schneider (1986); Klotz et al (2002); Parolo and Rossi (2008); Vittoz et al (2009); other references for isolated data |
2.3. Analyses
For each species on each of the 120 summits, we assessed whether it had colonized (i.e. been historically absent but recently present) or become locally extinct (i.e. been historically present but recently absent) on the summit. We analysed whether a species trait affected the likelihood of colonizing or becoming extinct on a summit with generalized linear mixed models (GLMMs) with binomial error distribution using the package 'lme4' (Bates et al 2012) and the function 'glmer' in R 2.15.1 (R Core Team 2012). Any collinearity between explanatory variables had been previously identified by the 'corvif' function (package 'AED', Zuur et al 2009). As suggested by Booth et al (1994), pairs of traits with correlation coefficients >0.5 were considered collinear and the ecologically less meaningful variable was removed. Thus, the indicator values for light, continentality and soil humus content were discarded because they were collinear with temperature, soil moisture and soil aeration, respectively. The three categories of plant traits were analysed in separate GLMMs, with traits as fixed factors, and summit and species identity as random factors. The best models were selected through a stepwise backward selection. The interactions between summit elevation and traits were similarly tested with GLMM, but only traits significant in the first analyses were then retained.
Differences between traits were investigated by sum contrasts. The final models were visually validated on the basis of logistic regression quantile–quantile plots (calculated with 500 model runs and response residuals; Zuur et al 2009), and plots of working residuals against the significant explanatory variables.
For clarity of presentation in figures, we considered the proportion of each trait state on the total number of plant occurrences (excluding the NAs) in the historical and recent records, and among colonizers. Bar plots were produced to illustrate the changes in trait proportions. This involved dividing summits into three elevation categories of equal size (N = 40), corresponding approximately to the belt division of Gottfried et al (2011). The resulting belts were: lower alpine (2449–2802 m), upper alpine (2804–3006 m) and nival (3020–3418 m). Since continuous values for elevation were, however, used in the analyses, these limits are only indicative.
Summit shifts in a functional trait space was presented with a PCA based on mean trait values for quantitative traits and the proportion of trait states for categorical traits. For these latter traits, the less frequent state was skipped before analyses because of data redundancy (sum of state proportions is 100%). The significance of temporal shifts in functional trait space along the first three axes of PCA was tested by multivariate analysis of variance (MANOVA) by differences of axis scores among inventory dates against the intercept.
3. Results
The occurrence of a total of 315 species was recorded on the summits. As a result of comparison between historical and recent records, 1988 cases of local colonization and 777 of local extinction were identified, for a total of 4175 recent occurrences. As almost each trait state increased in absolute number, proportional decreases have to be interpreted as weaker increases. None of the traits appeared to have any significant effect on the extinction probability of a species.
The two first axes of the PCA based on trait means and proportions explained 25.7% and 17.4%, respectively (figure 2). Summits were approximately distributed along the 1st axis following elevation, with the highest summits dominated by stress-tolerant ruderal species and cushion chamaephytes on the left, and the lowest summits dominated by alpine grassland species, often with pappus on the diaspores, on the right. The second axis is related to elevation and reproduction, with mainly sexual reproduction, selfing and siliqua at the lower extremity, and mainly sexual and vegetative reproduction and rhizomes on high summits at the upper extremity (figure S1, supplementary data available at stacks.iop.org/ERL/8/024043/mmedia). Between both inventories, summits significantly shifted to the right, according a manova (P < 0.0001; figure 2).
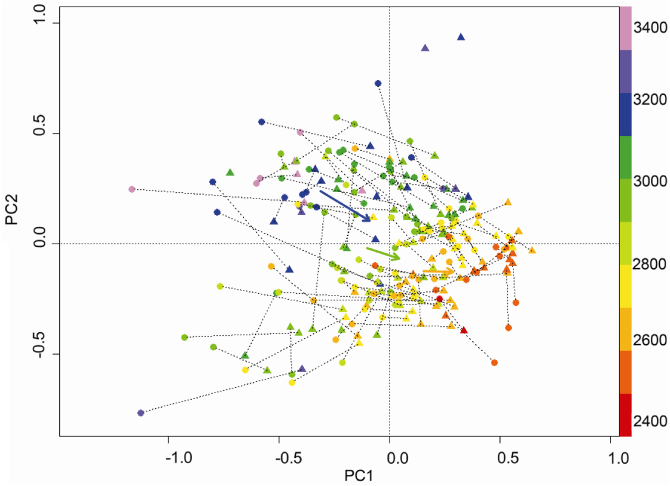
Figure 2. PCA of summits based on trait means and proportions of trait states of the present species. The two first axes explain 25.7% and 17.4% of the variance, respectively. Summits are represented by a circle (•) for their historical inventory and by a triangle (▴) for their recent inventory. Pairs of inventories are linked by a dotted line. Isolated triangles represent summits devoid of species in the historical inventory. Colours represent elevation, according to the scale on the right. The arrows shows the shift of centroides of lower alpine (orange), upper alpine (green) and nival (blue) summits. The position of the traits is given in figure S1 (available at stacks.iop.org/ERL/8/024043/mmedia).
Download figure:
Standard image High-resolution image3.1. Ecological traits
Traits indicating a species' ecological preference in terms of temperature, soil nutrient content, soil aeration, and their respective interactions with elevation had a significant effect on the colonization probability of a species (table 2; figure 3(a)). At lower elevations, the proportion of species originally from the subalpine and montane belt (T2 and T3) increased, while at higher elevations, lower alpine species (T1.5) increased most, and some montane species (T3) were also recorded. Alpine and nival species (T1) increased in frequency at all elevations (not shown), although proportionally they decreased. Most of the colonizing species were typical of infertile soils with a moderate to good aeration. However, at all elevations, the number of species indicating fertile soils (especially in the nival belt) and poor soil aeration slightly increased (figures 3(b) and (c)). Overall, the distribution of ecological indicator values on nival summits in recent times became more similar to that of lower alpine summits in historical times.
Table 2. Results of the final GLMM on the 20 traits subdivided into the three categories analysed separately (ecological, morphological and dispersal traits). Species characterized as fleshy for fruit type and diaspore morphology were not considered in the dispersal trait analysis because they corresponded perfectly. In the simple analysis, a stepwise backward selection was applied and the trait with the highest p-value was discarded at each step. Interactions with elevation were tested separately for each significant trait in the first analysis. The p-values for traits were derived from a F-statistic and the p-value for trait states from a t-statistic. Significant p-values (p < 0.05) are in bold, and marginally significant ones (p < 0.1) in italics. Variance Species and Variance Summits are the variances due to random effects of species and summits, respectively.
| Group of traits | Significant trait | Trait state | Simple analysis | Interaction with elevation | ||||||||||
|---|---|---|---|---|---|---|---|---|---|---|---|---|---|---|
| Variance species | Variance summits | LRT | P-value | Z | P-value | Variance species | Variance summits | LRT | P-value | Z | P-value | |||
| Ecology | 0.611 | 1.102 | ||||||||||||
| Temperature | 39.73 | <0.001 | 0.790 | 0.952 | 31.90 | <0.001 | ||||||||
| Nutrients | 7.72 | 0.005 | 0.929 | 0.952 | 36.45 | <0.001 | ||||||||
| Aeration | 8.29 | 0.004 | 0.942 | 0.959 | 14.43 | <0.001 | ||||||||
| Morphology | 0.841 | 1.101 | ||||||||||||
| Life form | 35.92 | <0.001 | 1.131 | 0.939 | 20.07 | 0.029 | ||||||||
| ChF | 1.64 | 0.102 | 2.91 | 0.004 | ||||||||||
| ChR | −0.92 | 0.360 | 0.67 | 0.338 | ||||||||||
| ChS | −2.81 | 0.005 | 2.18 | 0.029 | ||||||||||
| ChC | −4.54 | <0.001 | 2.21 | 0.027 | ||||||||||
| ChSc | −0.57 | 0.569 | 1.87 | 0.061 | ||||||||||
| Geo | 0.46 | 0.511 | 1.49 | 0.137 | ||||||||||
| HeC | 0.65 | 0.352 | 2.05 | 0.041 | ||||||||||
| HeR | −0.15 | 0.880 | 3.02 | 0.003 | ||||||||||
| HeS | 0.50 | 0.468 | 4.69 | <0.001 | ||||||||||
| Ph | 0.65 | 0.350 | 1.72 | 0.085 | ||||||||||
| Th | 2.18 | 0.029 | 2.74 | 0.006 | ||||||||||
| Dispersal | 0.663 | 1.107 | ||||||||||||
| Diaspore morphology | 13.05 | 0.005 | 0.948 | 0.932 | 98.20 | 0.020 | ||||||||
| Awn | −0.31 | 0.759 | 2.82 | 0.005 | ||||||||||
| Nude | −1.98 | 0.047 | 3.26 | 0.001 | ||||||||||
| Pappus | 3.60 | <0.001 | 4.62 | <0.001 | ||||||||||
| Wings | −1.35 | 0.176 | 3.69 | <0.001 | ||||||||||
| Fruit type | 29.09 | <0.001 | 0.843 | 0.923 | 10.29 | 0.067 | ||||||||
| Achene | −2.14 | 0.033 | ||||||||||||
| Capsule | −3.14 | 0.002 | ||||||||||||
| Follicule | −1.79 | 0.073 | ||||||||||||
| Legume | 1.14 | 0.255 | ||||||||||||
| No | 4.44 | <0.001 | ||||||||||||
| Siliqua | −1.93 | 0.054 | ||||||||||||

Figure 3. Significant interactions between elevation and the significant traits: proportions of each trait state in the lower alpine (2449–2802 m), upper alpine (2804–3006 m) and nival (3020–3418 m) belts (this altitudinal division was retained only for the figure, but the actual analyses used the continuous values in GLMM). Traits are the ecological indicator values for (a) temperature, (b) nutrients and (c) soil aeration, (d) the life form (succulent chamaephytes are not illustrated, but occurred in very low proportions in all records) and (e) the diaspore morphology. Significant states of the categorical traits ((d) and (e)) are indicated with ∗, as in figure 4.
Download figure:
Standard image High-resolution image3.2. Morphological traits
Life form was the only morphological trait with a significant effect on the probability of species colonization, both alone and in interaction with elevation (table 2; figure 3(d)). Over the past century, hemicryptophytes and fruticose chamaephytes (ChF, i.e. woody dwarf shrub) have become more abundant at the expense of suffruticose (ChS, i.e. woody only at stem base) and cushion (ChC, i.e. cushion plants) chamaephytes. This trend was most pronounced in the nival belt, where the proportions of stalked hemicryptophytes (HeS, i.e. herbaceous plants with leaves along the stem) were similar to those in the upper alpine belt, while the proportion of rosette hemicryptophytes (HeR, i.e. herbaceous rosette plants) slightly decreased. The proportion of therophytes (Th, i.e. annual species) increased on the upper alpine summits.
3.3. Dispersal traits
Diaspore morphology and fruit type were the only dispersal traits that had a significant effect on the probability of a species colonizing a summit, but only the interaction between diaspore morphology and elevation was significant (table 2; figures 3(e) and 4). Compared to historical records, the proportion of diaspores with pappus significantly increased, while the proportion of species without appendages decreased. This was most apparent in the nival belt, where an increase in diaspores with awns was also detected. While in the historical records there were more capsules than achenes, in the recent records the situation was reversed. The proportion of species without fruit (mainly ferns) increased significantly, although it was still less than 2%.

Figure 4. Changes in fruit type: proportions of each trait state. Significant types of fruits are indicated with * (p < 0.05), ∗∗(p < 0.01) and ∗∗∗ (p < 0.001).
Download figure:
Standard image High-resolution image
The variance due to random effects was similar for all models, ranging between 0.61 and 1.13 for species and between 0.93 and 1.10 for summits (table 2). Hence, the among-site variation was considered to have a limited influence on the results.
4. Discussion
This study is the first to analyse the plant traits of successful colonizers along an elevation gradient in the context of climate change. While some traits seem to be advantageous for colonization, several trait changes tend to mirror gradients of traits along elevation and hence illustrate the general upward trend of alpine plant species. This is translated by a general shift in the functional trait space of the summits towards species composition dominated by traits associated to lower elevations (figure 2). The shift at high elevation was more important than at low elevation, but historical species richness was lower at high elevation and, hence, the colonization of a few species modifies more strongly the summit position in functional trait space.
The cases of extinction we identified were independent of species traits, which suggests that the local extinction of species was either a random process or related to characteristics not investigated in this study. Contrary to previous expectations that nival species would retreat from their lower distribution margin (Grabherr et al 1994, Thuiller et al 2005), the temperature indicator value could not explain extinction events. Indeed, up to now, such a retreat has rarely been observed, and only with highly resolved data (m2 scale or abundance data instead of presence/absence; Pauli et al 2007; Klanderud and Birks 2003). However, as nival plants are long-lived and able to persist under climatically suboptimal conditions, species migration is expected to lag several decades behind climate-driven changes in habitat (Dullinger et al 2012), and species extinction may become apparent only in the future.
4.1. Ecological traits
As in previous floristic studies, we also found that relatively thermophilous species were the ones that successfully colonized high summits (Camenisch 2002, Hofer 1992, Vittoz et al 2008, Wipf et al 2013), as was also the case in a recent pan-European study (Gottfried et al 2012). Higher temperatures and a longer growing season (Jolly et al 2005), which strongly influence high-elevation plant communities (Körner 2003), have alleviated growth restrictions for an ever increasing number of species. Thus, each elevation belt received new species that are typically considered as growing at lower sites (Landolt et al 2010): montane-subalpine species (T2 and T3, table 1) have colonized new summits of the lower alpine belt, and alpine species (T1 and T1.5) summits of the upper alpine and nival belts. Interestingly, alpine-nival species (T1) likewise colonized new summits of the lower alpine belt, indicating that these species still find suitable habitats at these elevations and that competition from subalpine species is not yet strong enough to limit their establishment.
Alpine-nival species (T1) require mostly oligotrophic soil conditions, whereas montane-subalpine species are more frequently nitrophilous (Güsewell et al 2012, Landolt et al 2010). Hence, the meso- to nitrophilous species (N3 and N4) that have recently colonized the summits may have been absent historically due to low temperatures rather than to poor soil conditions. However, increased nutrient input from the atmosphere (Tørseth and Semb 1997), from herbivores (Stöckli et al 2011) or from the faster humus mineralization under warmer conditions cannot be excluded as potential explanations.
Plant traits related to soil pH and moisture (potentially related to bedrock type) had no significant effects on species colonization; hence, we conclude that the observed colonization patterns are independent of the bedrock type. Nevertheless, Holzinger et al (2008) found a higher increase in species numbers on calcareous than on siliceous mountains, but the calcareous mountains were on average lower. Also our data set was not perfectly balanced given the availability of historical data (highest siliceous summit with historical data = 3418 m, highest calcareous = 3267 m). Hence, potential confounding effects of elevation and bedrock type on species colonization deserve attention in future studies.
4.2. Morphological traits
The general increase in hemicryptophytes we observed is due to species colonization from the subalpine belt, where this growth form is the most common, whereas they are more in balance with chamaephytes in the nival belt (Aeschimann et al 2012, Vittoz et al 2010). The change is particularly evident for stalked hemicryptophytes in the upper alpine and nival belts, so that they today show similar proportions at all elevations. The simultaneous decrease in rosette hemicryptophytes (HeR) at all elevations was caused by a higher-than-average extinction rate, although this was not significant (not shown).
Cushion chamaephytes are well adapted to harsh high-mountain climate and rarely occur below 2500 m asl in the Alps (Pellissier et al 2010, Körner 2003). Their general proportional decrease reflects the low potential for new colonization as the species pool on many summits may have been saturated (most of the 14 cushion species were already frequent in historical times). Conversely, the increase in fruticose chamaephytes in the nival belt corresponds to the global increase in (dwarf-) shrubs in alpine grasslands (Vittoz et al 2008) and in alpine and arctic tundra (see Myers-Smith et al 2011; Epstein et al 2013 for reviews).
Although we could expect a colonization of pioneer species (ruderal strategy and sociological group of rocks and scree) like on glacier forelands (Burga 1999, Cannone et al 2008), sociology and plant strategy appeared to have no significant effect on the colonization success. This indicates that the floristic changes were not related to a succession driven by soil development. In contrast to the raw soils of recently deglaciated moraines, summits possess a wide range of soil types and a high heterogeneity in microtopography, providing suitable habitats for a large variety of species.
4.3. Dispersal traits
The composition of dispersal traits in the historical records reflects the elevational pattern described by Pellissier et al (2010), who found the proportion of species with pappus seeds rises from subalpine to alpine belts, but decreases in the nival belt, where species that have seeds with wings are more prevalent. During the past century, however, species with pappus seeds colonized sites intensively over the whole elevation range. As a result, they occur in similar or higher proportions than species that produce seeds with wings. Very light seeds without appendages are still well dispersed by wind (Greene and Calogeropoulos 2002), especially by the turbulent winds prevailing in mountainous regions (Tackenberg and Stöcklin 2008). Seeds with pappus, however, are efficiently dispersed by both wind and animals (Couvreur et al 2004), and allow the dispersal of heavier diaspores, richer in reserve compounds. This is advantageous for seedling establishment on rocky soils (Moles and Westoby 2006). Seeds with awns, mainly graminoids, are typically most frequent at lower elevations (subalpine belt; Pellissier et al 2010). Their proportion has slightly increased with the upwards shift of these species including, for instance, that of the most successful colonizer, Poa alpina (Wipf et al).
The historical distribution of fruit types again reflects the pattern observed by Pellissier et al (2010), who recorded a shift between achenes and capsules as dominant traits at around 2500 m. The high colonization rate of species with achenes is in accordance with the recent arrival of subalpine and lower alpine species on summits. This also corresponds with the pattern of diaspore morphologies described above, as many achenes are extended by pappus or awns, while capsules contain mainly seeds without appendages. The increase in species without fruit corresponds to the establishment of ferns, which used to be rare or even absent on most summits, but have since been some of the most successful colonizers (Wipf et al). Their tiny spores are dispersed over very large distances, which suggests their historical absence on summits is not due to dispersal, but rather to temperature limitation. Their recent establishment on the re-surveyed summits thus indicates that warmer conditions are very important for colonization processes (Vittoz et al 2008).
5. Conclusions
This study confirms previous observations that climate warming is playing an important role in driving the upwards shift of plant distribution limits in alpine ecosystems. Thanks to our large data set, we have been able to shed light on extinction and colonization processes, and on how they are influenced by species traits and elevation. Extinction events were far less frequent than colonization events. Against our expectations, the cold-adapted specialists did not seem to be particularly subject to extinction, and some even colonized new summits at lower elevations. None of the plant traits analysed had any influence on the likelihood of a species becoming extinct, whereas six traits were related to species colonization success. In the recent inventory, trait distribution in the nival belt tends to show a similar pattern to the historical trait distribution in the upper alpine belt. In turn, the recent pattern in the upper alpine belt tends to mirror the historical trait distribution in the lower alpine belt. Overall, the changes observed on the summits during the 20th century can be interpreted as indicating a general upward migration of species, bringing with them the trait composition of the next lower region. This is translated by a general summit shift in the functional trait space towards trait characteristics typical of the lower elevations (figure 2 and S1 available at stacks.iop.org/ERL/8/024043/mmedia). As the colonization rate of the different states of traits corresponded broadly to the historical distribution of these same states at lower elevations, each species seems to have approximately the same probability to colonize higher locations. The only clear exception was the diaspore morphology, since species with pappus were particularly successful in colonizing along the whole elevation gradient. Hence, the general trend for all species groups to migrate uphill at a similar rate seems slightly biased towards species with this specific diaspore morphology. This finding corresponds to previous observations published for fewer summits (Vittoz et al 2009, Holzinger et al 2008), and confirms the importance of plants' diaspore morphology in predicting the future composition of alpine vegetation.
Conducting species re-surveys is like taking snapshots of summit flora at different times, and allows interpretations to be made about long-term floristic changes. Transient fluctuations in population sizes and species composition after, for instance, extreme events do not appear to leave tracks in the trait distribution. Century-long studies can identify large-scale patterns over long periods and can serve as a benchmark for making predictions into the future. Nevertheless, monitoring projects that have a smaller spatial and temporal resolution (e.g. the GLORIA project; Gottfried et al 2012), as well as field and laboratory experiments, are still necessary to improve our understanding of species colonization and extinction in high-alpine ecosystems at the process level.
Acknowledgments
We thank Evelyn Zenklusen Mutter, Melissa Dawes and Nicolas Salamin for statistical advice, Anders Björkén, Sarah Burg, Tom Gassner, Sara Giovanettina, Kristina Herz, Cajsa Nilsson, Philippe Roux-Fouillet and numerous volunteers for field work, and Silvia Dingwall for linguistic revisions. This study was conducted on behalf of the Swiss Federal Office for the Environment (FOEN), with financial support from the Velux Foundation.