
Abstract
Major strategic issues facing the global thermoelectric sector include environmental regulation, climate change and increasing electricity demand. We have addressed such issues by modeling thermoelectric generation in the Northeastern United States that is reliant on cooling under five sensitivity tests to evaluate losses/gains in power production, thermal pollution and suitable aquatic habitat, comparing the contemporary baseline (2000–2010) with potential future states. Integral to the analysis, we developed a methodology to quantify river water availability for cooling, which we define as an ecosystem service.
Projected climate conditions reduce river water available for efficient power plant operations and the river's capacity to absorb waste heat, causing a loss of regional thermoelectric generation (RTG) (2.5%) in some summers that, compared to the contemporary baseline, is equal to the summertime electricity consumption of 1.3 million Northeastern US homes. Vulnerabilities to warm temperatures and thermal pollution can be alleviated through the use of more efficient natural gas (NG) power plants that have a reduced reliance on cooling water. Conversion of once-through (OT) to cooling tower (CT) systems and the Clean Water Act (CWA) temperature limit regulation, both of which reduce efficiencies at the single plant level, show potential to yield beneficial increases in RTG. This is achieved by obviating the need for large volumes of river water, thereby reducing plant-to-plant interferences through lowering the impact of upstream thermal pollution and preserving a minimum standard of cooling water. The results and methodology framework presented here, which can be extrapolated to other regional assessments with contrasting climates and thermoelectric profiles, can identify opportunities and support decision-making to achieve more efficient energy systems and riverine ecosystem protection.
Export citation and abstract BibTeX RIS

Content from this work may be used under the terms of the Creative Commons Attribution 3.0 licence. Any further distribution of this work must maintain attribution to the author(s) and the title of the work, journal citation and DOI.
1. Introduction
Power plant water use can alter the natural hydrology of receiving waters through thermal pollution and consumption (i.e. irretrievable losses to the atmosphere) [1–4]. In rivers, this translates to impaired ecosystem services, arising from oxygen depletion, thermal shock and potentially limited water supplies downstream [5, 6]. Thermal pollution can simultaneously lower power plant efficiency and invoke shutdowns whenever river temperatures approach environmental regulation thresholds [7–10].
Building on a simulation model of power plant operations, the Thermoelectric Power and Thermal Pollution Model (TP2M) [8], which has been coupled to a regional biogeophysical model, the Framework for Aquatic Modeling in the Earth System (FrAMES) [4], we simulate 384 power plants that require cooling to address strategic issues facing the Northeastern US thermoelectric sector (see supplementary material available at stacks.iop.org/ERL/8/025017/mmedia). TP2M simulates the operations of contemporary and emerging power plants according to climate and hydrology conditions, engineering requirements, electricity demand and environmental regulation [8]. Meanwhile, FrAMES is a spatially distributed hydrology model with gridded river networks (3 min) that simulate transport, mixing and re-equilibration of water temperatures along river reaches at a daily time step [4]. Together, these models quantify, in high-resolution, regional patterns of thermal pollution, electricity generation on a single power plant and regional scale, river temperatures and power plant efficiency losses associated with changes in available cooling water that incorporates climate, hydrology, river network dynamics and multi-plant impacts.
We discuss the contemporary Northeastern US thermoelectric sector and present a methodology for water availability accounting, applying it to the assessment of six contrasting energy, environmental and regulatory settings. The objective is to analyze tradeoffs among electricity–water–climate to provide useful insight for decision-makers managing regional thermoelectric production and aquatic environments, specifically in the Northeastern US.
2. Strategic planning issues: co-balancing energy and environment
Fuel mix and cooling technologies determine the thermoelectric sector's water use and reliance on water resources [11]. The impacts of climate change and environmental regulation are based on this reliance [8]. Here, background on the interaction between Northeastern US water resources, climate and electricity generation is provided for context.
The Northeastern US is especially reliant on water for cooling, comprising 384 thermoelectric plants with 44% of total capacity reliant on once-through (OT), the most water intensive method, compared to 31% nationally [11–14]. However, regional thermoelectric generation (RTG) from OT plants declined by approximately 16% between 2000 and 2010. In contrast, natural gas (NG) combined cycle (CC) generation, with substantially lower withdrawal rates compared to conventional (steam) OT or recirculating (RC), such as cooling towers (CT), increased 244%. This trend was driven by lower NG prices, making NG the largest built capacity in the region (figures 1(a), (b)) [15]. Meanwhile, coal and nuclear based generation, the most used fuel sources for electricity generation in the region and the most water intensive, decreased by 15% and 6%, respectively [11, 13, 14]. The change of technology and fuel mix resulted in a 5% estimated decrease of annual withdrawals but a 7% increase in evaporation between 2000 and 2010. Furthermore, the region's fuel and technology mixes are spatially variable with contrasting thermoelectric profiles across the 12 states, highlighting the complexity of regional planning tradeoffs between energy and the environment [16].
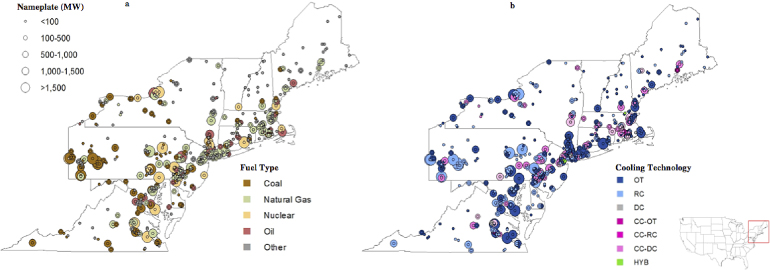
Figure 1. The distribution of 384 power plants in the Northeastern US sorted by nameplate and fuel type (a) and cooling technology (b).
Download figure:
Standard image High-resolution imageIn the Northeastern US, rising air temperatures (0.25 ° C/decade since 1970) have caused changes in the timing of high streamflow, affecting migration of anadromous fish such as Atlantic salmon [17–20]. Projected increases in ambient temperatures and precipitation are estimated to result in higher seasonal fluctuation of stream flow [18, 20]. Annual impacts, reported by global climate change studies on hydrology, are reduced river discharge in mid-northern latitudes (i.e. Northeastern US) despite an increase in precipitation [21]. Combined low flow and rising temperatures will result in a warming of rivers that simultaneously raises cooling water temperatures, lowers power plant efficiencies and increases threats to aquatic habitat [10, 22–25]. Recent regional and global-scale studies, such as van Vliet et al [26] and Rübbelke and Vögele [27], have highlighted the vulnerability of the thermoelectric sector to a warming climate [26, 27].
The Clean Water Act of 1972 (CWA) was established to protect inland waterways from human activities, such as power plant cooling, which threaten aquatic wildlife [4, 5, 28]. Its Section 316(b) addresses the impingement and entrainment of aquatic biodiversity and has highlighted water use inefficiency by OT systems [29]. The regulation, yet to be fully implemented, requires that power plants employ the 'best technology available', potentially requiring over 600 US power plants to convert from OT to CT [30, 31]. However, technology conversion lowers power plant efficiency, is expensive and may force power companies to shut down plants in lieu of retrofitting, potentially leading to shortfalls in electricity supply [30, 32, 33]. There have been objections to the method of implementation of Section 316(b) from both energy industries and environmental groups [34]. In the Northeastern US, Entergy Corp., the owners of Indian Point, a water intensive OT nuclear plant about 80 km north of New York City, has been in litigation with environmental groups over complying with Section 316(b) regulations [35]. Ironically, a switch in cooling technologies could result in unwanted environmental damages, such as increased CO2 emissions (associated with electricity generation and life-cycle activities) attributed to the additional deployment of fossil fuel and nuclear power plants required to fill any loss in capacity, highlighting the multi-dimensional aspect of these questions [30].
Environmental regulation, advancements in cooling technology, available capacity, fuel price and energy policy are factors that dominate the decision space for regional planners [16, 36]. Utility planning, water management and policymaking collaboration is central to address and respond to planning challenges and achieve efficient energy and water systems [37–39]. This requires reliable scientific support on a relevant geographic scale [40]. In particular, accounting for water availability is essential for energy modeling used as guidance for decision-makers [40, 41]. Therefore, a high-resolution geospatial model is essential to evaluate RTG, individual power plant efficiency vulnerabilities and water use over topologically oriented river networks, where upstream impacts reverberate downstream. These impacts arise in ways that cannot be predicted a priori, by combining the effects of time-varying climate and hydrology, specific cooling technologies and upstream thermal pollution limiting downstream electricity production. Through the use of TP2M and FrAMES modeling frameworks we examine this issue via a methodology that quantifies water availability for cooling.
3. Water for cooling purposes as an ecosystem service for electricity generation
While there has been progress in accounting for available cooling water, a greater level of detail is still required for effective electricity–water–climate tradeoff assessments that incorporate the criteria for efficient cooling [40–44]. Previous studies that do not account for the geospatial and time variance of the hydrologic cycle at power plant locations, river temperatures and thermal pollution impacts translated downstream within watersheds may seriously misrepresent the ratio of water use to availability, leading to over or under-estimations of water stress.
3.1. A new method of quantifying water availability for cooling as an ecosystem service
We define the availability of river water for cooling as an ecosystem service. Despite many studies of freshwater ecosystem services, few have explicitly established the link between water services and their support for thermoelectric power generation [45, 46]. Through the use of TP2M and FrAMES, we developed a methodology, via a classification framework, that quantifies available water for cooling over the regional domain. The methodology accounts for the geospatial and time variance of discharge and temperature in river networks, power plant engineering criteria and environmental regulation requirements. There are four classifications of the ecosystem service that sequentially progress from a maximum theoretical amount to a reduced amount available at temperatures that do not reduce efficiency, at the power plant's simulated intake point.
3.2. Class A: theoretically available
This class represents the discharge available, assuming no water being consumed or withdrawn, no thermal pollution and no physical or environmental regulation constraints.
3.3. Class B: power plants operational
This class represents the discharge available when power plants are operational, accounting for consumptive use only. Consumptive losses are based on the fuel mixes and cooling technologies. Efficiency limitations due to warm temperatures and environmental regulation are not considered.
3.4. Class C: CWA
This class represents the discharge available considering CWA temperature limits, which restrict the amount of water available for cooling [47]. If river temperatures at the intake point were above the CWA limit, then withdrawal would not be permitted. Therefore, Class C excludes discharge above CWA limits.
3.5. Class D: not temperature limited (NTL)
This class represents the discharge available for power plants at temperatures that do not directly limit electricity production. Discharge with temperatures assumed to cause an increase of pressure at the condenser that causes lower efficiency is excluded (i.e. becomes unavailable) [8]. Because cooling water for CTs is dependent on wet-bulb temperature and engineered systems and not withdrawn water temperature, as for OT, it assumed that Class D for CTs equals Class C.
As classes progress from A to D, the theoretical water available for power plant operations is sequentially disqualified due to physical or regulatory limitations until the volume of NTL cooling water is calculated. This quantification improves the accuracy of water availability accounting used for economic models and evaluation of regional water stress.
4. Sensitivity test design
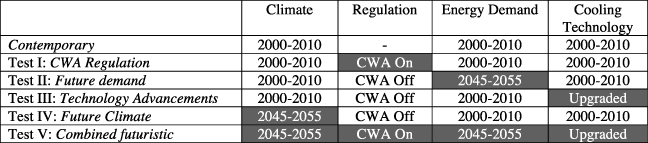
We analyzed five planning alternatives relative to the contemporary baseline in the context of energy, physical (i.e. climate and hydrology) and regulatory settings (table 1). For the sensitivity tests (and contemporary baseline), the operations of 384 thermoelectric power plants that require cooling in the Northeastern US (see supplementary material available at stacks.iop.org/ERL/8/025017/mmedia) were simulated on a daily time step with the objective of matching an exogenous electricity generation requirement, specific to each power plant. The modeling experiments are specified below:
Table 1. The design of the contemporary and five sensitivity tests. Colored entries represent the change of settings (i.e. sensitivity test) from the contemporary baseline.
|
4.1. Contemporary baseline (2000–2010)
The physical settings are based on contemporary (2000–2010) results from Stewart et al [4]. Electricity generation requirements were obtained from Energy Information Administration (EIA) forms and are identical for all simulations unless otherwise stated [12, 13].
4.2. Test I: CWA regulation
CWA (1972) river temperature limits are applied to all power plants, ranging from 29 to 32 ° C regionally [47]. This regulation is designed to lower thermal impacts on aquatic wildlife and prohibits power plants from releasing thermal effluents when rivers reach these limits. As a result, electricity output will be constrained when river temperatures approach regulatory limits. Approximately one third of all power plants nationally have variance permits [48] that removes this constraint. Thus, this test could be considered as a removal of variance permits, which was in fact proposed in 1991 but later rejected [48].
4.3. Test II: future demand
Projected EIA electricity generation and capacity for the Northeastern US region are used, categorized by major fuel types: coal; NG; nuclear; and oil [49, 50]. Projections are given through 2035 and the trend then extrapolated for 2045–2055. Power plant capacities were altered according to projections, with no geographic changes. RTG by the major fuel types is estimated to increase by 13% while associated capacity increases by 7%. NG is set to have the largest growth in generation and built capacity by 40% and 46%, respectively. Meanwhile, oil and steam based NG capacity is projected to decrease by 28%, with oil-based generation set to decrease by 90%. Coal built capacity and generation is set to decrease by 14% and 7%, respectively, and nuclear is projected to be at similar capacity and generation levels to today.
4.4. Test III: technology advancements
OT (steam) systems were converted to CT and CC–OT converted to CC–CT, representing 44% and 1.3% of capacity, respectively [14]. Conversions were assumed to result in a 2% loss in efficiency for OT to CT and 0.4% for CC–OT to CC–CT [33].
4.5. Test IV: future climate
Future climate and hydrology conditions are based on precipitation and air temperature changes obtained from SRES A2 scenario results for the years 2045–2055 for the Northeastern US as in Hayhoe et al [18]. In the winter there is a general increase of 8% of precipitation and an increase of 1.7 ° C, resulting in an 18% increase in runoff and 31% higher evapotranspiration rates compared to the contemporary baseline. However, decreased precipitation and increased air temperature in the summer, 1% and 2.2 ° C, respectively, result in a 22% decrease of runoff and 7% higher evapotranspiration rates.
4.6. Test V: combined futures
This test combines the previous four tests. CWA temperature regulation limits are applied, capacity and electricity demand is that from Test II, cooling technologies are converted as in Test III and climate and hydrology settings are those in Test IV.
5. Results of the strategic planning scenarios and electricity–water–climate tradeoffs
5.1. Riverine ecosystem services and electricity production
Water availability was analyzed for the 345 power plants that require river water for cooling (i.e. excluding plants that withdraw from lakes or oceans). There are clear seasonal differences in water availability, with insignificant physical and regulatory constraints in the winter (i.e. change from Classes A to D), despite thermal pollution, as temperatures are cold even under future climate forcings (figure 2). Thus, a negligible amount of water (∼0%) is disqualified for cooling purposes in the winter. However, in the summer, warmer river temperatures and thermal pollution disqualify over 55% of the theoretically available water in Tests I and II (table 2). In Test IV, attainment of electricity required (table 2) is lower compared to the contemporary baseline due to an insufficient Class D (NTL) service, caused by future climate forcings and thermal pollution that together disqualify over 65% of theoretically available water for NTL operations. This implication is a cause for concern as electricity demand peaks during summertime and power plants become more reliant on a shrinking ecosystem service.
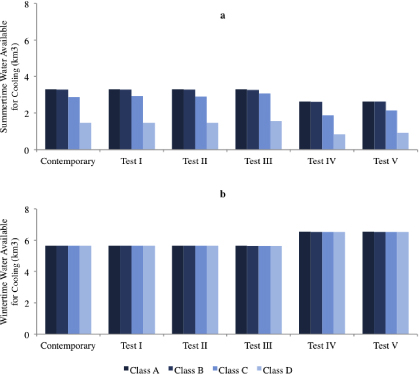
Figure 2. The classification of summertime (June, July, August) and wintertime (December, January, February) water availability, as an ecosystem service, for cooling purposes measured at the locations of 345 power plants aggregated for the Northeastern US region. There is a clear seasonal difference in water availability and climate change impacts reduce theoretically available water in the summer.
Download figure:
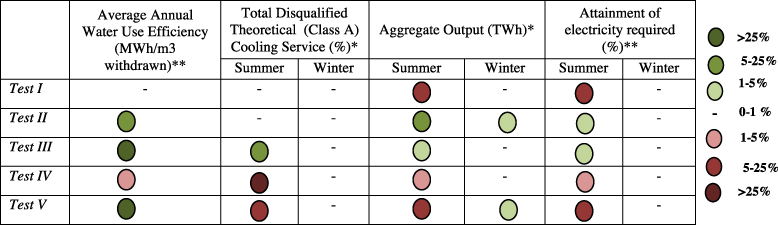
Standard image High-resolution imageTable 2. The percentage decrease (red—negative) or increase (green—positive) of a variety of electricity–water tradeoff indicators under the five sensitivity tests compared to contemporary baseline. * Assessed for 345 power plants that require river water for cooling (i.e. excluding plants that withdraw from lakes and oceans). ** Assessed for all 384 power plants that require cooling.
|
The greatest RTG is produced under Test II due to the projected increase in electricity generation and efficient NG based generation. However, the total of disqualified water available for cooling in the summer under Test II is similar to Test I and the contemporary baseline. Meanwhile, Test III enables a 3% decrease in disqualified water, while providing similar levels of electricity generation as the contemporary baseline. Thus, Tests II and III allow for more efficient water use in terms of MWh m−3 of water withdrawn, suggesting that the Northeastern US may be able to accommodate an increase in RTG without increasing the stress on river networks (figure 3). A decrease in thermal effluents reduces plant-to-plant interference that would also allow older and less efficient OT plants to operate more efficiently and further increase RTG. However, the impact is dependent on the spatial distribution of power plants and benefits of reduced plant-to-plant interferences may be less significant in regions with fewer OT plants.
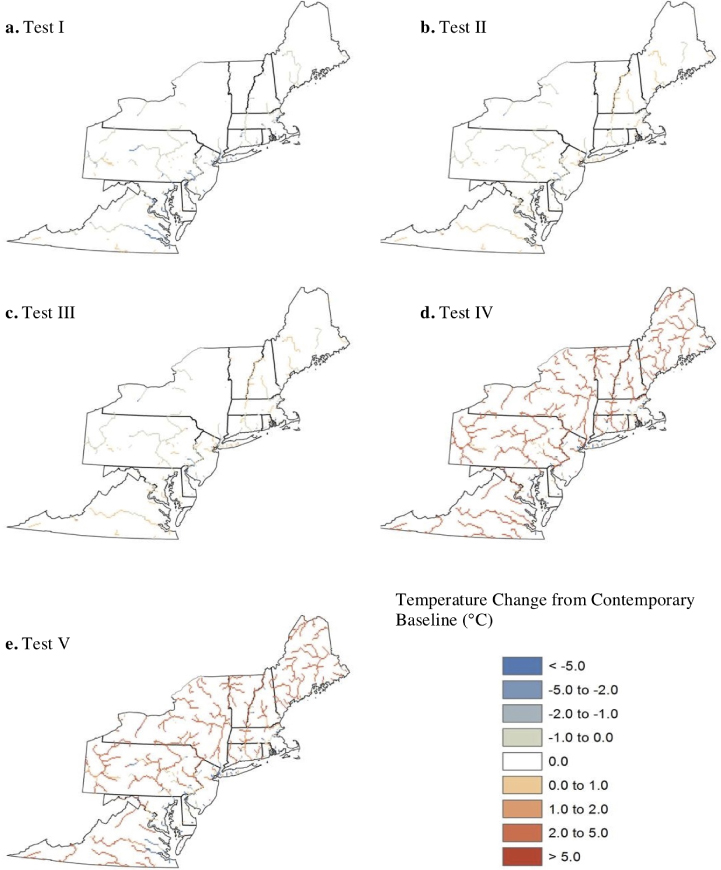
Figure 3. The summertime change of river temperatures (° C) due to climate forcings and thermal pollution compared to the contemporary baseline. Figures (d) and (e) show the impact of climate forcing and thermal pollution for rivers with average discharge >20 m3 s−1. CTs (Test II), increase NG based generation (Test III) and CWA temperature limits (Test I) all reduce thermal impacts on river networks but only Tests II and III allow for greater RTG.
Download figure:
Standard image High-resolution imageEnvironmental regulation in Test I provides some ecosystem service protection but at the expense of reduced electricity production, as OT plants are heavily constrained when forced to curb thermal effluents in the summer. In Test V, electricity generation is also significantly lower than Test II, which has similar electricity generation requirements. The difference in electricity output suggests that climate change is a potent catalyst that may exacerbate productivity losses due to CWA regulations, despite upgraded cooling technologies and higher efficiencies.
5.2. Meeting RTG requirements
In this section, simulated electricity production is discussed as a percentage of the exogenous electricity demand for all 384 power plants (figure 4). Regional wintertime electricity supply is reliable (99%), even under future climate forcings and increased electricity demand. However, climate forcings in some summers (Test IV) cause a loss of 4 TWh compared to the contemporary baseline, which is 2.5% of summertime RTG and equivalent to the summertime electricity consumption of over 1.3 million Northeastern US homes [51]. Meanwhile, CWA regulations in Test I cause significantly lower summertime electricity generation equal to a loss of over 30 TWh (∼50% of targeted RTG) compared to the contemporary baseline. Electricity production losses resulting from warm temperatures and CWA limits have already occurred in the southern US (Alabama), implying that warming rivers attributed to global warming may further strain southern power plants [9].

Figure 4. The percentage of monthly (total MWh) electricity requirements met over the decadal modeling period. An attainment below 100% implies that some power plants in the region are unable to meet electricity requirements due to physical or regulatory constraints.
Download figure:
Standard image High-resolution imageMeasures could be taken to improve the performance of power plants under warm temperatures by reducing reliance on water for cooling, such as conversion to CTs and increased NG based generation. Accordingly, Tests II and III enable more efficient RTG and best meet electricity generation requirements of all Tests.
RTG in the contemporary baseline simulation does not meet the exogenous electricity required 100% of the time. In fact, Test III attainment is greater than that in the contemporary baseline, despite energy penalties on an individual plant level. Thus, moving away from the dependency on sufficiently low river temperatures and reducing plant-to-plant interference caused by thermal pollution may provide a positive tradeoff that allows for greater RTG while affording greater ecosystem protection. However, in arid regions, increased water consumption via conversion to CTs may be a constraining factor for electricity generation and other key economic activities, such as agriculture.
In contrast, advancements in cooling technologies and greater NG based capacity do not ease the stress on RTG caused by climate warming and CWA regulation. Although, there are some summer months when Test V achieves the highest demand attainment, combined warm ambient temperatures and CWA regulation offset any gains from NG based capacity and cooling technology conversion and average summer demand attainment is the lowest of all Tests.
Physical and regulatory constraints on power plants that arise from warm ambient temperatures are essential to consider on both an individual plant level and at a regional scale (figure 5). CWA regulation constrains RTG. However, at the same time, this regulation actually reduces the number of days of efficiency losses for some power plants by limiting upstream thermal pollution impacts and consequentially lowering river temperatures at downstream power plants. At these downstream plants, efficiency is greater than that in the contemporary baseline. Therefore, optimization of the distribution of power plants together with the regional application of CWA temperature limits (with no exemptions) holds the promise of a more productive and efficient RTG system while protecting ecosystem services. This exemplifies the need to analyze the behavior of power plants on individual versus multi-plant scales when applying alternative technology scenarios on large regional scales, especially when aiming to facilitate coherent planning between energy, water and environmental planners.

Figure 5. The increase/decrease in number of days in the average year (2000–2010) when the efficiency of a power plant is higher than 90% (blue) or lower than 90% (pink to red) of optimal efficiency for each Test compared to the contemporary baseline. Climate change has a clear impact on power plant efficiencies, especially when CWA regulation limits are applied. Together, climate change and CWA regulation (Test V) offset any beneficial gains in efficient operations achieved through cooling technology conversion and increased natural gas based electricity generation. However, CWA regulation (Test I) does increase electricity production for some power plant by limiting upstream thermal pollution, illustrating the importance of coherent planning between energy, water and environmental planners.
Download figure:
Standard image High-resolution image
Climate change impacts are clear, with half of the large power plants (>500 MW) in the region having an aggregate total of 1500 days of operation experiencing at least a 10% relative efficiency loss. NG power plants and CTs can alleviate some of the impacts of warming river temperatures. This is reflected in the results of Tests II and III, which have an overall lower number of days of efficiency losses. However, under Test III there are some power plants that do suffer efficiency losses due to cooling technology conversion but these losses are outweighed by the increased productivity of other power plants. The combined effect of regulation and increased ambient temperatures again negate the benefits seen in Tests II and III, despite the improved efficiencies in some power plants.
A strategy for lowering the stress on RTG is to always carry out the inspection and maintenance of nuclear power plants in the summer [27]. Switching off nuclear power plants implies an increased dependency on other power plants, which are typically less water intensive. In the Northeastern US, over 50% of nuclear power plants use OT and the primary advantage of this strategy would be reduced thermal pollution. The associated reduction in water consumption via the strategy may prove important for arid regions where reduced water consumption could lower vulnerabilities attributed to water scarcity [14]. However, in the Northeastern US, such a benefit may be insignificant, as water consumption does not appear to be a constraint. Our results suggest that carrying out the inspection and maintenance of nuclear power plants in the summer could lower vulnerabilities to warming rivers (Tests IV and V) in Northeastern US via reducing thermal pollution. The tradeoffs of this strategy are strongly linked to regional climate conditions, hydrology and the spatial distribution of electricity generation systems and further analysis is encouraged.
5.3. Aquatic ecosystem impacts
Power plants yield a multitude of impacts on regional hydrology and ecosystem integrity. Here, we use a set of indicators [4] to evaluate environmental threats in the context of changing biogeophysical conditions, environmental regulation and energy policy (table 3).
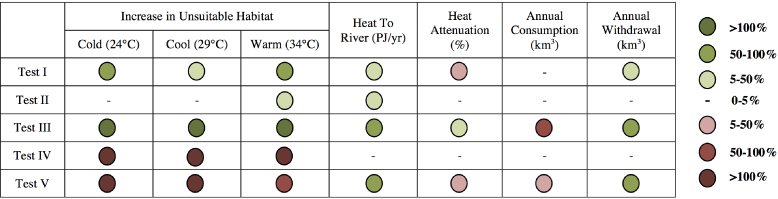
Table 3. The percentage increase (red—negative) or decrease (green—positive) of environmental impacts under the five sensitivity tests compared to contemporary conditions. Tests I, II and III reduce power plant impacts on aquatic ecosystems. However, climate change increases threats to aquatic ecosystem, even when incorporating CWA temperature limits, CTs and water efficient NG based generation.
|
Environmental regulation, conversion to CTs and increased NG based capacity result in lower thermal effluents, consequently reducing threats to riverine ecosystems. A scenario of increased electricity demand with higher efficiency (Test II) suggests that the thermal impact to rivers can be reduced compared to the contemporary baseline even with increased electricity demand. Conversion to CTs (Test III) results in greater volumes of water consumed, but the relative impact on river flows remains small (figure 2). By significantly reducing the amount of heat input to the river system, conversion to CTs result in the greatest improvements for aquatic ecosystem indicators.
Climate change studies have predicted an increase in unsuitable aquatic habitat in the region, especially for cold and cool fishes [24]. This is reflected in our future climate scenario (Test IV), which shows an increase in unsuitable habitat for fishes with maximum average weekly temperature thresholds of 24 ° C (cold) and 29 ° C (cool), while having levels of withdrawal, consumption and thermal pollution remain similar to the contemporary baseline. Climate change also appears to increase unsuitable habitat for fishes with 34 ° C (warm) thresholds, but improved water use efficiency and CWA temperature limits lessen the negative impacts (Test V).
A lower amount of NTL and theoretical water available for cooling under Tests IV and V acts as a constraint on electricity production. This illustrates the importance of the river's ability to release heat to the atmosphere (i.e. heat dissipation or attenuation) and to buffer impacts of thermal pollution. Heat dissipation is a function of climate conditions and the spatial distribution of thermal heat loads within the river network [4, 52]. However, even with contrasting heat loads, absolute heat dissipation is relatively small (∼10%) in all Tests. In Test V, river heat attenuation declines, exacerbating the effects of thermal pollution, leading to inferior power plant efficiency and aquatic habitat. Therefore, vulnerability of fish species increases despite reduced thermal effluents. The interactions of spatially distributed thermal pollution, climate change and hydrology need to be considered when assessing threats to aquatic ecosystems, and CWA may not be able to mitigate the impacts.
6. Conclusion
Results highlight the benefits of coupling power plant operations to time and spatially varying hydrology models to address the regional behavior of the thermoelectric sector and analyze single plant versus RTG. Tradeoff analyses demonstrate the importance of testing policy decisions at geographically relevant scales to provide insight and improved understanding for electricity–water–climate planning.
Key findings show that converting to CTs and NG power plants can facilitate a more efficient RTG system. Thus, in addition to environmental regulation, energy policy should play a central role in shaping water use [16]. This can be achieved by encouraging efficient and productive fuel and technology mixes that provide equivalent and perhaps even improved ecosystem protection compared to current regulation, while achieving greater electricity generation [53, 16, 54].
Climate change is a cause for concern as it may lower power plant efficiencies. The effect on efficiencies is magnified when warm temperatures are combined with CWA river temperature limits, even with cooling technology advancements and increases in efficient NG based capacity. However, CWA regulation, by limiting thermal pollution, has the potential to paradoxically increase the productivity of some power plants, which signifies the importance of optimizing the planning distribution and locations of future power plants in the context of multi-plant impacts. Thus, environmental conditions should be considered alongside electricity generation planning, as preserving ecosystem services can allow for more productive RTG and improved aquatic habitat. Our results for the Northeastern US suggest that riverine ecosystems may come under threat and RTG constrained in other regions with projected reduced river discharge and increasing ambient temperatures. Such regions include river basins in Europe (i.e. Rhine and Danube) and in the US (Colorado and Mississippi), highlighting the global-scale significance of warming temperatures on riverine ecosystems and RTG [21].
The use of high-resolution models for individual versus cross-issue tradeoff analyses of looming strategic factors that are necessary to consider in the energy–water–climate planning community can provide a much needed platform to drive energy policy and stakeholder engagement [16, 36, 37, 41, 54, 55]. Large-scale power disruption can have damaging effects not only for the general public in maintaining adequate living conditions, but also for national security [55]. Such concerns support the notion that it is 'ineffective and misguided' to treat electricity, water and climate separately and emphasize the significance of an integrated approach [55]. Moreover, results of this and previous studies clearly show the importance of promoting programs and research efforts on critical infrastructure protection and to support coordination between water and energy services to reach more efficient systems and encourage co-management that can facilitate greater RTG and riverine ecosystem protection.
Acknowledgments
This work is supported by the National Science Foundation Grant #1049181 and The Department of Education—Earth Science and Environmental Sustainability (ESES) Graduate Initiative Grant #P031M105066. We thank and are grateful to Pablo Muñoz Hernández, City College New York, and the anonymous reviewers.