
Abstract
Ramped pyrolysis isotope (13C and 14C) analysis coupled with polycyclic aromatic hydrocarbon (PAH) analysis demonstrates the utility of ramped pyrolysis in screening for oil content in sediments. Here, sediments from Barataria Bay, Louisiana, USA that were contaminated by oil from the 2010 BP Deepwater Horizon spill display relationships between oil contamination, pyrolysis profiles, and isotopic composition. Sediment samples with low PAH concentrations are thermochemically stable until higher temperatures, while samples containing high concentrations of PAHs pyrolyze at low temperatures. High PAH samples are also depleted in radiocarbon (14C), especially in the fractions that pyrolyze at low temperatures. This lack of radiocarbon in low temperature pyrolyzates is indicative of thermochemically unstable, 14C-free oil content. This study presents a proof of concept that oil contamination can be identified by changes in thermochemical stability in organic material and corroborated by isotope analysis of individual pyrolyzates, thereby providing a basis for application of ramped pyrolysis isotope analysis to samples deposited in different environments for different lengths of time.
Export citation and abstract BibTeX RIS

Content from this work may be used under the terms of the Creative Commons Attribution 3.0 licence. Any further distribution of this work must maintain attribution to the author(s) and the title of the work, journal citation and DOI.
1. Introduction
Oil contamination can cause morphologic stress over long time scales in sensitive coastal environments, necessitating a need to identify and quantify oil despite chemical changes over such time periods. The 2010 BP Deepwater Horizon oil spill (DwH) is the largest accidental oil spill to date, having released from the Macondo well roughly ten times the oil as the 1989 Exxon Valdez spill (Crone and Tolstoy 2010). Besides causing various immediate problems including the loss of life, the oiling of wildlife, and oil deposition in coastal areas, this large spill will have environmental repercussions on longer time scales. For instance, one of the areas impacted by DwH (ERMA 2013), coastal Louisiana, USA is already undergoing high rates of morphologic change (Couvillion et al 2011) and may be especially susceptible to additional stress from the oil. Detecting oil over longer time scales and large spatial scales, as well as evaluating for oil weathering, are necessary after an oil spill of DwH's magnitude.
Polycyclic aromatic hydrocarbons (PAHs) have been used to detect oil on decadal time scales both because of their relatively high toxicity and the tendency of some PAHs to persist in the environment (Boehm and Farrington 1984, Colombo et al 1989, Wang et al 1999, Alimi et al 2003, White et al 2005b, Short et al 2007). Many PAHs have been classified as possible or probable human carcinogens (Menzie et al 1992, Harvey 1996, Mastrangelo et al 1996). PAHs are considered one of the most valuable hydrocarbon classes for detecting oil in the environment because many persist longer than aliphatic hydrocarbons (Wang et al 1999 and references therein; Alimi et al 2003 and references therein). Major sources of PAHs include oil contamination (a petrogenic source); the combustion of fossil fuels and organic material (pyrogenic sources); the petrochemical activities of catalytic cracking and coke combustion (pyrogenic sources); biological processes (biogenic sources); and chemical and biological alteration of natural organic material (diagenetic sources) (Laflamme and Hites 1978, Neff 1979, Colombo et al 1989, Iqbal et al 2008). Two studies of note have shown that PAH analysis can detect oil in the environment on decadal time scales: 16 years after the 1989 Exxon Valdez spill (Short et al 2007) and 30 years after the 1969 Florida spill (White et al 2005b). However, PAHs constitute a small percentage of overall oil composition (∼0.2–4%; Neff 1979) and they do degrade through time (Neff 1979, Hinga et al 1980, Cerniglia 1992), but they are well-studied oil contamination indicators.
This study uses PAHs as a proxy for oil and employs the ramped pyrolysis (RP) carbon isotope technique to investigate relationships between PAH content, thermochemical stability, and isotopic composition of sediment from an oil-impacted marsh. Whereas PAH analysis detects a specific compound group present in oil, the RP technique analyzes the entirety of organic carbon (OC) in a sample, yielding both a pyrolysis profile related to thermochemical stability and an isotopic spectrum indicative of OC from the different sources present in the organic material (Rosenheim et al 2008, Rosenheim and Galy 2012, Rosenheim et al 2013b, 2013c). We test the hypothesis that oil contains compounds that are less thermochemically stable than those typical of background sedimentary OC in most depositional settings, therefore oil contamination will render distinct pyrolysis profiles. Pyrolysis profiles can be used to estimate oil content through isotopic (δ13C and Δ14C) and PAH analyses, with isotope values allowing quantitative approaches to estimate total oil content in the OC. Multiple studies have demonstrated the utility of measuring petrogenic contamination using radiocarbon (White et al 2005a, 2008, Ahad et al 2010, Chanton et al 2012, Ahad and Pakdel 2013, Mahmoudi et al 2013) and stable carbon (Macko et al 1981, Graham et al 2010, Chanton et al 2012) isotopes. We apply this method to a relatively simple sample set, collected at the same time and from the same depositional environment where inconsistent but intense oil contamination was observed during the DwH spill event (ERMA 2013, Silliman et al 2012).
2. Methods
We sampled a brackish marsh environment in northern Barataria Bay, Louisiana, USA (Dincer 2013). The area from which samples were collected was located between 29.4690° N, 89.9283° W and 29.4411° N, 89.8999° W. Sediment samples (n = 44) from the surface (0–2 cm) and subsurface (20–21 cm) were collected from the intertidal zone. Samples were collected into precombusted glass vials and ranged in degree of oiling, from obvious to not visible to the sampler. Sampling occurred 535 days after DwH began releasing oil and oil was confirmed within the sampling area by survey teams (Silliman et al 2012, ERMA 2013). The relatively simple sample set aims to limit variability in space, energy, environment, and depositional area.
Sediment samples were analyzed for PAHs using a technique based on NOAA NS&T Methods and validated by 15+ years of interlaboratory comparisons (Wade et al 2008). Deuterated surrogate standards (d8-naphthalene, d10-acenaphthene, d10-phenanthrene, d12-chrysene, and d12-perylene) were added to 3 g of freeze dried sediment and used to calculate analyte concentrations. Samples were extracted with methylene chloride using an accelerated solvent extractor (ASE). Extracts were fractionated by partially deactivated silica/alumina column chromatography by eluting with a 1:1 mixture of pentane and methylene chloride. PAHs were quantitatively analyzed by gas chromatography–mass spectrometry (GC–MS; HP-5890 and HP-5970-MSD) in the selected ion mode (SIM). The GC–MS was calibrated by the injection of standards at five concentrations. Samples were injected in the splitless mode into a 30 m × 0.25 mm i.d. (0.25 μm film thickness) DB-5 fused silica capillary column (J&W Scientific, Inc.) at an initial temperature of 60 ° C, then ramped at 12 °C min−1 to 300 ° C and held for 6 min. The mass spectral data were acquired and the molecular ions for each of the PAH analytes were used for quantification. Analyte identification was based on the retention time of the quantitation ion for each analyte and a series of confirmation ions. Twenty-eight different PAH analytes were measured, twenty-two of which are US EPA priority PAHs. A full list of the specific PAHs analyzed is available in SM1 in the supplemental materials (available at stacks.iop.org/ERL/8/044038/mmedia).
A subset (n = 4) of these samples with relatively low and relatively high PAH concentrations were selected for this study and analyzed by ramped pyrolysis. Analysis of the sediment samples and crude oil by ramped pyrolysis was accomplished using the same procedure as previous RP investigations (Rosenheim et al 2008, Rosenheim and Galy 2012, Rosenheim et al 2013b, 2013c); this procedure consists of a smooth temperature ramp of 5 °C min−1, 0% O2 in the reaction chamber, and ∼8% O2 in the combustion chamber. More analytical details are available in Rosenheim et al (2008). The crude oil, provided by BP (reference material ID: SOB-20100617-032; source sample ID: ENT-052210-OL-041/043), was sampled directly from the Macondo well head and stored at −4 ° C. Individual pyrolyzates were collected as aliquots of CO2 at inflection points in the reaction profiles, which are generated by monitoring and recording CO2 concentration using a non-dispersive flow-through infrared CO2 analyzer. Two to four CO2 aliquots from each sediment sample were collected and sent to the National Ocean Sciences Accelerator Mass Spectrometer Facility for Δ14C and δ13C determination. Radiocarbon data, reported in Δ notation and per mil (‰) units, were calculated using:

where Fm denotes fraction modern and y represents the year the sample was collected (Stuiver and Pollach 1977). Radiocarbon data from the RP analyses were corrected for 9.5 (±3.8) μg of 'modern' blank and 0.05 (±0.025) μg of 14C-free blank over an entire run, divided equally amongst the aliquots of CO2 taken from each sample's pyrolysis profile, following recommendations of Santos et al (2010). In short, blank contamination contains levels of radiocarbon more like modern CO2 and blank correction yields lower radiocarbon content with higher uncertainty than the original measurement from the accelerator mass spectrometer (AMS) system. Stable carbon isotopic composition is expressed in δ notation and ‰ units, relative to the Pee Dee Belemnite (PDB) standard, according to:

where R is the ratio 13C/12C, x denotes the sample, and std denotes the standard.
3. Results and discussion
Total PAH concentrations in the four sediment samples (108–390 835 ng g−1 dry weight (dw); table 1) vary significantly, spanning three orders of magnitude. In comparison, uncontaminated estuarine and marine sediments commonly have total PAH concentrations on the scale of 0–50 ng g−1 (Neff 1979, Kennish 1997); deep ocean sediments have been measured to have a total PAH concentration of 100 ng g−1 (Windsor and Hites 1979); remotely located surface soils averaged 328 ng g−1 (Nam et al 2009); and PAH are acutely toxic to marine organisms at concentrations of 200–10 000 ng g−1 (Neff 1979). The high PAH samples analyzed in this project represent high concentrations of oil, highly toxic conditions, and highly variable spatial coverage of the oil contamination both at the surface of the sediments and with sediment depth (table 1).
Table 1. Data for individual sediment OC samples: PAH concentration, temperature of maximum CO2 production, and geometric mean isotopic data. RP run numbers can be used to index data in other tables and figures concerning the aliquots of CO2 taken from each OC sample.
| Sample ID | RP run | Depth (cm) | Total PAH (ng g−1) | Tmax (° C) | Δ14Ccba (‰) | δ13Ccba (‰) |
|---|---|---|---|---|---|---|
| Z0055 | DB482 | 20–21 | 108 | 514 | −185 | −24.2 |
| Z0094 | DB490 | 0–1 | 120 | 511 | −124 | −18.9 |
| Z0149 | DB491 | 1–2 | 390 835 | 201 | −857 | −27.0 |
| Z0177 | DB509 | 0–1 | 263 870 | 224 | −817 | −26.4 |
At the first order, PAH concentrations indicate high levels of contamination in half of the samples and slightly elevated levels relative to background concentrations in the other half (table 1). In comparison to values from literature (Neff 1979, Windsor and Hites 1979, Kennish 1997, White et al 2005b, Nam et al 2009), PAH concentrations of 108 and 120 ng g−1 (table 1) are considered relatively low and demonstrate possible low-level oil contamination or minor non-petrogenic PAH input. PAH concentrations of 263 870 and 390 835 ng g−1 (table 1) are considered high and strongly indicative of oil contamination. Total PAH concentrations are used in this study, with the inclusion of perylene, a PAH with non-petrogenic sources (Aizenshtat 1973; Venkatesan 1988 and references therein; Colombo et al 1989 and references therein) present in South Louisiana crude oil (Neff 1979). In this sample set, perylene accounts for <6% and <0.3% of total PAHs in low and high PAH samples, respectively, therefore its inclusion or exclusion can be considered inconsequential.
Ramped pyrolysis reaction profiles vary in accordance with PAH concentration and present higher reactivity at low pyrolysis temperatures in high PAH samples (figure 1, table 1). Low PAH samples pyrolyze largely at temperatures above 300 ° C, with less than 11% of total CO2 evolved at temperatures lower than 300 ° C. In contrast, higher proportions of high PAH samples pyrolyze below 300 ° C (up to 51% of total CO2). The RP profile of the Macondo crude oil demonstrates oil's similarly low thermochemical stability compared to high PAH samples (figure 1). Sediments from other environments, uncontaminated with oil, have all yielded little to no pyrolysis below 250 ° C (Rosenheim et al 2008, Rosenheim and Galy 2012, Rosenheim et al 2013b, 2013c). Therefore, the pyrolysis at low temperatures (<300 °C) observed in high PAH samples and lacking in low PAH samples suggests oil contamination in the sediments, but it does not quantify the amount. The temperature of maximum CO2 evolution (Tmax) can be used to characterize thermochemical reaction profiles, and Tmax is inversely proportional to PAH concentration, with high PAH levels corresponding to low Tmax (figure 2, table 1).
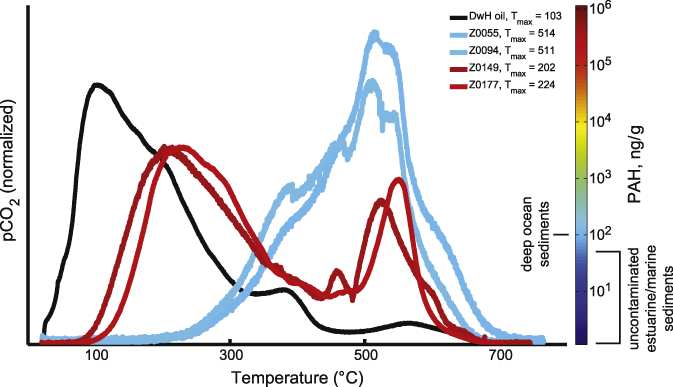
Figure 1. Ramped pyrolysis reaction profiles for marsh sediment samples with known PAH content. Evolution of CO2 (oxidized pyrolyzates; ordinate) is plotted over temperature (abscissa). Profile colors are scaled to the sample's total PAH concentration, in ng g−1 dw. The labels in the legend are the sample ID's in table 1.
Download figure:
Standard image High-resolution image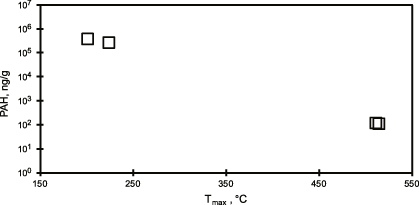
Figure 2. PAH concentration (ordinate) versus Tmax (abscissa). PAH content is inversely proportional to Tmax, with high PAH samples yielding maximum CO2 production at <250 °C.
Download figure:
Standard image High-resolution imageRadiocarbon data differ significantly between low and high PAH samples, corroborating the difference in pyrolysis profiles between the two groups and offering a quantifiable estimate of oil contamination. High PAH samples are significantly more depleted in 14C (−993 to −560‰) than low PAH samples (−222 to −99‰; table 2). For the high PAH samples, CO2 produced at low temperatures yields Δ14C values very near that of oil, while high temperature CO2 appears to contain a mixture of 14C-depleted petrogenic carbon and 14C-enriched modern biogenic carbon. Oil has a hypothetical Δ14C value of −1000‰ (due to blank contamination in sample and graphite preparation and in accelerator mass spectrometric 14C/12C determination, it is not possible to actually measure a value of −1000‰; table 2). The lowest temperature CO2 aliquot collected from each high PAH sample was so depleted in 14C that each resulted in less 14C than our determination of blank contamination. In other words, these values represent limits and the true values are less than the reported fractions modern and Δ14C (marked with a (footnote e) in table 2), but not measurable using the RP system coupled with AMS analysis. In these cases we use a minimum age limit equivalent to the 2-sigma uncertainty to calculate the reported fraction modern and Δ14C values. Low PAH samples differ considerably from oil in Δ14C, with values much closer to the modern end of the radiocarbon spectrum. However, the Δ14C values from low PAH samples are lower than expected for modern marsh biomass, which we estimate to have a radiocarbon signature of Δ14C = 77‰ (table 3) based on a measurement of surface sediment from a marsh within the Barataria Basin where no oil contamination was reported. Values lower than our uncontaminated marsh sediment control could be interpreted as evidence of low-level background oil contamination in the low PAH samples, or admixture of aged terrigenous carbon low in both 14C and PAHs. Molar quantities and isotopic values are used to calculate a geometric mean isotopic value (comparable to a bulk isotopic value) for the sample analyzed by RP using:

where δcb represents the geometric mean isotopic value, fi represents the fraction of CO2 from the whole sample in each aliquot, and δi represents the associated isotopic ratios. Geometric mean Δ14Ccb values are −185 and −124‰ for low PAH samples and −857 and −817‰ for high PAH samples (table 1).
Table 2. CO2 aliquot temperatures, quantities of carbon, isotopic data, and component fractions (calculated from Δ14C (see footnote b)). Uncertainties listed (1σ) pertain to quantities immediately to the left of these columns.
| CO2 pyrolyzate | Temp. interval (° C) | (μmol C) | Fma | 1σ | Fmb | 1σ | Δ14C (‰)b | 1σ | δ13C (‰)c | foil | fOCbd |
|---|---|---|---|---|---|---|---|---|---|---|---|
| DB482-1 | Amb–518 | 28.70 | 0.8482 | 0.0025 | 0.8465 | 0.0026 | −159.8 | 2.6 | −24.2 | 0.22 | 0.78 |
| DB482-2 | 518–764.5 | 20.09 | 0.7874 | 0.0026 | 0.7838 | 0.0031 | −222.1 | 3.1 | −24.1 | 0.28 | 0.72 |
| DB490-1 | Amb–392 | 13.13 | 0.9069 | 0.0032 | 0.9060 | 0.0033 | −100.7 | 3.3 | −19.7 | 0.17 | 0.83 |
| DB490-2 | 392–469 | 15.59 | 0.9084 | 0.0035 | 0.9077 | 0.0035 | −99.1 | 3.5 | −18.8 | 0.18 | 0.82 |
| DB490-3 | 469–521 | 13.63 | 0.8781 | 0.0030 | 0.8768 | 0.0031 | −129.7 | 3.1 | −18.4 | 0.20 | 0.80 |
| DB490-4 | 521–692 | 16.81 | 0.8482 | 0.0031 | 0.8468 | 0.0032 | −159.5 | 3.2 | −18.9 | 0.23 | 0.77 |
| DB491-1 | Amb–198 | 24.02 | 0.0094 | 0.0011 | ≤0.0066e | 0.0033 | ≤ − 993.4e | 3.3 | −27.7 | 0.99 | 0.01 |
| DB491-2 | 198–371 | 50.09 | 0.0616 | 0.0011 | 0.0579 | 0.0018 | −942.5 | 1.8 | −27.5 | 0.95 | 0.05 |
| DB491-3 | 371–480 | 15.91 | 0.1193 | 0.0014 | 0.1083 | 0.0047 | −892.5 | 4.7 | −27.4 | 0.86 | 0.14 |
| DB491-4 | 480–676 | 28.17 | 0.4403 | 0.0020 | 0.4365 | 0.0025 | −566.8 | 2.5 | −25.3 | 0.59 | 0.41 |
| DB509-1 | Amb–202 | 22.52 | 0.0094 | 0.0010 | ≤0.0071e | 0.0035 | ≤ − 992.9e | 3.5 | −28.2 | 0.99 | 0.01 |
| DB509-2 | 202–378 | 71.11 | 0.1005 | 0.0015 | 0.0980 | 0.0018 | −902.7 | 1.8 | −27.2 | 0.91 | 0.09 |
| DB509-3 | 378–460 | 15.61 | 0.1909 | 0.0017 | 0.1806 | 0.0045 | −820.7 | 4.5 | −26.6 | 0.83 | 0.17 |
| DB509-4 | 460–692 | 39.20 | 0.4456 | 0.0020 | 0.4429 | 0.0023 | −560.4 | 2.3 | −23.9 | 0.59 | 0.41 |
aRaw data not subjected to blank correction. bBlank-corrected data. c1σδ13C = 0.1‰ . dOCb—background organic carbon. eMeasured value and 2σ uncertainty less than process blank for AMS; age limit and corresponding Δ14C reported instead. Amb—ambient laboratory temperature.
Table 3. Isotopic values for assumed endmembers used in the mixing model to calculate component fractions.
| Carbon source | Δ14C (‰) | δ13C (‰) |
|---|---|---|
| DwH oil | −998a | −27.3b |
| Brackish marsh OC | 77c | −16.9d |
| S. alterniflora | 77e | −12.5f |
aMost negative value for oil measured by RP AMS. bAvg. value from measurements and (Graham et al 2010). cMeasured. d(Chmura et al 1987). eAssumed equal to brackish marsh OC. f(Haines 1976).
Assuming sample composition to be a binary mixture of oil and background organic carbon (OCb), a Bayesian multi-source isotope mixing model was employed to estimate component fractions (Parnell et al 2010). The mixing model has the same conventional formula as equation (3), but δcb is replaced by δ, the measured isotopic composition from a sample comprised of a mixture of endmembers, and solving for fi, the fraction of the sample that each endmember comprises. The model is able to incorporate known variability in endmembers and analytical error associated with the isotopic measurements. We use the most negative blank-corrected Δ14C value measured for oil using RP AMS (−998.2 ± 1.8‰) as the oil endmember, as well as the mean uncertainty associated with each Δ14C measurement (mean ± SD of 3.1 ± 0.9). The model was run with 500 000 iterations in order for its outputs to be robust despite the variability. The average amount of resulting uncertainty (maximum possible fraction value minus minimum) in the calculated oil and OCb fractions for any given CO2 aliquot was 0.16 ± 0.15 at the 95% confidence level. Calculated fractions oil (foil) of 0.17–0.28 indicate low, but significant, oil composition in the OC of low PAH samples. Use of our measured OCb endmember likely produces a maximum foil in the low PAH cases; OCb with less radiocarbon would decrease these fractions. However, we cannot rule out the possibility that these significant oil fractions are due to chemical derivatives and leachates of oil because we do not use solvent extraction to limit the types of OC that are pyrolyzed. Calculated foil values of 0.59–0.99 in high PAH samples demonstrate the prevalence of oil in the OC of these samples. The four high PAH CO2 aliquots collected below 380 ° C yield foil > 0.91, confirming oil as the source of the low temperature (<300 °C) pyrolysis in these samples. The highest temperature CO2 aliquot collected from each high PAH sample both yield foil values of 0.59, reflecting a mixture of oil and OCb.
Stable carbon isotope data corroborate our interpretations of oil in high PAH samples, with geometric mean (equation (3)) values near that of oil and the most depleted values corresponding to low temperature pyrolysis. We use δ13C to indicate oil in pyrolyzates but not for quantification purposes because δ13C is not as sensitive a tracer of oil as is Δ14C. Whereas oil is separated from Barataria Bay brackish marsh sedimentary OC in Δ14C space by ∼1000‰, the difference in δ13C space is ∼10‰ (table 3). Also, it is possible for weathering to change oil's δ13C signature (Sofer 1984, Galimov 2006), but there is not a firm consensus on this, as other studies have shown oil's δ13C signature to remain relatively constant through weathering (Macko et al 1981, Rosenheim et al 2013a). DwH oil has a δ13C value of −27.3‰ (table 3) and the OCb of the study area can be characterized by the stable carbon isotopic signatures of the dominant plant species, S. alterniflora, and Barataria Bay brackish marsh sediments (δ13C =− 12.5‰ and −16.9‰, respectively; table 3, Haines 1976 and Chmura et al 1987). Stable carbon isotopic signatures for low PAH samples (full range of individual aliquots= −24.2 to −18.4‰, geometric mean δ13Ccb =− 24.2 and −18.9‰) differ from those of high PAH samples (full range of individual aliquots =−28.2 to −23.9‰, geometric mean δ13Ccb = − 27.0 and −26.4‰), which are indicative of oil and minor admixture of OCb. Stable carbon isotope values less than that for oil may be due to fractionation during the RP reaction or inclusion of C3 terrigenous carbon (δ13C =− 34 to −23‰; Smith and Epstein 1971). Stable carbon isotope data from low PAH samples (figure 3(A); table 2) are more enriched than high PAH samples (figure 3(B); table 2), but more depleted than the assumed endmember range of −16.9 to −12.5‰ (Haines 1976, Chmura et al 1987). This could be interpreted as further evidence of minor inclusion of oil (δ13C =− 27.3‰) or indication of terrigenous carbon from C3 vegetation. The difference in stable carbon isotope data between the two low PAH samples is likely due to them having been collected from different sediment depths. The surface sample (0–1 cm; table 2) yields enriched δ13C values, likely due to a higher fraction of plant organic material. A deeper sample (20–21 cm sediment depth; table 2; figure 3(A)) shows more depleted δ13C values, indicative of early diagenesis of sedimentary organic carbon (Chmura et al 1987). A more depleted Δ14Ccb value for the deeper sample (table 1) corroborates aged sedimentary OC making up a larger component of its OC than in the shallower sample.

Figure 3. Thermochemical and isotopic data for one low PAH sample ((A) Z0055) and one high PAH sample ((B) Z0177) plotted over temperature. In the top panel, normalized and unitless CO2 evolution plots along the left ordinate. Radiocarbon data for CO2 aliquots (data points at centers of temperature intervals) plot on the right ordinate. Stable carbon isotopic data for the same aliquots is presented in the bottom panel. Geometric mean isotopic data were calculated from the subsamples and are presented in red (radiocarbon) and blue (stable carbon) values and dashed lines.
Download figure:
Standard image High-resolution imageThe OCb endmember radiocarbon value of our binary mixing model (77 ± 38.5‰) was measured to represent authigenic input of carbon into these sediments, which likely comprises the largest amount of sedimentary OC. Other endmember values are possible. Studies that have measured petroleum-derived contaminants using radiocarbon abundances (White et al 2005a, 2008, Ahad et al 2010, Ahad and Pakdel 2013, Mahmoudi et al 2013) have used the Δ14C signature of the solvent-extracted sediment residue (EX-RES) as a background (uncontaminated) estimate. Similarly, we could use the Δ14C value of the highest temperature aliquot as a background estimate, assuming that above ∼500 ° C all oil components would have already pyrolyzed based on oil's thermochemical instability and ignoring any stabilization from degradation of the oil. However, the Δ14C values of the highest temperature aliquots from the high PAH samples are −566.8 to −560.4‰ (table 2). They differ significantly from the equivalent values from the low PAH samples (−222.1 to −159.5‰; table 2) and the measured surface sediment Δ14C value (77‰; table 3). This indicates that oil compounds can persist at higher temperatures (>500 °C) during RP, due to degradative stabilization and/or pyrolytic charring of oil components, and thus high temperature Δ14C values are not an acceptable estimate for a background value.
At the most basic level, the mineral fraction of wetland soil can be considered to be delivered by fluvial processes in the Mississippi–Atchafalaya River system (MARS), and this fraction is deposited with existing particulate organic carbon (POC). MARS POC Δ14C values have been shown to range between −216 and −118‰ (Rosenheim et al 2013b), representing the baseline composition of marsh sediment OC if no authigenic carbon is produced and added to the sediment. Added authigenic carbon will be more enriched in 14C and would eventually be deposited in much higher concentrations than MARS POC. Only half of the low PAH ramped pyrolysis aliquots show Δ14C within the range of MARS POC and the other half fall on either side of this range. Stable carbon isotope values of the RP aliquots support a high degree of authigenic OC coming from C4 photosynthesis (10‰, table 2). Use of the MARS POC as the OCb endmember to calculate component fractions oil would reduce the calculated fractions oil for low PAH samples, but would have a negligible effect on most high PAH foil values because the oil endmember has considerably less 14C than both MARS POC and modern marsh biomass endmembers. A value of 77‰ is a better estimate for OCb radiocarbon than using the measured MARS POC radiocarbon data because some Δ14C values from individual pyrolyzates from the present study are higher (−99‰ max) than the MARS POC values. Thus, a binary mixing model using MARS POC and oil endmembers would offer no constraint on the system.
Ramped pyrolysis isotope analysis provides two independent methods to further constrain the amounts and isotopic endmembers in oil-contaminated OC. Both approaches can be illustrated with our relatively simple sample set, however it is important to stress that these methods would be especially useful in a time series of samples or in comparing samples from different depositional environments. In order to relate the two principal indicators of oil employed in this study, Δ14C is plotted against the reciprocal of total PAH concentration (figure 4(A)). The most depleted Δ14C value was used from each high PAH sample's CO2 aliquots to represent the oil endmember, while the most positive radiocarbon value from each low PAH sample's CO2 aliquots was used to trace a mixing line toward oil-free samples. A linear regression yields a y-intercept that serves as an approximation (Δ14C =− 990‰) of the radiocarbon signature of the DwH oil which is 1% off from the theoretical value of −1000‰. This estimate is also in agreement with values for DwH oil analyzed by RP AMS, which yields radiocarbon data between −998 and −972‰ after having been corrected for instrument background and process blank. A background (oil-free) Δ14C value of 77‰ corresponds to a PAH concentration of 91 ng g−1, which is a reasonable background estimate when compared to values from the literature of <100 ng g−1 (Neff 1979, Windsor and Hites 1979). Stable carbon isotopic composition can also be used as a constraint by plotting δ13C against 1/foil for individual pyrolyzates, generating a Keeling-like plot (figure 4(B)). A Keeling plot (technique similar to that first used by Keeling 1958) allows independent calculation of an endmember when a range of binary mixtures has been measured. When linearly regressed, the data in figure 4(B) yield an estimate for the δ13C value of the DwH oil (δ13C =− 27.2‰ where 1/foil = 1) within measurement error (1σ = 0.1‰) of the measured value (−27.3‰, table 3), supporting the utility of δ13C to estimate quantities of oil in this environment. Figure 4(B) also relates stable carbon and radiocarbon data because foil is calculated from Δ14C. Because our experiment focused on comparison of high PAH samples to low PAH samples, there are no data from intermediate values of 1/foil, however we postulate further application of this method to oiled sediment through time will fit this linear relationship.

Figure 4. (A) The most negative radiocarbon value from the CO2 aliquots from each high PAH sample and the least negative radiocarbon value from the CO2 aliquots from each low PAH sample (ordinate), are plotted against 1/PAH (abscissa) for the four sediment samples. The y-intercept of the linear regression corresponds to very high PAH levels, implying a sample of 100% oil, and yields a radiocarbon estimate of −990‰, comparable to the theoretical value of −1000‰. At a radiocarbon value for modern marsh biomass of 77‰, a background PAH concentration of 91 ng g−1 dw is produced, near what is expected for a background (uncontaminated) level. (B) Stable carbon isotopic data for ramped pyrolysis aliquots (ordinate) against the reciprocal of the aliquot's fraction oil (calculated from Δ14C; abscissa). Solving for 1/foil = 1 in the linear regression, where sample composition is 100% oil, produces a DwH oil δ13C estimate of −27.2‰, which is accurate when compared to direct measurements.
Download figure:
Standard image High-resolution image
This study shares similarities with others that used radiocarbon to measure petroleum-derived contaminants (White et al 2005a, 2008, Ahad et al 2010, Ahad and Pakdel 2013, Mahmoudi et al 2013). Those studies investigate contaminant–sediment interactions and microbial uptake of carbon by separating the contaminant from the sediment using chemical extraction techniques. The RP isotope technique differs because the contaminant is separated from the sediment according to thermochemical stability (Rosenheim et al 2008). Although contaminant–sediment interactions may play a role in the pyrolytic release of oil from sediment, such relationships would have to be examined in comparing different sediment types contaminated with oil. Regardless, this study aims to first establish that sediments with and without oil yield distinct ramped pyrolysis profiles and isotope signatures.
4. Conclusions
- (1)Oil contamination can be identified using ramped pyrolysis and quantified using isotope analysis. Two indicators of oil content, PAH concentration and Δ14C of the organic carbon, explain observed variations in RP reaction profiles. RP profiles differ depending on PAH concentration; samples high in PAHs produce significant pyrolysis at low temperatures and correspondingly low Tmax, whereas samples low in PAHs do not pyrolyze at low temperatures and yield higher Tmax.
- (2)Isotope data from individual RP pyrolyzates aid in constraining the proportions of oil contamination. Subsamples comprising almost entirely of oil (fraction oil of 0.99, calculated from Δ14C) highlight the ability of RP isotope analysis to separate the different carbon sources within an oil-contaminated sediment sample. Stable carbon isotopic data further support the correlation between oil content, high PAH concentration, radiocarbon depletion, and pyrolysis at low temperatures.
- (3)This study establishes a foundation for using ramped pyrolysis isotope analysis on a broader range of samples from different environments and from time series of degradation in these settings. Furthermore, coupling the rather straightforward pyrolysis reaction with new generations of isotope analyzers (e.g. laser cavity ring-down flow-through δ13C analyzers and gas-accepting continuous flow AMS systems Roberts et al 2007) may increase the utility of RP isotope analysis as a screening method for oil contamination in sediments for future spills and continued monitoring of the DwH catastrophe.
Acknowledgments
Analyses were funded by NSF grants EAR-1058517 and EAR-1045845 to BER. MAP was partially supported during his MS research at Tulane University by a grant from Louisiana Sea Grant, through the Office of Coastal Protection and Restoration's Coastal Sciences Assistantship Program, to N Gasparini of Tulane University. Partial funding for TLW was from BP/The Gulf of Mexico Research Initiative: Gulf Integrated Spill Response (GISR) Consortium. Dr C Taylor (Tulane University) is acknowledged for providing Macondo oil for this study. The authors are grateful for constructive comments from three anonymous reviewers that ultimately improved this manuscript.