

Abstract
Tropical peatlands of the western part of insular Southeast Asia have experienced extensive land cover changes since 1990. Typically involving drainage, these land cover changes have resulted in increased peat oxidation in the upper peat profile. In this paper we provide current (2015) and cumulative carbon emissions estimates since 1990 from peat oxidation in Peninsular Malaysia, Sumatra and Borneo, utilizing newly published peatland land cover information and the recently agreed Intergovernmental Panel on Climate Change (IPCC) peat oxidation emission values for tropical peatland areas. Our results highlight the change of one of the Earth's most efficient long-term carbon sinks to a short-term emission source, with cumulative carbon emissions since 1990 estimated to have been in the order of 2.5 Gt C. Current (2015) levels of emissions are estimated at around 146 Mt C yr−1, with a range of 132–159 Mt C yr−1 depending on the selection of emissions factors for different land cover types. 44% (or 64 Mt C yr−1) of the emissions come from industrial plantations (mainly oil palm and Acacia pulpwood), followed by 34% (49 Mt C yr−1) of emissions from small-holder areas. Thus, altogether 78% of current peat oxidation emissions come from managed land cover types. Although based on the latest information, these estimates may still include considerable, yet currently unquantifiable, uncertainties (e.g. due to uncertainties in the extent of peatlands and drainage networks) which need to be focused on in future research. In comparison, fire induced carbon dioxide emissions over the past ten years for the entire equatorial Southeast Asia region have been estimated to average 122 Mt C yr−1 (www.globalfiredata.org/_index.html). The results emphasise that whilst reducing emissions from peat fires is important, urgent efforts are also needed to mitigate the constantly high level of emissions arising from peat drainage, regardless of fire occurrence.
Export citation and abstract BibTeX RIS

Original content from this work may be used under the terms of the Creative Commons Attribution 3.0 licence. Any further distribution of this work must maintain attribution to the author(s) and the title of the work, journal citation and DOI.
1. Introduction
Tropical peatlands cover around 40 Mha (million hectares) and contain up to 90 Gt of carbon (Page et al 2011), an amount of carbon equivalent to that stored in the above-ground biomass of the Amazon rainforest (Fauset et al 2015). The great majority of the tropical peatland resource is located in Southeast Asia with an estimated area of 25 Mha of peatland and a carbon stock of 69 Gt (Page et al 2011). Owing to the thickness of deposits, peatlands in this region are some of the world's most carbon-dense ecosystems, often exceeding 3 000 t C ha−1. But recent, widespread anthropogenic impacts, i.e. deforestation, drainage and fire, mean that these ecosystems are also responsible for some of the world's highest land-use derived greenhouse gas (GHG) emissions (Biancalani and Avagyan 2014).
Among all tropical peatland areas, land cover changes and associated environmental problems are most evident in the western part of insular Southeast Asia. The 15.7 Mha of peatlands in Peninsular Malaysia, Sumatra and Borneo have experienced dramatic land cover changes since 1990 (Miettinen et al 2016), with forest cover dropping from 76% to 29% (and intact forest cover to only 6%) while managed land cover types (industrial plantations and small-holder areas) have simultaneously increased their proportion to 50% of total peatland area. These land cover changes, typically combined with implementation of drainage, have been associated with drastic environmental consequences ranging e.g. from repeated fire events and flooding to biodiversity loss (Page et al 2002, Giam et al 2012, Gaveau et al 2014, Hooijer et al 2015).
Perhaps one of the most significant, yet difficult to quantify, consequences of the abovementioned land cover changes is the carbon flux related to peat oxidation. In their natural waterlogged state the peatlands of Southeast Asia have served as carbon sinks, accumulating large quantities of peat over thousands of years (Page et al 2004, Dommain et al 2011). But drainage, that is typically associated with peatland utilization, often combined with a change in vegetation cover and the use of fertilizers, results in peat oxidation in the upper peat profile (Couwenberg et al 2010, Hooijer et al 2012, Jauhiainen et al 2012, 2014, Couwenberg and Hooijer 2013, Hirano et al 2014, Carlson et al 2015, Sakata et al 2015, Comeau et al 2016). Furthermore, peatland drainage leads to increased flux of dissolved organic carbon (Moore et al 2013, Evans et al 2014) and increased emissions of other greenhouse gases (e.g. CH4, Jauhiainen and Silvennoinen 2012, N2O, Sakata et al 2015). Together these changes in GHG fluxes, along with the loss of any future carbon sequestration by the native peat swamp forest vegetation, have changed Southeast Asian peatlands from one of the Earth's most efficient long-term carbon sinks to a short-term source of carbon emission.
Some earlier estimates exist on the magnitude of annual carbon emissions arising from peat oxidation in Southeast Asia. Hooijer et al (2010) estimated that these emissions were in the range of 97–233 Mt C yr−1 in 2006, while Miettinen et al (2012) concluded that in the peatlands of Peninsular Malaysia, Sumatra and Borneo, industrial plantations alone were the source of 63–84 Mt C yr−1 in 2010. In the light of such high emissions from drained peatlands, Indonesia ranks as one of the world's largest GHG emitters. In recent years the Government of Indonesia has recognised this issue and is beginning to implement ambitious plans for emissions reduction. Set against both governmental and private sector initiatives to reduce carbon losses from peat soils it is critical that there is a robust understanding both of the current likely magnitude of the carbon emissions arising from peat oxidation and their attribution to different land covers.
The objective of this study is to provide up-to-date current (2015) carbon emission estimates from peat oxidation in Peninsular Malaysia, and in the islands of Sumatra and Borneo, and the first cumulative emission estimates since 1990. We utilize newly published updated land cover information (Miettinen et al 2016) together with recently agreed Intergovernmental Panel on Climate Change (IPCC) emission values for tropical peatland areas (IPCC 2014). We exclude carbon emissions from peat fires, emissions of non-CO2 greenhouse gases and dissolved organic carbon from our estimates due to insufficient data to support such calculations. However, we provide discussion on the general level of fire emissions in comparison to the peat oxidation emissions reported in this study.
2. Materials and methods
2.1. Study area
The study area covers the peatlands of Peninsular Malaysia, Sumatra and Borneo (figure 1). For the primary analysis accompanied with full coverage land cover information published in Miettinen et al (2016), the peatland extent was derived from a set of peatland maps as described in the following. For the Indonesian part of the study area (i.e. Sumatra and Kalimantan), the Puslittanak peat map was used as published by Wetlands International (Wahyunto et al 2003, 2004); referred to here as the WI peat atlas map. For the Malaysian part of the study area maps obtained from the European Digital Archive of Soil Maps (Selvaradjou et al 2005) were used. For Peninsular Malaysia, the 1970 Generalized Soil Map of Peninsular Malaysia was used, for Sarawak the 1968 Soil Map of Sarawak and for Sabah the 1974 Soils of Sabah map. The peatlands in Brunei were manually digitized for Miettinen et al (2016) using the Landsat satellite data, Shuttle Radar Topography Mission (SRTM) elevation product (Jarvis et al 2006) and an image of peat swamp forest extent in Brunei in the 1980's (Anderson and Marsden 1984). Altogether these maps cover 15.7 Mha of peatland, of which 13.0 Mha are located in Indonesia.

Figure 1 Study area with 2015 land cover distribution on peat (regrouped from Miettinen et al 2016). Abbreviations used in the map: PM = Peninsular Malaysia, Sar = Sarawak, SS = South Sumatra, WK = West Kalimantan and CK = Central Kalimantan. PSF in the legend stands for peat swamp forest.
Download figure:
Standard image High-resolution imageDue to uncertainties in the extent of peatland and their direct effects on the carbon emission estimates provided in this paper, we also conducted a sensitivity analysis with a further two peatland maps covering the Indonesian part of the study area as well as the combination of all three available maps: 1) the 1990 Regional Physical Planning Programme for Transmigration (RePPProT) map (RePPProT 1990), 2) the 2011 Balai Besar Penelitian dan Pengembangan Sumberdaya Lahan Pertanian (BBSDLP) map (Ritung et al 2011) and 3) the combination of the WI, RePPProT and BBSDLP maps. These three peatland extents used in the sensitivity analysis cover 11.2 Mha, 11.3 Mha and 15.7 Mha of peatland respectively in the Indonesian part of the study area, compared to the 13.0 Mha of the WI peat atlas map used in the primary analysis. Land systems units in the RePPProT map were interpreted from aerial photographs supplemented with remote sensing imagery in the late 1980's, whereas the WI peat atlas map was created by a combined analysis of existing maps and satellite images in the early 2000's. Finally, the BBSDLP map is based on the WI peat atlas map with some modifications on peat extent, most notably the exclusion of shallow peatlands (<0.5 m depth).
2.2. Land cover information
Land cover information published in Miettinen et al (2016) was used in this study. The mapping was based on visual image interpretation and manual polygon delineation in 1:50 000–1:100 000 scale on Landsat and SPOT (Satellite Pour l'Observation de la Terre) satellite images. Three full coverage land cover classifications (1990, 2007 and 2015) and two additional industrial plantation classifications (2000 and 2010) were available. All the classifications were performed by the same person using the same mapping approach. Short descriptions of the land cover classes used in this study are provided in table 1. Note that three original classes of 'Seasonal water', 'Ferns/low shrub' and 'Clearance' mapped in Miettinen et al (2016) were combined into one 'Open undeveloped' class since the same IPCC carbon emission factor (see section 2.3) would in any case have been applied to these classes. For more details of the classification procedure and satellite image datasets used to create the land cover maps the reader is referred to Miettinen et al (2016).
Table 1. IPCC (2014) peat oxidation emission factors (EF) used for different land cover types (t C ha−1 yr−1) in the primary analysis. PSF stands for peat swamp forest. Land cover class descriptions based on Miettinen et al (2016).
| Land cover class | Short class description | Emission factor | IPCC definitions/assumptions |
|---|---|---|---|
| Water | Permanent water bodies | 0.0 | |
| Pristine PSF | PSF with no clear signs of human intervention | 0.0 | Not logged, no drainage |
| Degraded PSF | PSF with clear signs of disturbance detected between 1990–2015, typically in the form of logging tracks or canals and/or opened canopy | 2.65 | Forest land and cleared forest land (shrubland), drained (Note, the original IPCC value is halved, see the text for discussion) |
| Tall shrub/secondary forest | Shrub or secondary forest with average height above 2 m | 5.3 | Forest land and cleared forest land (shrubland), drained |
| Open undeveloped | Open areas with either no vegetation or ferns, grass or shrub with average height less than 2 m | 9.6 | Grassland, drained |
| Small-holder area | Mosaic of housing, agricultural fields, plantations, gardens, fallow shrub/fern land etc. | 14.0 | Cropland and fallow, drained |
| Industrial plantations | Large scale industrial plantations, mainly oil palm and Acacia | 15.0 | Plantations, drained, unknown or long rotations |
| Urban | Urban and other built-up areas including a large proportion of unpaved areas due to the large scale of the visual image interpretation | 9.6 | The IPCC grassland EF was used |
| Mangrove | Areas considered to be mangrove forest although they were located within the peatland maps | n.a. | Considered not to have peat |
For the interpretation of the results of this study, it is important to clarify two issues regarding the land cover information derived from Miettinen et al (2016). Firstly, the actual land tenure of the 'Small-holder area' class is unknown. The classification was based on the patchy landscape patterns which are typically found in small-holder dominated areas. Secondly, due to the manual delineation of land cover polygons at the 1:50 000–1:100 000 scale the 'Urban' class is not limited to buildings and paved areas, but contains largely unpaved surfaces.
Land cover information for the RePPProT and BBSDLP maps used for the peatland extent sensitivity analysis was only available in areas where these maps overlap with the WI peat atlas maps used in the land cover change analysis (Miettinen et al 2016). The overlapping area for the RePPProT map was 81.5% while the BBSDLP map had a 92.0% overlap with the Wetland International maps. For emission calculations performed for the sensitivity analysis, the total extent of different land cover types in the RePPProT and BBSDLP maps was estimated by applying the land cover distribution percentages of the overlapping areas to the total peatland extent in the respective maps. For the combination of all three available peatland maps (WI, RePPProT and BBSDLP) we estimated the land cover distribution by applying the land cover distribution percentages of the WI peat atlas map to the total area of the combined map.
2.3. Emission factors and carbon emission calculation principles
Permanent water bodies on peatland areas (i.e. the 'Water' class) and the 'Pristine PSF' class were assumed to have zero carbon emissions (table 1) according to the IPCC '2013 Supplement to the 2006 IPCC Guidelines for National Greenhouse Gas Inventories: Wetlands' (IPCC 2014) and Indonesia National Carbon Accounting System (INCAS; Krisnawati et al 2015) guidelines. Furthermore, the 'Mangrove' class was excluded from the emission calculations since in this paper we concentrate on peatland emissions, and areas classified as mangrove in the peatland maps (0.4%) were considered errors of peatland extent.
From the perspective of peat oxidation estimation, the lack of any regional coverage information on the extent and intensity of peatland drainage networks is a great disadvantage. In this study we use the IPCC (2014) emission factors for different land cover types with inherently assumed drainage status and combine this information with the land cover distribution derived from Miettinen et al (2016). Although we think that this approach results in reasonably reliable emission estimates on a regional level, we acknowledge that it may lead to under or overestimations at a sub-regional level in areas with atypical drainage networks in a given land cover class. Due to the great uncertainty of the extent of areas affected by drainage, particularly in degraded peat swamp forests, the 'Degraded PSF' class emission factor was reduced to half of the original IPCC value in the primary analysis. This is considered to be a conservative estimate, since logging operations on peatland areas typically leave behind some sort of drainage network. The effect of a range of emission factors for the 'Degraded PSF' class on total peatland emissions (assuming around 50%–100% of areas are affected by drainage, equalling to an emission factor of 2.65–5.3 t C ha−1 yr−1 for the entire class) is also analysed in the results.
For consistency of results, we chose to use the IPCC emissions factor for drained grassland areas (9.6 t C ha−1 yr−1) for the 'Open undeveloped' class in the primary analysis. However, in INCAS (Krisnawati et al 2015) burned open areas are considered to have noticeably lower emission factor (4.5 t C ha−1 yr−1) than unburned areas. Since it can be assumed that most of the open undeveloped peatland areas in the region have burned at least once, the IPCC emission value may be an overestimation. Again, the effect of the emission range (4.5–9.6 t C ha−1 yr−1) for the 'Open undeveloped' class on the total peatland carbon emissions is analysed in the results.
As a simplifying assumption, we applied the IPCC (2014) general emission factor of 15 t C ha−1 yr−1 for industrial plantations in the primary analysis. The general industrial plantation emission factor, rather than the separate oil palm and Acacia emission factors, was applied because the exact crop types are not always clear for several reasons. Firstly, the primary plantation species is sometimes mixed with other plantation types and cropland in industrial plantation areas. Secondly, plantation crops are not always known in areas that are in the clearing or planting stages. And finally, substantial plantation areas were identified where a crop had been planted but only survived in a small fraction of the land, leaving a largely open plantation area that may be more similar to cropland in terms of emission characteristics (IPCC cropland emission factor being 14.0 t C ha−1 yr−1). Furthermore, most recent studies on plantation emissions (Carlson et al 2015) indicate that the difference in emissions between oil palm and Acacia plantations may not be as large as considered by IPCC (2014). However, for the completeness of the analysis, we also evaluated the potential range of emissions that would arise from applying separate emission factors for industrial oil palm (11.0 t C ha−1 yr−1) and Acacia (20.0 t C ha−1 yr−1) plantations (extent derived from Miettinen et al 2016).
In the absence of an emission factor for a specific settlement land cover type, IPCC consider it good practice to use the emission factor of the land-use category that is closest to the national conditions of drained organic soils in settlements. Following this principle, we chose to use the grassland emission factors for the 'Urban' class (9.6 t C ha−1 yr−1), under the assumption that these areas are effectively drained in order to avoid flooding, and thereby also have elevated emissions due to lowered water table levels. It should be noted, however, that the 'Urban' class makes a rather small contribution to the overall emissions due to its very limited extent (0.3%).
Three different sets of calculations were made. 1) The 1990, 2007 and 2015 yearly carbon emissions arising from peat oxidation were calculated by applying the above described emissions factors to the extent of respective land cover classes covered by the WI peat atlas map. 2) The same principle of calculations was applied to the RePPProT, BBSDLP and the combination of the three available maps during the peatland extent sensitivity analysis. 3) In order to estimate the cumulative emissions since 1990, we needed to simulate the land cover distribution for all the years since 1990 for which we did not have data. In an attempt to simulate the progression of changes in the peatlands of the region in a more realistic manner, change trends were derived from the plantation expansion results in Miettinen et al (2016), providing five time steps (1990, 2000, 2007, 2010 and 2015) instead of just the three full land cover mapping time steps (1990, 2007 and 2015). Thus, the 2000 and 2010 land cover distributions were first estimated using the same 'progress of change' as the plantation expansion. This means that e.g. the percentage of the total plantation expansion 1990–2007 reached by 2000 was used to estimate the extent of all land cover types at 2000 (i.e. assuming that all the classes had experienced the same percentage of the 1990–2007 changes by the year 2000 as the plantation class). After the year 2000 and 2010 land cover distributions had been estimated in this manner, the land cover distributions for the remaining years were derived with linear interpolation. Finally, carbon emissions arising from peat oxidation were calculated for each year by applying the above described emissions factors to the extent of the respective land cover classes. These yearly emissions were then summed up to create an estimate for the cumulative emissions since 1990.
In calculating emissions, we focus solely on below-ground (peat) emissions and do not account for any CO2 uptake by or loss from changes in above-ground biomass. Conversion of peat swamp forest to other land covers will result in a large, one-off carbon loss through removal of the forest vegetation but subsequent forest regrowth and land use activities, e.g. for plantation agriculture, may result in short- or medium-term carbon sequestration, but much lower vegetation carbon density values. It should be noted, however, that in tropical peatlands the majority of the carbon stocks are stored in the peat soils and that emissions from the peat, rather than from the above-ground biomass, are the most significant (Hergoualc'h and Verchot 2011, Page et al 2011).
In our calculations we use only the mean estimate emission values from IPCC (2014). The 95% confidence intervals are not reported as they are strongly influenced by a small number of studies in specific local conditions, which may not provide representative information for our large scale regional analysis, where such local variations within the region are likely to be balanced out and a result closer to the mean estimate is expected. The emission estimates presented in this paper should be considered as best estimate values for this type of regional level analysis with an unknown associated error arising from the emission factors themselves. We analyse separately the variations in emission estimates caused by the selection of emission factors for different land cover classes and by the uncertainty of the extent of peatland areas.
3. Results
Using the emission factors outlined in table 1, the total yearly carbon emissions from peat oxidation in the 15.7 Mha of peatland in Peninsular Malaysia, Sumatra and Borneo in 2015 sum up to 146.2 Mt C yr−1 (table 2). 44.0 % (or 64.3 Mt C yr−1) of these emissions come from industrial plantations, followed by 33.6% (49.2 Mt C yr−1) of emissions from the small-holder areas. Thus, altogether 77.6% of all emissions come from different types of managed land cover. Among the sub-regions, Sumatra has the highest emissions (79.5 Mt C yr−1 or 54.4%) due to the large extent of both small-holder areas and industrial plantations. Malaysian peatlands are estimated to emit 26.3 Mt C yr−1 in 2015 and Indonesian (Sumatra and Kalimantan) 119.7 Mt C yr−1, while the remaining 0.2 Mt C yr−1comes from the peatlands in Brunei.
Table 2. Yearly carbon emissions in 2015 from peat oxidation (Mt C yr−1) from different land cover types on peat for selected provinces (Riau, South Sumatra, West and Central Kalimantan in Indonesia) and states (Sarawak in Malaysia) as well as for Sumatra, Kalimantan and Malaysia as a whole. PSF stands for peat swamp forest.
| Riau | South Sumatra | Total Sumatra | West Kalimantan | Central Kalimantan | Total Kalimantan | Sarawak | Total Malaysia | Total study area | ||
|---|---|---|---|---|---|---|---|---|---|---|
| Degraded PSF | 1.82 | 0.20 | 2.53 | 2.03 | 2.80 | 5.33 | 1.02 | 1.53 | 9.45 | 6.5 |
| Tall shrub/secondary forest | 0.46 | 1.67 | 2.48 | 0.82 | 3.57 | 5.47 | 0.81 | 1.18 | 9.20 | 6.3 |
| Open undeveloped | 2.44 | 1.44 | 4.86 | 1.97 | 4.15 | 7.61 | 0.22 | 1.11 | 13.6 | 9.3 |
| Small-holder area | 21.0 | 3.80 | 33.5 | 2.78 | 4.26 | 9.53 | 1.97 | 6.07 | 49.2 | 33.6 |
| Industrial plantation | 18.1 | 9.27 | 36.1 | 5.28 | 3.66 | 12.2 | 10.9 | 16.1 | 64.3 | 44.0 |
| Urban | 0.03 | 0.00 | 0.07 | 0.00 | 0.02 | 0.04 | 0.10 | 0.36 | 0.49 | 0.3 |
| Total | 43.9 | 16.4 | 79.5 | 12.9 | 18.5 | 40.1 | 15.0 | 26.3 | 146.2 | 100.0 |
If the emission factor for the 'Degraded PSF' class is raised to the IPCC drained forest land value (5.3 t C ha−1 yr−1) assuming that all degraded forest areas are affected by some sort of drainage, the class would emit 18.9 Mt C yr−1. This gives us a potential range of emissions from the 'Degraded PSF' areas of 9.5–18.9 Mt C yr−1. Similarly, if the 'Open undeveloped' class is assumed to emit somewhere between the INCAS (Krisnawati et al 2015) estimate for burned open areas (4.5 t C ha−1 yr−1) and the IPCC (IPCC 2014) estimate used in calculations for table 2 (9.6 t C ha−1 yr−1), the potential yearly emission range would be 6.4–13.6 Mt C yr−1. If separate emission factors for industrial oil palm (11.0 t C ha−1 yr−1) and Acacia (20.0 t C ha−1 yr−1) plantations are used, they would emit 34.2 Mt C yr−1 and 22.6 Mt C yr−1 respectively. This, together with a small area of unknown plantations (0.7 Mt C yr−1), would result in total yearly emissions of 57.5 Mt C yr−1 from industrial plantations compared to 64.3 Mt C yr−1 using the general plantation emission factor of 15 t C ha−1 yr−1 applied in the primary analysis. On the other hand, if the general industrial plantation emission factor of 15.0 t C ha−1 yr−1 is used for all smallholder areas (assuming that large proportions of them are woody plantations), the emissions would be 52.7 Mt C yr−1 instead of the 49.2 Mt C yr−1 presented in table 2. If all of these uncertainties arising from the emission factors are combined, the total yearly emissions from the peatlands in the study area would be somewhere between 132.2 Mt C yr−1 and 159.2 Mt C yr−1.
Another source of uncertainty for the estimates presented in table 2 comes from the extent of peatland areas. The WI, RePPProT and BBSDLP maps available for Indonesia have 13.0 Mha, 11.2 Mha and 11.3 Mha of peatland in Sumatra and Kalimantan (i.e. the Indonesian part of Borneo), while, when used in combination, the peatland area is 15.7 Mha. An analysis of the effects of this variation in peatland extent (figure 2) reveals that estimates for carbon emissions from peat oxidation in Sumatra and Kalimantan in 2015 range from the minimum of 92.9 Mt C yr−1 (RePPProT) to the maximum of 144.4 Mt C yr−1 if all maps are combined. In comparison, the primary analysis of the study using the WI peat atlas map alone results in 119.7 Mt C yr−1 for Sumatra and Kalimantan. The great majority of the differences between the three available maps come from differences in the extent of small-holder areas which are considered to have peat soil in the WI peat atlas map, but not considered to have peat soil in one or both of the other two maps. The WI, RePPProT and BBSDLP maps have 3.1 Mha, 1.6 Mha and 2.5 Mha of small-holder areas on peatland. This translates into yearly carbon emissions from small-holder areas of 43.0 Mt C yr−1, 22.8 Mt C yr−1 and 34.8 Mt C yr−1, respectively. In all other land cover types the yearly emission estimates have a maximum of 3.8 Mt C yr−1 difference between the three maps. The combined map naturally only expands the land cover extent in the same proportion as in the WI peat atlas map due to the way it was constructed.
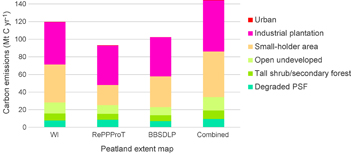
Figure 2 Comparison of 2015 carbon emissions (Mt C yr−1) from peat oxidation based on the WI, RePPProT and BBSDLP peatland extent in Indonesia (Sumatra + Kalimantan) as well as their combination. PSF stands for peat swamp forest.
Download figure:
Standard image High-resolution imageUsing again the WI peat atlas map primary emission analysis data, we can evaluate the changes in emission levels and sources since 1990 (figure 3). Altogether 51.9 Mt C yr−1 (i.e. 36% of the 2015 emission level of 146.2 Mt C yr−1) was emitted from peatlands due to peat oxidation in 1990. Less than half of this came from small-holder areas and industrial plantations, which in the year 2015 contributed 77.6% of all carbon emissions. The most rapid increase over recent years can be seen in the industrial plantation class. Emissions from industrial plantations have nearly doubled in eight years from 34.3 Mt C yr−1 in 2007 to 64.3 Mt C yr−1 in 2015.

Figure 3 Estimated yearly carbon emissions from peat oxidation (Mt C yr−1) from different land cover types on peat in the study area in 1990, 2007 and 2015. The areas of the yearly pie charts are in rough proportion to the total yearly emissions in 1990 (51.9 Mt C yr−1), 2007 (120.2 Mt C yr−1) and 2015 (146.2 Mt C yr−1). PSF stands for peat swamp forest.
Download figure:
Standard image High-resolution imageIt is estimated that around 2.5 Gt C has been emitted by peat oxidation from the peatlands of Peninsular Malaysia, Sumatra and Borneo since 1990. The cumulative emissions (figure 4) highlight the increasing importance of industrial plantation areas as emission sources since 2000, the significance of small-holder areas throughout the study period and the exponentially increasing total emissions.

Figure 4 Cumulative carbon emissions from peat oxidation (Mt C) from different land cover types on peat in the study area since 1990. PSF stands for peat swamp forest.
Download figure:
Standard image High-resolution image4. Discussion
In this paper we have presented estimates of carbon emissions from peat oxidation in the peatlands of Peninsular Malaysia, Sumatra and Borneo based on the IPCC emission factors (IPCC 2014) and recent land cover information (Miettinen et al 2016). Our results indicate that in the year 2015, altogether around 146.2 Mt C yr−1 was emitted from the peatlands of the study area, merely via peat oxidation. Around 44.0% of this (64.3 Mt C yr−1) was emitted from industrial plantations, followed by a 33.6% share (49.2 Mt C yr−1) from small-holder areas. Cumulative emissions since 1990 are estimated to be in the order of 2.5 Gt C. To put these emission numbers into a wider context, the 2015 annual emission value corresponds to about 65% of the annual C emissions from Malaysia and Indonesia arising from fossil fuel burning, cement production and gas flaring (215 Mt C yr−1; http://cdiac.ornl.gov/trends/emis/top2011.tot) and is equivalent to around 1.6% of global fossil fuel emissions (9 Gt C yr−1; ibid). The cumulative emission of 2.5 Gt C since 1990 represents the loss of about 4% of the Southeast Asian regional peat carbon pool of 69 Gt (Page et al 2011) in only 25 years.
The new estimates published in this paper are generally somewhat lower than earlier estimates available for carbon emissions from peat oxidation (Hooijer et al 2010, Miettinen et al 2012). For example Miettinen et al (2012), assuming an emission range of 20–27 t C ha−1 yr−1, estimated 63–84 Mt C yr−1 carbon emissions from industrial plantations alone in 2010, while according to this study they would have been around 47 Mt C yr−1 in 2010. This difference is caused by the use of rather more conservative IPCC emission factors in this study (e.g. 15 t C ha−1 yr−1 for industrial plantations) compared to the higher emission factors applied in earlier studies. In this regard, it should be noted that the IPCC emission factors do not take into account the fact that emissions after peatland drainage are not constant. In fact, they vary as water tables and peat characteristics change. In typical plantation developments on peatland in Southeast Asia, the initial drainage usually involves a rapid lowering of the water table to depths of around or below 1 metre to over 3 metres. In the first few years after drainage, the peat surface changes rapidly through a combination of peat oxidation and soil compression. In this transition phase, carbon emissions are several times higher than the default emission factors the IPCC provides for the later more stable phase of plantation management (Hooijer et al 2012, Page and Hooijer 2014). Thus by using IPCC (2014) emission factors, our estimates of total emissions from the plantation sector can be considered to be conservative.
The IPCC (2014) guidelines provide different emission factors for oil palm (11.0 t C ha−1 yr−1) and Acacia (20.0 t C ha−1 yr−1) plantations, fuelling policy debate on the effects of plantation species selection on carbon emissions. The main goal of this study was to provide estimates on the general level of magnitude of current and cumulative carbon emissions in the peatlands of the study area since 1990. Due to the wide range of conditions (with both temporal and geographical variation) in industrial plantations of the study area, combined with recent information (Carlson et al 2015) suggesting that the difference in carbon emissions between the two plantation species may be somewhat smaller than indicated by IPCC (2014), a general industrial plantation emission factor (IPCC 2014; 15.0 t C ha−1 yr−1) was used in the primary analysis in this study. We believe that this decision results in more robust overall regional emission estimates over the study period but with the caveat that the results of this study do not provide information for any policy discussion concerning the preference between oil palm and Acacia in insular Southeast Asian peatland plantations.
It is important to understand that in this paper we have only estimated carbon emissions from peat oxidation. In addition to this, peatland development induces changes in other carbon and GHG flux terms, e.g. a loss of stored carbon in forest biomass, fluvial runoff of dissolved organic carbon (Moore et al 2013, Evans et al 2014) and particulate organic carbon flushed into aquatic ecosystems, and changes in other greenhouse gas fluxes, including reduced emission of CH4 from the drained peat surface (Jauhiainen et al 2005) but increased emission from drainage ditches (Jauhiainen and Silvennoinen 2012) and an increase in N2O emissions, particularly from cropland (e.g. Jauhiainen et al 2012, 2014, Sakata et al 2015). With the information available for this study, and in particular the lack of detailed drainage information that could be used to estimate fluvial carbon losses and ditch-derived CH4 emissions, we were not able to calculate reliable estimates for these latter sources of carbon loss and gas emissions. Thus, again, our estimates of GHG emissions arising from land cover and land use change are conservative.
An underlying uncertainty in all of the emission estimates presented above relates to the accuracy of the peatland extent in the peatland maps used in the primary analysis in this paper. A comparison of the WI peat atlas maps (Wahyunto et al 2003, 2004) used in the Indonesian part of the study area to two other peatland maps (RePPProT 1990, Ritung et al 2011) revealed 13%–14% smaller peatland extent, resulting in up to 22% lower emission estimates if calculated based on these two maps, using the same set of emission factors. On the other hand, an analysis based on field sample data (Jaenicke et al 2008) have indicated a 10% underestimation of the peat extent presented in the WI peat atlas maps, indicating a potentially clear underestimation of the emission estimates presented in this study. A combination of the three maps available for this study, resulted in 21% increases in the extent of peatland areas and emission estimates (as compared to the benchmark WI peat atlas map used in the primary analysis). We therefore believe that the emission estimates obtained in the primary analysis of this study can be placed somewhere in the average range of the potential variation of emissions caused by uncertainties in the extent of peatland areas in the region.
In summary, it has to be acknowledged that the estimates presented in this paper include considerable but largely unquantifiable uncertainties (e.g. due to uncertainties in peat distribution, extent of drainage and its effect on class-wise emission factors etc.). The estimates presented in this study should only be considered to provide a general best estimate level of magnitude of emissions for the study area, and should be treated with caution for any sub-regional or sectoral analyses or comparisons. The remaining uncertainties in our evaluation and quantification of peat oxidative emissions could be reduced by (i) improved accuracy of the peat distribution data; (ii) including a specific CO2 emission factor for the initial period (up to 5 years) following peatland deforestation and drainage; and (iii) including appropriate emission factors for fluvial carbon fluxes, which can be significant in heavily drained peat landscapes (Moore et al 2013), and for non-CO2 greenhouse gas emissions from both peat and water surfaces (CH4 and N2O) across the full range of land cover classes. In addition, improved information, e.g. on the extent and intensity of drainage systems as well as on within-class land cover variation in managed peatland areas would further improve emission estimates.
In comparison to peat oxidative emissions, emissions from peatland fires have attracted a high degree of attention since the 1997–1998 catastrophic El Niño fire event (e.g. Page et al 2002, van der Werf et al 2010, Gaveau et al 2014, Konecny et al 2016). Most recently, the 2015 severe fire season in equatorial Southeast Asia resulted in high carbon dioxide emissions with estimates for the entire year ranging from 289 Mt C yr−1 (Huijnen et al 2016) to 341 Mt C yr−1 (Global Fire Emission Database; (www.globalfiredata.org/index.html)), as opposed to around 146 Mt C yr−1 emissions estimated from peat oxidation in our study area. However, it should be recognised that while peat fires and their associated carbon emissions may cause temporary peaks, the carbon emissions from peat oxidation are occurring continuously, year-round and can be of a similar magnitude. For example, since 1997, there have been eight years during which the total fire emissions from the entire equatorial Southeast Asian region may have exceeded annual peat oxidation emissions from Peninsular Malaysia, Sumatra and Borneo, but 11 years in which peat oxidation emissions have exceeded those from fire (figure 5). In only three years (1997, 2006 and 2015) have emissions from burning peat been estimated to exceed those from peat oxidation. Total cumulative C emissions since 1997 are in the order of 2.9 Gt C from fires (of which 1.2 Gt is from peat fires) and 2.0 Gt C from peat oxidation. Fire induced carbon dioxide emissions over the past ten years average at 122.1 Mt C yr−1.

Figure 5 Comparison of yearly peat oxidation carbon emission estimates (Mt C yr−1) for Peninsular Malaysia, Sumatra and Borneo derived in this study and carbon dioxide emissions (Mt C yr−1) from fires in equatorial Southeast Asia derived from the Global Fire Emission Database (GFED; (www.globalfiredata.org/index.html)). Total fire emissions include grass/shrubland fires, deforestation/degradation fires, peat fires and agricultural waste burning.
Download figure:
Standard image High-resolution image
The outcomes from this study emphasise the high priority that should be given to improved peatland management in Southeast Asia in order to reduce currently high levels of land-based carbon emissions. The results emphasise that whilst reducing emissions from peat fires is important, urgent efforts are also needed to mitigate the constantly high level of emissions arising from peat drainage. Since any effort made to reduce oxidative emissions in drained peatlands will involve increasing peat water levels, this will also have a beneficial effect in reducing the risk of fire and fire-related emissions. To this end, Indonesia and Malaysia are encouraged to consider a range of measures to reduce their peat-derived carbon emissions, including actively protecting and rehabilitating all remaining peat swamp forests, implementing best practice water management in drained peatlands which may include trials with alternative plantation crops that are tolerant of high(er) water levels, and re-wetting and re-foresting critical areas of degraded peatland where both oxidative emissions and fire risk are particularly high (Page and Hooijer 2016).
Acknowledgments
SEP acknowledges a period of research leave granted by the University of Leicester that allowed her to contribute to the writing of this paper.