


Abstract
This study focuses on future very hot summers associated with severe heatwaves and record-breaking temperatures in France. Daily temperature observations and a pair of historical and scenario (greenhouse gas radiative concentration pathway 8.5) simulations with the high-resolution (∼12.5 km) ALADIN regional climate model provide a robust framework to examine the spatial distribution of these extreme events and their 21st century evolution.
Five regions are identified with an extreme event spatial clustering algorithm applied to observed temperatures. They are used to diagnose the 21st century heatwave spatial patterns. In the 2070s, we find a simulated mega-heatwave as severe as the 2003 observed heatwave relative to its contemporaneous climate. A 20-member initial condition ensemble is used to assess the sensitivity of this future heatwave to the internal variability in the regional climate model and to pre-existing land surface conditions. Even in a much warmer and drier climate in France, late spring dry land conditions may lead to a significant amplification of summer extreme temperatures and heatwave intensity through limitations in evapotranspiration. By 2100, the increase in summer temperature maxima exhibits a range from 6 °C to almost 13 °C in the five regions in France, relative to historical maxima. These projections are comparable with the estimates given by a large number of global climate models.
Export citation and abstract BibTeX RIS

Original content from this work may be used under the terms of the Creative Commons Attribution 3.0 licence.
Any further distribution of this work must maintain attribution to the author(s) and the title of the work, journal citation and DOI.
Corrections were made to this article on 21 July 2017. The supplementary data was added.
1. Introduction
Recent decades have seen the repeated occurrence of hot summers in France characterized by intense heatwaves and daily record temperatures. In France and Western Europe, the 2003 summer is the warmest on record, with seasonal mean temperature anomalies of about +3.2 °C on average over France (compared to the 1981–2010 climatology; communication from Météo-France). These warm temperatures were mainly associated with two heatwaves, in June and August, the latter leading to record values of daily minimum and maximum temperature in many regions in France (Beniston 2004, Schär et al 2004, Fink et al 2004). The August heatwave of 2003 is the most intense heatwave observed during the instrumental period over France and Central Europe and has therefore been called a mega-heatwave because of its exceptional characteristics (Miralles et al 2014, Fischer 2014). The 2015 summer was the second warmest on record in France since 1901 (+1.5 °C; relative to 1981–2010), with three heatwaves occurring during this summer and leading to daily temperature extremes and new record-breaking temperatures in the core of the warm spells.
Over Western Europe, the occurrence of a heatwave is dependent on the establishment and duration of specific synoptic conditions such as the very intense atmospheric blocking in August 2003 (Fink et al 2004, Ogi et al 2005, Trigo et al 2005, Miralles et al 2014). The occurrence and persistence of this atmospheric circulation pattern are influenced by the large scale circulation and remote teleconnections (Black et al 2004, Cassou et al 2005, Ogi et al 2005, Black and Sutton 2006, Carril et al 2007). However, many studies (e.g. Black et al 2004, Fischer et al 2007, Garcia-Herrera et al 2010, Stéfanon et al 2012, Miralles et al 2014) have also shown that the 2003 summer extreme temperatures could not have been reached without pre-existing large negative soil moisture anomalies. Other interactions between the regional climate components can also influence heatwave temperatures, such as dust aerosols during the 2006 observed event (Nabat et al 2015).
Climate models suggest that human influence is expected to significantly increase the frequency, duration and intensity of heatwaves in Europe (Meehl and Tebaldi 2004, Stott et al 2004, Fischer and Schär 2010, Christensen et al 2013, Christidis et al 2015, Russo et al 2014, Lau and Nath 2014, Lemonsu et al 2014, Schoetter et al 2015, Ouzeau et al 2016). Over Europe, in addition to surface warming, these models also suggest a decrease in soil moisture, which can partly be explained by an increase in evapotranspiration in spring and a decrease in precipitation in summer (Collins et al 2013). Note that these projections are commonly assessed based on a recent reference period, often selected as the last decades of the 20th century. Very few studies have looked at the occurrence and mechanisms of future mega-heatwaves in the context of their contemporaneous climate.
Our main objective is to investigate the possible occurrence of a mega-heatwave in a much warmer mean climate as well as the relevant physical mechanisms. We focus on heatwaves as extreme as the 2003 event with respect to their contemporaneous mean climate. First, a new observed daily temperature dataset for France is used to provide homogeneous regions (or clusters) of spatially co-varying summer extreme temperature events based on a statistical clustering technique. Then, an historical and 21st century climate simulation performed with the ALADIN regional climate model (at ∼12 km spatial resolution) is used to identify the occurrence of future record-breaking temperatures and related mega-heatwaves. We find a simulated mega-heatwave in the second part of the century (in summer 2075) that is as extreme as that of 2003 in terms of anomalous extreme temperatures. A 20-member initial condition ensemble initialized one month before the heatwave onset is used to examine a possible influence of land-atmosphere interactions on surface extreme temperature amplification. We focus on the influence of pre-existing soil moisture conditions and related feedbacks which are known to play a significant role on the heatwave temperatures under current conditions. Finally, we use observed current record-breaking temperatures and their projected changes to provide a rough estimate of the summer daily temperature maxima that could be reached by 2100.
2. Data and method
2.1. Observed and simulated daily maximum temperatures
Observed daily maximum temperatures (Tmax) over France are taken from the SQR (Séries Quotidiennes de Référence, Reference Daily Series in English) dataset developed by Météo-France. The monthly series were carefully selected and homogenized from 1950 to 2012 (Gibelin et al 2014). From this first selection, non-homogenized Tmax were extracted, with a threshold of maximum number and magnitude of breaks detected when homogenizing the monthly series (see Dubuisson and Moisselin 2006 for more details and figure S1 stacks.iop.org/ERL/12/074025/mmedia for the spatio-temporal distribution of the stations).
We consider two simulations of the ALADIN (version 5.3) regional climate model (RCM; Colin et al 2010, Tramblay et al 2013) at a very high-resolution (0.11° or ∼12.5 km): one historical (ALADIN-HIST, with observed natural and anthropogenic forcings, 1950–2005) and the continuing future simulation (ALADIN-SCEN, 2006–2100) under the business-as-usual scenarios of green house gases (GHG) and aerosols emissions, the Representative Concentration Pathways 8.5 (RCP8.5; van Vuuren et al 2011). ALADIN-HIST and ALADIN-SCEN share the same vegetation and land cover. These two simulations are part of the World Climate Research Program Coordinated Regional Downscaling Experiment for Europe (EURO-CORDEX, Jacob et al 2014). The lateral boundary conditions and the initial conditions prescribed to ALADIN are provided by the CNRM-CM5 global climate model (GCM; Voldoire et al 2012). Note that the driving CNRM-CM5 GCM and the driven ALADIN RCM have very similar physical parameterizations ensuring physical consistency.
We also use a large (20 members) initial condition ensemble (ALADIN-LE) of simulations of the 2075 summer. The ensemble simulations use the EURO-CORDEX domain and cover the full 92-day period of the summer months (June, July and August; JJA). All ensemble members have exactly the same lateral and initial conditions as those of the ALADIN-SCEN simulation (the first member of the ensemble). A small random offset (∼10−4 ppm) to the initial CO2 concentration was added to each ensemble member. This very small perturbation serves to create spread among the ensemble members as internally-generated variability increases with time (see Sanchez-Gomez and Somot 2016 for more details on ALADIN internal variability over a Euro-Mediterranean domain).
Finally, an ensemble of historical and RCP8.5 simulations from 29 global climate models (one simulation per model; see supplementary table for the list of models) of the Coupled Model Intercomparison Project Phase 5 (CMIP5; Taylor et al 2012) is also used to estimate an uncertainty range for the summer record maximum value in 2100, as defined below.
2.2. Summer record maximum value
On a given day, a record is broken at the nth year after the initialization when Tmax (year = n) is greater than the values of all previous years on that day. Records are independently estimated for each JJA calendar day and for each station (or model grid point). In this paper we are interested in the number of records broken in summer as well as the value of the record, as developed below.
We first focus on the yearly evolution of the total number of records broken in summer over France (i.e. each year the number of broken records is simply the total number of records summed over all JJA days and stations). This record evolution is shown under its normalized form, meaning that we compare this number with respect to that of a stationary climate (1 for all years) which is assumed to be consistent with the beginning of the observations (Bador et al 2016; see also Supporting Information S1 for more details).
We also focus on the actual value of a record-breaking temperature, and more specifically on the summer record maximum value (referred to as the record maximum value thereafter). The record maximum value in year X corresponds to the maximum value of Tmax over all the summer days from the initial year to year X. In a given year, record-breaking temperatures are a necessary but not sufficient condition for a record maximum value to be broken. A record maximum value is established if across each JJA day at least one of the record-breaking temperatures exceeds the previous record maximum value.
2.3. Spatial clustering of extreme events
To identify homogeneous regions in France in terms of summer extreme temperatures we use a clustering algorithm originating from multivariate extreme value theory (Coles et al 2001, Beirlant et al 2004, de Haan and Ferreira 2006, Resnick 2007). This technique is suitable to extract spatial dependencies from series of seasonal maxima. Stations with a similar interannual evolution of summer Tmax maximum are gathered together in K clusters. Note that no geographical information is used to cluster the stations. Instead, we use a statistical distance measuring the proximity of two stations with respect to their maxima (Bernard et al 2013 and Bador et al 2015; see supporting information S2 for more details).
The clustering algorithm is applied to the SQR observations over the period with maximum and consistent station data availability (1980–2010, see figure S1). The algorithm identifies five well defined geographical regions: South-West France (SW), Eastern France (EA), Britany (BR), Northern France (NO) and the Mediterranean region (ME). These regions can be used to characterize the typical spatial extent of record-breaking temperatures and heatwaves (figure 1). ME and SW are clearly separated due to competing influences from the Mediterranean Sea and the Atlantic. The sensitivity of the results to the prescribed number of clusters (K) is documented in Supporting Information (figure S2). It is interesting to note that the ME region shows the strongest cluster strength for different K number of clusters. This highlights the very particular summer climate of this small region (in terms of temperature extremes) largely influenced by the Mediterranean Sea. It also demonstrates the advantage of using a clustering of extreme events as a geographical selection of 5 regions in France would probably result in a larger ME cluster, with more stations taken around the Mediterranean edge and further inland. All five regions have observed current record maximum values greater or equal to 42 °C, with the warmest being ME with 42.7 °C. We use the ALADIN model closest grid point to every station (see figure S3) to look at the changes in record-breaking temperatures occurring during the 21st century in the five regions in France.

Figure 1 Results from the spatial clustering algorithm applied to the observations. Open circles indicate lack of significance (silhouette coefficient < 0.5; see supporting information S2 for more details). Regions are numbered with regard to the cluster strength (average of the silhouette coefficient over significant points only), from the weakest to the strongest (1 to 5), as illustrated by the colors. For each cluster, the maximum value of observed current summer record maximum value across the stations is indicated.
Download figure:
Standard image High-resolution image3. Results
Figure 2 (top panel) shows the 21st century evolution of the total number of records broken in summer over France as simulated by ALADIN-SCEN. Compared to the first half of the 21st century the second half features a higher frequency of large amplitude record-breaking events and a robust emergence of the anthropogenic signal (Elguindi et al 2012, Bador et al 2016). It comprises three exceptional heatwaves in 2075, 2097 and 2099. The simulated heatwave in 2075 is characterized by a normalized number of records around 20, which means that 20 times more records are broken this summer than expected that far in a stationary climate time series assumed to be consistent with the summers of the first decades of observations. It is also associated with many new record maximum values, in particular in the EA and NO regions (figure 2, bottom panel). Despite the warming trend due to GHG concentration increase, many of the newly established record maximum values remain as such until 2100. This is particularly the case in NO and EA. For the SW, BR and ME regions, the record maximum values in 2100 are reached after year 2095 (see figure S3).
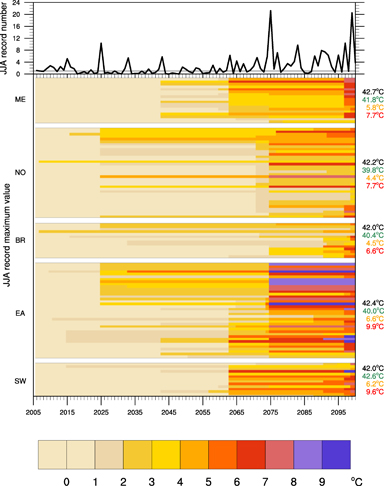
Figure 2 Top Panel: Yearly evolution of the normalized number of records broken in summer over France in ALADIN-SCEN (the domain is shown in figure 3(c)). Bottom Panel: Yearly evolution of the difference between summer record maximum values and the 2005 value in ALADIN-SCEN. The closest model grid point to every observed station is selected (see figure S3). Stations are grouped in five regions (left Y-axis), given by the clustering algorithm (see figure 1). For each region, record time series are ordered by increasing latitudes (from bottom to top). Numbers (right Y-axis) give the regional maximum observed (black) and simulated (green; ALADIN-HIST) summer record maximum values in 2005 (°C), and their ALADIN-SCEN simulated changes by 2100 for the regional mean (orange) and maximum (red).
Download figure:
Standard image High-resolution imageWe now focus on the 2075 summer heatwave and ask how exceptional this event is in the context of its contemporaneous climate. To get some insight on the extreme character of the simulated 2075 event, we compare it with the observed 2003 summer heatwave. Figure 3 shows the changes in record maximum values between 2075 and 2074, and 2003 and 2002, for the simulated and observed heatwaves, respectively. Note that only warm years can change the record maximum values as by definition this metric includes the memory of all previous summers up to the considered year. Both observed 2002 and simulated 2074 summers are within the range of their contemporaneous climate and cause almost no change in record maximum value in France (figure S1 and figure 2, respectively). Hence, looking at the difference to the previous year 2002 (2074) does not artificially influence the magnitude of the 2003 (2075) heatwave in terms of broken records. The spatial extent of the 2075 heatwave is slightly smaller than that of the 2003 heatwave, whereas its amplitude is larger, in particular in North-eastern France (EA and, to a lesser extent, NO). The 2075 heatwave features new record maximum values that exceed previous records by 1 °C–6 °C whereas the range for the 2003 heatwave is between 1° and 4 °C.
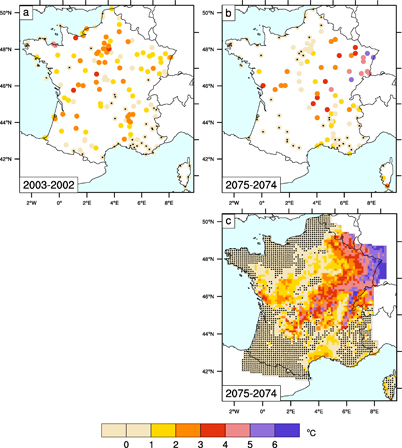
Figure 3 Changes in summer record maximum values (°C) between two particular years (after/before a mega-heatwave) in (a) the observations (2003/2002) and (b) and (c) the ALADIN-SCEN simulation (2075/2074). The closest model grid point to each station is selected on panel (b) and all grid points in France are considered on panel (c). Black dots show stations or grid points with no change in the summer record maximum value. Some coastal stations are not associated with a model grid point as they correspond to a sea and not a land grid point.
Download figure:
Standard image High-resolution imageWe now examine in more detail the precise timing the 2075 heatwave. The heatwave duration is defined using the heatwave index as in Schoetter et al (2015), which is estimated in the driving CNRM-CM5 simulation over Europe (35°N–60°N; 10°W–30°E). Based on this index a heatwave is detected if at least 30% of the domain is affected for at least 3 consecutive days by Tmax exceeding the 98th percentile of the Tmax distribution with respect to a base period (May to October months from 1979 to 2008). Figures 4(a) and (b) shows the evolution of Tmax anomalies (relative to late 21st century climate) averaged over Europe and France during summer 2075 in the CNRM-CM5 simulation (thick red line). The heatwave onset begins after 35 days (day 187 of the year) and becomes a real heatwave after 40 days (day 192; red shading, figure 4(a)). In France this heatwave is composed of two peaks (figure 4(b)).
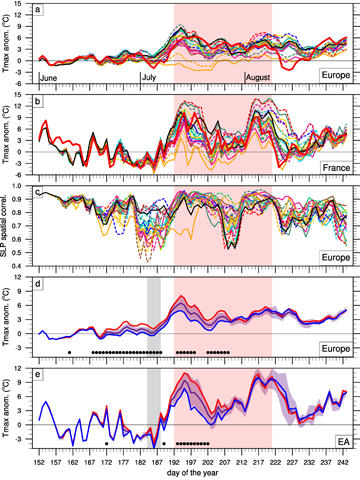
Figure 4 (a) and (b) Daily evolution of Tmax (°C) anomalies relative to the 2061–2090 climatology and averaged over (a) Europe and (b) France during summer 2075 for the 20-member ALADIN-LE ensemble (thin colored lines; black corresponds to ALADIN-SCEN) and CNRM-CM5 simulation (thick red lines). (c) Daily evolution of the spatial correlation between the sea level pressure fields of the ALADIN-LE simulations and the CNRM-CM5 simulation (interpolated on the ALADIN grid). (d) and (e) Daily evolution of Tmax anomalies relative to the 2061–2090 climatology and averaged over (d) Europe and (e) EA region in France for the mean and interquartile range (purple line and shading) of the reduced 19-member ALADIN-LE ensemble (the member with no heatwave -solid orange line in (a,b,c)- is not considered here). Red and blue lines refer to the mean of two 5-member subsets presenting the lowest (driest) and highest (most humid) mean values in soil moisture content anomalies during a 5-day period prior to the heatwave onset (days 184–188; grey shading), respectively. Black dots indicate the days when the mean Tmax anomalies in both subsets are significantly different (p-value<0.05; T-test). The red shading indicates the heatwave duration (as defined in Schoetter et al 2015) in the CNRM-CM5 simulation (days 192–221) over Europe.
Download figure:
Standard image High-resolution imageThen we use the ALADIN-LE simulations (thin colored lines, figures 4(a) and (b)) to describe the 2075 heatwave and investigate the associated mechanisms. Over Europe, the ensemble spread (i.e. dispersion between the members) is small for the first 20 days and mean Tmax anomalies are small (less than 2 °C; figure 4(a)). The ALADIN-LE spread in mean Tmax anomalies varies with time and is characterized by 10-to-20 day periods with large internal variability, in particular over France during the first peak of the heatwave (figure 4(b)). The first 15–20 days of the heatwave are characterized by a large spread that increases and then slowly saturates with time over Europe and France. One member completely fails to reproduce the heatwave (it actually simulates a cooling during the first 15 days of the event) before merging back with the rest of the ensemble 10 days before the end of the heatwave (solid orange line, figure 4(a)). Despite the strong constraint due to lateral and sea surface boundary conditions, the ALADIN model thus develops a high level of internal variability within the regional domain (Sanchez-Gomez and Somot 2016). This internal variability has a stronger influence than the large-scale and sea surface forcing from the CNRM-CM5 driving model in one case out of 20. The other 19 members all simulate a heatwave albeit with very different amplitudes for both Europe and France. The Tmax anomaly difference between the two extreme members (among the 19 reproducing the heatwave) can reach 2.5 °C–8.3 °C at any time during the heatwave when averaged over Europe (figure 4(a)). The temperature spread can even reach higher values (13.3 °C) when averaged over France (figure 4(b)).
The atmospheric circulation forcing the 2075 heatwave is typical for western European heatwaves (Cassou et al 2005). The positive temperature anomalies maintained by a blocking anticyclone over Europe are initially due to the advection of hot air by a strong south-westerly flow (see figure S5). The 19 members of ALADIN-LE that simulate the heatwave have a large-scale atmospheric pattern (based on daily sea level pressure—SLP; figure 4(c)) that is similar to the CNRM-CM5 driving model as soon as the heatwave begins. Indeed, the spatial pattern correlations between the 19 members of ALADIN-LE and CNRM-CM5 daily SLP range from 0.84 to 0.94 in average during the first 5 days of the heatwave (days 192–196; figure 4(c)). The similarity of the large-scale atmospheric circulation pattern among the 19 members suggests that the atmospheric circulation is likely not the main driver of the different heatwave intensity within the ALADIN-LE. The remaining member (which simulates a cooling; solid orange line) has a weaker correlation of 0.66 in average during the first 5 days of the heatwave (days 192–196; figure 4(c)). This suggests that this particular member does not simulate a heatwave because it does not follow the large-scale pattern of the driving CNRM-CM5 model. Interestingly, the SLP pattern correlations between ALADIN-LE and CNRM-CM5 exhibit a much larger spread just before the onset of the heatwave (days 180–192). All 20 ALADIN-LE member correlations are scattered throughout the 0.43–0.92 range. This is a nice illustration of the intermittent character of the internal variability generated by regional climate models (Giorgi and Bi 2000, Alexandru et al 2007, Lucas-Picher et al 2008, Sanchez-Gomez and Somot 2016).
We take advantage of the large temperature spread of the ALADIN-LE ensemble during the heatwave to identify the mechanisms that can lead to an amplification of its temperatures. Previous studies (e.g. Black et al 2004, Fischer et al 2007, Garcia-Herrera et al 2010, Stéfanon et al 2012, Miralles et al 2014) focused on present-day climate have documented the importance of pre-existing soil moisture conditions on the amplification of extreme temperature during heatwaves. Here we follow the same track to investigate if these mechanisms can also enhance the amplitude of an extreme heatwave in a mean climate that is much warmer and drier than the present-day climate. For this additional analysis, the member without heatwave is removed from the ALADIN-LE ensemble then reduced to a 19-member ensemble.
We isolate two groups among the members using a composite analysis based on the mean soil moisture anomaly (relative to late 21st century climate) before the onset of the heatwave. Note that we use the total soil moisture integrated over a depth that varies spatially but typically corresponds to values of about 1.5m in France. The first group includes the five members with the largest positive soil moisture anomaly averaged over the domain and over a 5-day period just before the heatwave onset (days 184–188), whereas the second one includes the five with the largest negative values. We apply this analysis to both Europe and the most impacted region of France (EA; figures 4(d) and (e)). The two groups are significantly different in terms of the mean Europe and EA Tmax anomalies during the first days of the heatwave, whereas they become indistinguishable later on. The temperature difference between the two groups varies between 1.9 and 6.1 °C throughout the first 10 days of the heatwave in average over both geographical domains. This suggests that pre-existing soil moisture anomalies can strongly modulate the heatwave intensity.
Soil moisture is an important climatic control on the partitioning between sensible and latent heat flux, thereby modulating air temperature. We now detail the mechanism leading to the heatwave temperature amplification and the regional spatial contrast over France. We focus on the first 10 days of the heatwave (days 192–201) when there is a significant relation between the temperature spread and the pre-existing soil moisture conditions (figures 4(d) and (e)). First, we investigate the relationship between the mean anomalies in soil moisture before the heatwave and the mean anomalies in evapotranspiration during the first days of the heatwave in the ALADIN-LE 19-member ensemble (figure 5, left column). In all regions, evapotranspiration increases with soil moisture content as indicated by significant inter-member correlations (p-values < 0.01 for all regions expect NO with p-values = 0.015). To confirm a control of Tmax by the pre-existing soil conditions we now quantify the relationship between evapotranspiration and Tmax during the first days of the heatwave (figure 5, middle column). Tmax anomalies are mainly linked to evapotranspiration anomalies in SW and ME (inter-member correlation of −0.90 and −0.86, respectively, with p-values < 0.01). EA and NO regions also show a strong relationship with a correlation of −0.79 and −0.64 (p-values < 0.01) whereas no significant relationship is found for BR (correlation of −0.41). Mean Tmax anomalies are larger in EA and NO than in ME and SW by roughly 3 °C. The origin of the heatwave pattern geographical distribution could be traced back to the spatial distribution of total soil moisture and a higher sensitivity of evapotranspiration to soil moisture changes when the soil moisture content is already low (Planton et al 2005). EA and NO are the two regions the most impacted by the heatwave and these two regions exhibit drier conditions than the other regions before the heatwave (days 184–188; figure 5, right column).

Figure 5 Scatter plots of the (relative, %; except for Tmax, °C) mean anomalies in (a,d,g,j,m) evapotranspiration and soil moisture, (b,e,h,k,n) Tmax and evapotranspiration, in the reduced 19-member ALADIN-LE ensemble (black corresponds to ALADIN-SCEN). The regression line, value of the Spearman's rank correlation (r) and associated p-value are indicated on each panel. Mean anomalies in soil moisture (mm) in the reduced 19-member ALADIN-LE ensemble (vertical lines), compared to the probability density function of the climatological anomalies. All the anomalies are computed with regard to the 2061–2090 climatology. Tmax and evapotranspiration anomalies are averaged during the first ten days of the heatwave (days 192–201), whereas soil moisture anomalies are averaged just before the heatwave to consider pre-existing conditions (days 184–188). All the anomalies are averaged across all the closest model grid points to each station (see figure S3) for each region in France (one per line as indicated; see figure 1).
Download figure:
Standard image High-resolution image
The results of the ALADIN-LE simulations demonstrate that very severe heatwaves with respect to their contemporaneous mean climate can occur in a much warmer and drier French regional climate such as projected under the RCP8.5 scenario. They also suggest that mechanisms similar as those operating during present-day heatwave amplification could still be important. The future occurrence of such mega-heatwaves is expected to lead to a large increase in Tmax that human and ecosystems will have to cope with. Here we quantify the record maximum values that could possibly be reached in France at the end of the 21st century. We use a simple approach based on an anomaly framework where we combine observed current record maximum values with future changes as simulated by the ALADIN-SCEN simulation. By the end of the observed period, ALADIN slightly underestimates the observed record maximum values (see the right side of figure 2 and see also table 1). This might not be associated with a cold bias. Indeed the probability for a heatwave as intense as observed in 2003 is very low under present-day conditions (Schär et al 2004, Trigo et al 2005). Schoetter et al (2015) and Russo et al (2014) show that none of the CMIP5 models reproduce an event of such an extraordinary nature over the historical period. By 2100, ALADIN-SCEN indicates mean regional changes ranging from 4.4 °C–6.6 °C (averaged over NO and EA, respectively). Regional maximum increases show that individual locations can experience even greater changes: 6.6 °C, 7.7 °C, 7.7 °C, 9.6 °C and 9.9 °C for BR, NO, ME, SW and EA, respectively.
Table 1. Regional observed (SQR station dataset) and simulated (ALADIN-HIST simulation) current summer record maximum values (°C) and their simulated changes and uncertainties given by the ALADIN and CMIP5 simulations.
| summer record maximum value (°C) | ||||||
|---|---|---|---|---|---|---|
| in 2005 | changes in 2100 compared to 2005 | |||||
| SQR observations | ALADIN-HIST simulations | ALADIN-SCEN simulation | ALADIN-SCEN + ALADIN-LE simulation | CMIP5 ensemble median [inter-quartile] | ||
| regional max | regional max | regional mean | regional max | regional max | France max | |
| ME | 42.7 | 41.8 | 5.8 | 7.7 | 7.7 | |
| NO | 42.2 | 39.8 | 4.4 | 7.7 | 12.2 | |
| BR | 42.0 | 40.4 | 4.5 | 6.6 | 6.6 | 11.8 [9.0, 13.2] |
| EA | 42.4 | 40.0 | 6.6 | 9.9 | 12.9 | |
| SW | 42.0 | 42.6 | 6.2 | 9.6 | 9.6 | |
A complete assessment of the different sources of uncertainty and their contribution to the record maximum values in France is beyond the scope of our study as it would require a very large ensemble of simulations with many RCMs (and many members per model), many driving GCMs and different GHG scenarios. However, the ALADIN-LE ensemble can be used to give a qualitative estimate of the influence of internal variability (within the RCM domain) on the 2075 heatwave and associated record maximum values in 2100 (table 1). For instance, regional maximum changes 4.5 °C and 3 °C higher than simulated by ALADIN-SCEN are found in NO and EA (respectively), the two regions the most impacted by the heatwave. Finally, the combined use of ALADIN-SCEN and ALADIN-LE simulations shows that the model can simulate a change in record maximum value up to 12.9 °C in France (table 1).
It is possible to give an estimate of the model uncertainties around these projections using the CMIP5 multi-model ensemble. We use the CMIP5 ensemble (29 models) to benefit from a larger range of models compared to the EURO-CORDEX ensemble, which is only composed of a small number of driving GCMs and driven RCMs. We focus on the record maximum value in France as the CMIP5 models have a too coarse spatial resolution to attribute meaningful record values at regional and sub-regional scales. The CMIP5 median and inter-quartile range of record maximum values in France are 11.8 °C and [9 °C–13.2 °C], respectively. Hence, the 12.9 °C increase in record maximum value projected by ALADIN appears to be within the 3rd quartile of the CMIP5 ensemble. The ALADIN model thus simulates regional changes comparable to the estimates of the global climate models.
4. Summary and discussion
By applying a spatial clustering methodology to temperature observations, we have identified 5 homogeneous regions in France with regard to summer temperature extremes. Based on a future simulation of the ALADIN RCM under the RCP8.5 scenario, we have shown that a summer heatwave at least as severe relative to its contemporaneous climate as the observed 2003 heatwave could occur in France in the late 21st century. This simulated heatwave has a distinct spatial pattern with the largest anomalies occurring in Northern and Eastern France.
We have then used a large ensemble (20 members) of 3-month ALADIN simulations to investigate the physical processes involved in shaping the heatwave intensity. While all ensemble members are constrained to follow the same large-scale circulation pattern driving the heatwave, the heatwave intensity and associated temperature anomalies and records differ by a large amount across the ensemble. In one case, the internal variability within the RCM domain is even able to reverse the sign of the temperature anomaly. By initializing the ensemble one month before the heatwave onset, we generate different land surface conditions across the different members simulating the heatwave. Thanks to a composite analysis based on pre-existing soil moisture content, we have then investigated the influence of soil moisture conditions and related feedbacks on the heatwave magnitude and spatial pattern. In agreement with similar studies of observed present-day heatwaves, the results show that the regions with the driest conditions before the heatwave experience large temperature anomalies and a higher number of record-breaking temperatures during the heatwave. The results also show that regional heatwave temperature anomalies can vary by several degrees due to different soil water conditions prior to the heatwave.
Finally, we have provided a qualitative estimate of the summer record maximum value that could be reached in 2100 under RCP8.5. Based on an anomaly framework, we have combined observed current record maximum value (above 42°C) with 21st century changes simulated with ALADIN (from 6°C to almost 13°C). This ALADIN simulated change appears to belong to the inter-quartile range of the CMIP5 ensemble that indicates a median value of 11.8 °C. This last estimate can be compared to changes in mean summer temperature in France that have been estimated to be ∼6 °C from an ensemble of CMIP5 models under RCP8.5 (Terray and Boé 2013). In France, the change in summer maxima of daily maximum temperatures is thus expected to be twice as large as the mean summer change.
Results indicate that record maximum value in France could easily exceed 50 °C by the end of the 21st century. These extreme temperatures are experienced in desert regions, which question how realistic such projected extreme temperatures could be in France. Apart from the potential limitations associated with both GCM and RCM physics, the vegetation could be further investigated as it also controls the heatwave magnitude (Stéfanon et al 2012) and will experience changes with global warming. Besides, the temperature amplification by land-atmosphere interactions may not be representative of all types of heatwave in mid-latitude locations and all seasons. Here we selected summer heatwaves having a strong influence on daily maximum temperatures but heatwaves can also strongly impact night-time temperatures with serious consequences for human heath.
Acknowledgments
We thank the anonymous reviewers for their helpful and constructive comments, which have improved this manuscript. MB is supported by the Australian Research Council (ARC) Discovery Grant DP160103439 and Centre of Excellence for Climate Systems Science Grant CE110001028. This work is also supported by EDF and by the French National Research Agency and its program 'Investissement d'avenir' under the grant ANR-11-RSNR-0021. We acknowledge the modeling groups for access to the CMIP5 models and data. The analyses and graphics have been done using the NCAR Command Language (NCL 2013) and the R package 'ClusterMax' available on Philippe Naveau personal web page. We also thank Robert Schoetter for the heatwave index calculation.