

Abstract
Heatwaves with large impacts have increased in the recent past and will continue to increase under future warming. However, the implication for population exposure to severe heatwaves remains unexplored. Here, we characterize maximum potential human exposure (without passive/active reduction measures) to severe heatwaves in India. We show that if the global mean temperature is limited to 2.0 °C above pre-industrial conditions, the frequency of severe heatwaves will rise by 30 times the current climate by the end-21st century. In contrast, the frequency is projected to be about 2.5 times more (than the low-warming scenario of 2 °C) under conditions expected if the RCP8.5 'business-as-usual' emissions scenario is followed. Under the 2.0 °C low-warming target, population exposure to severe heatwaves is projected to increase by about 15 and 92 times the current level by the mid and end-21st century respectively. Strategies to reduce population growth in India during the 21st century may provide only limited mitigation of heatwave exposure mostly late in the century. Limiting global temperatures to 1.5 °C above preindustrial would reduce the exposure by half relative to RCP8.5 by the mid-21st century. If global temperatures are to exceed 1.5 °C then substantial measures will be required to offset the large increase in exposure to severe heatwaves in India.
Export citation and abstract BibTeX RIS

Original content from this work may be used under the terms of the Creative Commons Attribution 3.0 licence.
Any further distribution of this work must maintain attribution to the author(s) and the title of the work, journal citation and DOI.
1. Introduction
Many parts of the world have witnessed an increased number of heatwaves in recent years (Rahmstorf and Coumou 2011, Sun et al 2014, Christidis et al 2015), including major global urban areas, where most of the world's human population now resides (Mishra et al 2015, Matthews et al 2017), and in India (Dash and Mamgain 2011, Rohini et al 2016, Panda et al 2017). In India, heatwaves during the pre-monsoon season (March−May) cover some area of the country nearly every year, cause high mortality, and affect a large population (Patz et al 2005, McMichael et al 2006, Hallegatte et al 2007, Dunne et al 2013, Pai et al 2013, Smith et al 2014). For instance, in 1998 one heatwave in India covered a large part of the country (Pai et al 2013). During both 1998 and 2015, parts of India experienced heatwaves that resulted in more than 2000 deaths each (EMDAT: www.emdat.be), and these heatwaves ranked among the most deadly events globally. Anthropogenic emissions have likely increased (Easterling et al 2000, Meehl and Tebaldi 2004, Schär et al 2004, Collins and Knutti 2013, Wehner et al 2016) the probability of current heatwaves, and under the projected future climate warming, the frequency of severe heatwaves is likely to increase further (Meehl and Tebaldi 2004, Hayhoe et al 2010, Lau and Nath 2014, Jones et al 2015, Schär 2016). However, neither the future heatwave hazard over India nor its potential effect on risk to the national human population have yet been quantified for the 1.5 °C and 2.0 °C global temperature limits that feature in current United Nations Framework Convention on Climate discussions (Schellnhuber et al 2016, Schleussner et al 2016, Horowitz 2016).
Here we report past and projected future changes in the behaviour of heatwaves across India based on gridded observed data of maximum air temperature (Tmax), and on simulations from global climate models participating in the Coupled Model Intercomparison Project Phase 5 (CMIP5; Taylor et al 2011). Additionally, we use data from the Large Ensemble Project (LENS; Kay et al 2014) of the Community Earth System Model (CESM; Hurrell et al 2013) for representative concentration pathway 8.5 (RCP8.5) and the two low-warming scenarios (1.5 °C and 2.0 °C) to estimate the key characteristics like frequency, magnitude, and duration of severe heatwaves. We use the recently developed method of Russo et al (2015) to identify heatwaves, which has an advantage of providing a spatially and temporally comparable index that considers both magnitude and duration of anomalously high temperature days. Based on this we assess past and current heatwave characteristics including how the properties differ from what they might have been in the absence of historical human interference in the climate system. Second, we estimate changes in projected heatwave properties and in projected maximum population exposure to heatwave days (MPEHWd) under the low warming scenarios corresponding to 1.5 °C and 2.0 °C rise in global mean temperature, providing an assessment for adaptation and mitigation needs in order to avoid detrimental impacts of increased frequency of heatwaves in India.
2. Methods
We use observed daily Tmax data for the period of 1951−2015 from the India Meteorological Department (IMD). The gridded dataset is available at 0.5° spatial resolution and was developed using Shepard's distance weighted interpolation (Srivastava et al 2009) on 395 observational stations located across India. The dataset has been widely used for heatwave related studies (Ratnam et al 2016, Rohini et al 2016).
We obtained daily Tmax data for 27 CMIP5 climate models from Earth System Grid Federation (ESGF, https://esgf.llnl.gov/) for historical and projected RCP8.5 future climates (online supplementary table S1, available at stacks.iop.org/ERL/12/124012/mmedia). However, as CMIP5 is based on small number of realizations (Taylor et al 2011) (here we used r1i1p1 realization), it is almost impossible to separate the model error and the internal climate variability (Kay et al 2014). The CMIP5 data are available for four RCPs, which consider population size, economic activity, life style, energy use, land use patterns, technology, and climate policy for making projections describing different pathways of greenhouse gas concentrations (IPCC 2014). We use the RCP8.5 scenario (Taylor et al 2011) to study the changes in heat waves in India under the projected future climate from the CMIP5 models (CMIP5-RCP8.5). The RCP8.5 is selected as recent emissions have most closely matched it (Sanford et al 2014). Moreover, the RCP8.5 provides us the highest-warming case of available business-as-usual scenarios and thus can provide information on the implications on heat waves in India for a broader range of temperature rises.
In order to assess the climate change projections in the emphasis of internal climate variability, we used simulations from CESM that are available for the four RCPs (Kay et al 2014). Similar to the CMIP5 data, we used simulations from CESM for the RCP8.5 (CESM-RCP8.5) for our analysis. Additionally, we used CESM simulations that also provide data for the two low-warming scenarios of 1.5 °C and 2.0 °C (Mitchell et al 2016, Sanderson et al 2017). Thus, daily Tmax data at 1° spatial resolution of fully-coupled CESM version-1 from 11 CESM Large Ensemble (CESM-LENS) members with atmospheric component CAM5.2 was used for the period 1920−2100. Each of these 11 members correspond to the same radiative forcing conditions as in CMIP5-GCMs with 20th century or Historical scenarios spanning till 2005 and RCP8.5 scenarios extending post 2005. In addition, we used daily Tmax data with low-warming scenario from CESM (Sanderson et al 2017) corresponding to 1.5 °C (CESM-1.5C) and 2 °C (CESM-2C) rise in global mean temperature to analyse the projected climate in the perspective of changes in heatwave characteristics and exposure in India with rise in global warming.
Moreover, to evaluate the impacts of anthropogenic warming on the frequency of heatwaves based on CMIP5, we use daily Tmax data from a subset of seven CMIP5 models with data available for the Historical Natural (HistNat) and Historical (Hist) scenarios (table S2). The HistNat scenario includes variations in natural forcings over the period of the past several decades while the Hist scenario includes variations in both natural as well as anthropogenic forcings over the same period. Differences in heatwave characteristics between the HistNat and Hist scenarios can be attributed to the anthropogenic forcing.
2.1. Estimation of temperature indices and heat waves
We estimate characteristics of heatwaves using the method of Russo et al (2015). The Russo et al (2015) method considers a variable Tmax threshold compared to the absolute values of Tmax used by the IMD, and it considers both magnitude and duration of heat waves, which enable us to quantify characteristics of heatwaves more relevant to their impacts. The heat wave magnitude index daily (HWMId) provides a basis to understand severity (e.g. magnitude) and duration of heat waves in any given region. The HWMId is based on the maximum magnitude of heatwaves in each year, where a heatwave is defined as a period with Tmax above a daily threshold for three or more consecutive days. The daily Tmax threshold for each calendar day is defined as the 90th percentile of Tmax centered on a 31 day window, estimated by considering all daily Tmax data of the 15 days before and after for a particular day over a given reference period (e.g. 1971−2000). For each year, the last and first 15 days of the previous and next years, respectively, were considered to avoid inhomogeneity in estimation of heatwave magnitude. However, in future, methods based on bootstrapping (Zhang et al 2005) can also be applied to deal with the inhomogeneity in heatwave estimations. Following a more conventional approach, we considered a fixed reference period and did not apply any correction, which may lead to some exaggeration in the projected estimates as reported in Sippel et al (2015). The overall magnitude of a heatwave event is estimated as the sum of the daily magnitudes within a heatwave, where the daily magnitude (Md) is given by:
where Td is the maximum daily temperature on day d of the heatwave, T75p and T25p are respectively the 75th and 25th percentile values of the annual Tmax time series, estimated over the reference period (1971−2000). By using the site-specific threshold information, this (normalized) formulation has the advantage that the estimated Md can be compared across the locations with different climate conditions. Notably the denominator of daily heatwave magnitude (Md) represents the inter-quartile range (IQR) of the N reference year annual Tmax values. So that if the Md value on a day d is 3, then it means that the Tmax anomaly on that day with respect to T25p is three times the IQR. More details on the estimation of frequency, magnitude, and duration of heatwaves can be obtained from Russo et al (2015). Additionally, 3 day annual maximum temperature (3 day AMT) estimated from the daily Tmax data was considered as an alternative heatwave measure (Meehl and Tebaldi 2004).
We estimate observed heatwaves using Tmax data for each 1° grid in India for the period of 1951−2015. Similarly, heatwaves are also estimated for the data obtained from the CMIP5 and CESM simulations at the same resolution. Since CMIP5 models have different native resolutions, their output is first gridded to the common grid at 1° spatial resolution using the bilinear interpolation scheme. For each CMIP5 model, the period of 1971−2000 is considered as the reference period to estimate heat waves in India under the Hist and HistNat scenarios (table S2).
We evaluated simulations from CMIP5 models and CESM runs against the observed heatwave frequency and 3 day AMT (supplemental section S1). Our analysis showed that both CMIP5 and CESM runs underestimate the observed frequency of heatwaves and trend in the 3 day AMT (figure S1). The Hist simulations more closely match the observed frequency than do the HistNat simulations; because no bias correction has been applied this suggests, but does not confirm, the existence of an anthropogenic contribution in increased heatwave frequency in India (figure S1). We find that the CESM-LENS ensemble (also run under Hist conditions) captures observed patterns of frequency of heatwaves better than CMIP5 models over India for the period of 1980−2005 (figures S1(d)−(e)).
The global dataset of gridded population scenarios, available at 0.5°, is from the Center of Global Environmental Research (www.cger.nies.go.jp/gcp/population-and-gdp.html). The dataset was developed for the three Shared Socioeconomic Pathways (Moss et al 2010, van Vuuren and Carter 2014, O'Neill et al 2017) (SSPs: SSP1, SSP2, and SSP3). The data is aggregated to the 1° resolution of the Tmax data. We estimate the MPEHWd by multiplying the product of frequency and duration (in days) of severe (above magnitude 16) heat waves with the population data from each SSPs. To estimate projected MPEHWd for all-India, MPEHWd values from all the grid cells are aggregated for each CMIP5 model and each CESM-LENS members from 20th century scenario coupled with RCP8.5, and low warming (1.5 °C: CESM-1.5C and 2.0 °C: CESM-2C) scenarios.

Figure 1. Observed heatwaves in India during the period of 1951−2015. (a) Heatwave magnitude for the observed heat waves during the period of 1951−2015, as measured by the method of Russo et al (2015) using all-India averaged daily maximum temperature. Colors in (a) show heat wave duration (in days). (b) heat wave magnitude for the 1998 heat wave, which was one of the most severe heat waves in the observed record of 1951−2015 (table S1), and (c) heat wave magnitude for the year 2015.
Download figure:
Standard image High-resolution image
Figure 2. The frequency of heat waves in India during mid-period, end-period, and low warming (1.5 °C and 2 °C) scenarios. (a) Multi-model ensemble mean of difference in F-HW with magnitude more than 16 for mid period (2021−2050) from the reference period (1971−2000) based on 27 CMIP5-GCM's Hist and RCP8.5 scenario, (b) same as in (a) but for end period (2071−2100), (c) same as in (a) but based on CESM-RCP8.5 scenario data. (d) Same as in (c) but for end period (2071−2100), (e) same as in (a) but based on CESM-1.5 C, (f) Same as in (e) but for end period (2071−2100). (f) Same as in (a) but based on CESM-2C, (g) same as in (f) but for end-century (2071−2100). (i) Error-bar plot for multimodel ensemble mean of F-HW with magnitude more than 16 for the reference period (1971−2000), mid-period (2021−2050), and end-period (2071−2100) based on 27 CMIP5-RCP8.5, and 11 ensemble members from CESM-RCP8.5, CESM-1.5C and CESM-2.0C. (j) Same as in (i) but for multimodel ensemble mean of duration of heatwave having magnitude greater than 16. The error bars in (i) and (j) show intermodal variability during the current, mid and end periods.
Download figure:
Standard image High-resolution image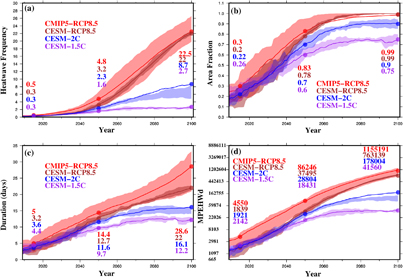
Figure 3. Projected population exposed to severe heatwaves in India. (a) All-India averaged multimodel ensemble mean of frequency of severe heatwaves with magnitude greater than 16 was estimated based on 27 CMIP5-GCMs (red, inter-quartile range (shaded)), 11 members of CESM-RCP8.5 (brown), low warming 2.0 °C (blue) and 1.5 °C (purple). (b) Multimodel ensemble mean of all-India averaged areal extent of severe heatwaves. (c) Multimodel ensemble mean of all-India averaged duration (days) of severe heatwaves. (d) Multimodel ensemble mean projected MPEHWd based on 27 CMIP5-RCP8.5 (red), 11 members of CESM-RCP8.5 (brown) for each year for SSP3 population projections. Low warming 1.5 °C (purple, CESM-1.5C), and 2 °C (blue, CESM-2.0C) show multimodel ensemble MPEHWd based on 11 members of CESM-RCP8.5 for low warming scenarios used along with SSP1 scenarios. In (a), (c) and (d) the line representing the multimodel ensemble mean for CESM-2.0 °C falls outside of its interquartile range as two ensemble members project much larger warming than the other nine members (see supplemental figure S4). Circles in (a)−(d) represent the corresponding values for the current (1986−2015), mid-century (2021−2050), and end-century (2071−2100) such that the values are marked at the end year of each of the three (current, mid, and end) periods. Please note that the y-axis in (d) is plotted using natural logarithm of the original values (original values are marked in the vertical axis and inside the plot) to show the variability in the low warming scenarios at the end of the 21st century.
Download figure:
Standard image High-resolution image
Figure 4. Role of climate and population change on MPEHWd. (a) MPEHWd estimated using CMIP5-RCP8.5, CESM-RCP8.5, and the low warming scenarios (CESM-1.5C and CESM-2.0C) with respect to the population range spanned by the SSP3 scenario. The circles show MPEHWd corresponding to the mean population for the end (2071−2100) of the 21st century. The line representing the multimodel ensemble mean for CESM-2.0 °C falls outside of its interquartile range as two ensemble members project much larger warming than the other nine members (see figure S5). (b) Population exposure to severe heatwaves in the mid (2021−2050) 21st century period for the CMIP5-RCP8.5, CESM-RCP8.5, and the low warming scenarios (CESM-1.5C and CESM-2.0C) under the SSP1 and SSP3 scenarios, respectively. (c) Same as (b) but for the end (2071−2100) of the 21st century. Error bars in (b) and (c) show one standard deviation values for the ensemble members of CESM-LENS. Please note that the y-axis in (a) is plotted using natural logarithm of the original values (original values are marked in the vertical axis and inside the plot) to show the variability in the low warming scenarios at the end of the 21st century.
Download figure:
Standard image High-resolution image
3. Results and discussion
3.1. Observed heatwaves in India during the period of 1951–2015
We start by characterising recent heatwaves as monitored through gridded daily station measurements of maximum daily temperature from the IMD (www.imd.gov.in), see section 2) during the 1951−2015 period, following the methodology described by Russo et al (2015) (see section 2), considering the heatwave with the highest magnitude in each year. Most heatwaves in India have occurred in the month of May, and nearly all of them have occurred between April and July (table S3). There has been a substantial increase in the frequency of heatwaves (F-HW) during the period of 1951−2015 (figure 1(a)). Based on the heatwave magnitude (an indicator of heatwave severity), the five most severe heatwaves out of the top ten heatwaves in the entire record (1951−2015) occurred after 1990. The top three heatwaves occurred in 1998, 1995, and 2012, with a magnitude of 17.92, 16.92, and 11.14, respectively (figure 1(a)). Since these heatwaves are estimated based on all-India average Tmax, the 2015 heatwave that had a remarkable impact does not feature in the top three events. The 1998 heatwave was a wide-spread event (figure 1(b)) while the heatwave during 2015 was mainly centered in the east-central region of India (figure 1(c)). In terms of heatwave mortality, the 2015 event ranked second (after 1998) indicating that localized heat waves can also be detrimental (Rohini et al 2016, Ratnam et al 2016, Pattanaik et al 2016). These trends and rankings are robust against use of the 3 day AMT, an alternative measure of heatwaves (Meehl and Tebaldi 2004) (figure S2). However, use of a temperature-based definition neglects other meteorological properties of heatwaves that may be important for heat stress among the human population. Heat stress measures based on temperature and humidity provide a relative measure of discomfort (Bishop-Williams et al 2015) that can be a better indicator than the indices based only on temperature. Sherwood and Huber (2010) reported that peak heat stress (estimated using wet-bulb temperature) above 35 °C for an extended period can cause hyperthermia in human and other mammals. The 2015 event was characterized by both high temperature and high humidity and caused substantial human mortality (Wehner et al 2016 Matthews et al 2017), which highlights the importance of humidity in heat stress estimation. Our analysis is limited to heatwaves based on Tmax as long-term gridded relative humidity observations are unavailable for India.
3.2. Projected changes in heatwaves in india
During the past few years, international climate policy has been framed in terms of avoidance of a specified global temperature level (Horowitz 2016, Marotzke et al 2017). A required action then is the determination of what an acceptable temperature limit might be, through assessment of associated risks; the two candidates in most discussions are 1.5 °C and 2.0 °C limits in rise in global warming. In order to assess potential heatwave related risks in India for these global temperature scenarios, we define a 'severe' heatwave as having a magnitude larger than 16 that being the mean magnitude of the top three heatwaves observed during the historical record (1995, 1998, and 2012).We use simulations (11 each) of future climate change from CESM run under scenarios which reach and maintain 1.5 °C (CESM-1.5C) and 2.0 °C (CESM-2C) by the end of the century. Heatwave characteristics are compared from these low warming scenarios against the CESM-RCP8.5 simulations as well as simulations from 27 CMIP5 models run under the RCP8.5 (CMIP5-RCP8.5) scenario of substantial sustained warming through the century.
We estimate the ensemble mean change in the frequency of severe heatwaves from the CMIP5 (RCP8.5) and CESM (RCP8.5, 1.5 °C, and 2.0 °C) datasets for the mid-(2021−2050) and end-century (2071−2100) considering the reference period of 1971–2000 (figure 2). Usage of 30 year intervals is a balance between having a reasonably large sample of heatwaves and having that sample be representative of a single climate era. Under the two low warming scenarios of 1.5 °C and 2.0 °C from the CESM, the frequency of severe heat waves in India are substantially less than that of RCP8.5 during the mid and end of 21st century (figures 2(e)−(i)). For instance, both the CMIP5 and CESM-RCP8.5 ensembles project an increase from 1971−2000 of 3−9 severe heatwaves (per 30 year period) by the mid-21st century under the RCP8.5 scenario (figure 2(a) and (c)). A larger increase (18−30 events in the 30 year period) in the frequency is projected by the end of the 21st century (figure 2(b) and (d)). Similarly, projected duration of severe heatwaves over India is far shorter in the low warming scenarios than that of the RCP8.5 (figure 2(j), figure S4). These results demonstrate substantial effects of climate change mitigation on the characteristics of severe heatwaves over India.
Based on the 27 CMIP5 models and CESM simulations, the frequency of severe heatwaves is estimated for a moving 30 year window starting from 1980 until the end of the 21st century (figure 3(a)). The CESM-2C low warming scenario projects about an eight-fold increase in the frequency of severe heatwaves by the mid-21st century (2021−2050) from the current (1986−2015) period, rising to about 30 times by the end of the century (figure 3(a) and table S6). The frequency of severe heatwaves is projected to increase more than 40 times (0.5 in the current and 22.5 in the end of 21st century) by the end-21st century under the RCP8.5 scenario of CMIP5 and CESM datasets (figure 3(a) and table S4, S5). Failure to limit the global mean temperature to 2.0 °C from the pre-industrial level will result in an increase of 2.5 times (8.7 in CESM-2C and 22 in CESM-RCP8.5) more severe heatwaves by the end of the century (table S5, S6, figure 3(a)). With the mitigation of global mean temperature rise, the area of India that experiences severe heat waves can be substantially reduced under the 1.5 °C or 2.0 °C scenarios in comparison to RCP8.5 (figure 3(b)). Under the 2.0 °C scenario (CESM-2C), the duration of severe heatwaves is projected to rise about 3 and 5 times of the current climate (3.6, 11.6, and 16.1 in CESM-2C in the current, mid, and end of 21st century, respectively) in the mid and end of the 21st century, which would otherwise be even longer (3.2 (current), 12.7 (mid), and 22 (end)) in CESM-RCP8.5 (figure 3(c), table S9, S10).
3.3. Projected population exposed to heatwaves
With severe heatwaves projected to occur at least once in every three years for all regions of the country under the future temperature limits, the question arises how badly an increased occurrence of severe heatwaves will potentially impact the human population of India, along with the question of the degree to which measures might need to be taken to alleviate such impacts.
In order to understand the potential for impacts, we estimate the projected MPEHWd using the frequency and duration of severe heatwaves (above magnitude 16) along with the population data from the SSPs (figure S3) (Moss et al 2010, O'Neill et al 2017). The measure assumes full exposure of the resident human population, with no shelter or other means of limiting direct exposure. We estimate projected MPEHWd for each 1° × 1° longitude–latitude grid cell by multiplying the product of heatwave frequency and mean duration with the mean population projected in the SSP datasets for each 30 year period.
To estimate projected MPEHWd for all of India, MPEHWd values from all the grid cells are aggregated for each year. All the three SSPs provide similar population projections until the mid-21st century (figure S3), which means that the spread in projected MPEHWd is largely driven by the frequency and duration of severe heatwaves rather than population (figure 3(d)), with duration being the dominant driver. We use SSP1 and SSP3 to estimate MPEHWd for the low warming (1.5 °C and 2.0 °C) and RCP8.5 scenarios, respectively. SSP3 assumes a fragmented world following varied regional social, political, and economic pathways. This may be considered difficult to reconcile with the international collaborative effort that would be required in order to keep the global temperature from exceeding 1.5 °C (Riahi et al 2017).
However, we consider it here on the grounds that what applies as a general rule globally does not necessarily need to apply for India itself (notwithstanding India's outsized contribution to world population), and that having a population scenario that spans a larger range will allow a more expanded study of the relation between heatwaves, national population, and MPEHWd.
Since frequency, duration, and areal coverage of severe heatwaves are projected to increase substantially under a warming climate (figures 3(a)−(c)), the projected maximum population exposed to heatwave days (MPEHWd) is also projected to increase significantly (figure 3(d)). Under the 2.0 °C low warming target, MPEHWd is projected to increase by 15 (1921 and 28804 in the current and mid periods under CESM-2C) and 92 (current: 1921 and end 178004) times of the current level (1986−2015), respectively by the mid and end of the 21st century (figure 3(d)). Keeping the global mean temperature to 1.5 °C by the end of the 21st century provides benefits in comparison to the 2.0 °C temperature target. For instance, under the 1.5 °C temperature target (CESM-1.5C), MPEHWd is projected to increase only 18 (current: 1921 and end: 41560) times the current level, instead of 92 times under the 2 °C scenario. Furthermore, benefits of climate change mitigation on heatwave exposure in India can be better understood when we compare exposure levels of the low warming targets against the RCP8.5. Both CMIP5-RCP8.5 and CESM-RCP8.5 datasets project an increase of 18−20 times in MPEHWd by the mid-21st century (from the current levels), which may increase more than 200 times by the end of the 21st century (figure 3(d), and table S12, S13). Moreover, we find that limiting global mean temperature will result in substantially larger benefits in terms of moderating MPEHWd in comparison to limits in growth of the Indian population (figure 4 and table S16, S17). Additionally, our results show that benefits of a feasible slowing of population growth as encapsulated by a comparison between SSP1 vs SSP3 population scenarios will have an effect that is restricted to the late 21st century (figures 4(b) and (c) and table S16, S17).
4. Conclusions
Heatwaves that occurred in 1998, 2012, and 2015 had notable impacts on human health and such events are projected to become more frequent in India. Our heatwave index is based on daily maximum air temperature, which does not consider the role of humidity in heatwave estimations, which is a limitation due to unavailability of the long-term gridded observations of relative humidity. Our results may differ from the projected population exposure in India due to heat stress, which includes the effect of humidity (Sherwood and Huber 2010, Wehner et al 2016, Im et al 2017, Mazdiyasni and AghaKouchak 2015) and provide a better measure of human discomfort. However, if global temperatures are to reach 2.0 °C above pre-industrial, these impacts can be expected to increase no matter the plausible population trajectory, unless measures are taken to reduce exposure. Such changes could involve modification of land cover, increased construction of shelter, increased penetration of passive and/or active cooling systems, modification of daily behavioural patterns, and/or development of emergency public services. India currently has a low penetration of air conditioning (McNeil and Letschert 2008); increased penetration could substantially reduce exposure for many people, though not for those who labour outdoors. While population increase generates a higher potential for exposure as time progresses, slowing the rate of global warming would provide vital time for further development of measures to reduce actual exposure. Ultimately, though, limiting global temperatures to 1.5 °C would dramatically reduce the requirement for those measures simply to maintain current levels of actual exposure, thus improving the chances of reducing actual exposure during this century.
Acknowledgments
We acknowledge the World Climate Research Programme's Working Group on Coupled Modelling, which is responsible for CMIP, and we thank the climate modeling groups (listed in table S1 of this paper) for producing and making available their model output. For CMIP the US Department of Energy's Program for Climate Model Diagnosis and Intercomparison provides coordinating support and led development of software infrastructure in partnership with the Global Organization for Earth System Science Portals. We also acknowledge data availability from CESM-LENS available at www.cesm.ucar.edu/projects/community-projects/LENS/. This work was supported by the BELMONT forum grant to the first author. DAS's was supported by the US Department of Energy, Office of Science, Office of Biological and Environmental Research, under contract number DE-AC02-05CH11231.