


Abstract
Urban material resource requirements are significant at the global level and these are expected to expand with future urban population growth. However, there are no global scale studies on the future material consumption of urban areas. This paper provides estimates of global urban domestic material consumption (DMC) in 2050 using three approaches based on: current gross statistics; a regression model; and a transition theoretic logistic model. All methods use UN urban population projections and assume a simple 'business-as-usual' scenario wherein historical aggregate trends in income and material flow continue into the future. A collation of data for 152 cities provided a year 2000 world average DMC/capita estimate, 12 tons/person/year (±22%), which we combined with UN population projections to produce a first-order estimation of urban DMC at 2050 of ~73 billion tons/year (±22%). Urban DMC/capita was found to be significantly correlated (R2 > 0.9) to urban GDP/capita and area per person through a power law relation used to obtain a second estimate of 106 billion tons (±33%) in 2050. The inelastic exponent of the power law indicates a global tendency for relative decoupling of direct urban material consumption with increasing income. These estimates are global and influenced by the current proportion of developed-world cities in the global population of cities (and in our sample data). A third method employed a logistic model of transitions in urban DMC/capita with regional resolution. This method estimated global urban DMC to rise from approximately 40 billion tons/year in 2010 to ~90 billion tons/year in 2050 (modelled range: 66–111 billion tons/year). DMC/capita across different regions was estimated to converge from a range of 5–27 tons/person/year in the year 2000 to around 8–17 tons/person/year in 2050. The urban population does not increase proportionally during this period and thus the global average DMC/capita increases from ~12 to ~14 tons/person/year, challenging resource decoupling targets.
Export citation and abstract BibTeX RIS

Original content from this work may be used under the terms of the Creative Commons Attribution 3.0 licence.
Any further distribution of this work must maintain attribution to the author(s) and the title of the work, journal citation and DOI.
1. Introduction
Humankind has become so urbanised that we may refer to the majority of the population now, and into the foreseeable future, as living in cities. A great deal of urban expansion in developing regions is expected over the next 50 years [1]. The collective resource needs and impacts of the world's cities (the 'urban metabolism') have become significant at the scale of earth systems [2]. As cities are the location of much of society's final consumption, major infrastructure and economic activity, it is valid to ask: 'what are the material resource requirements of cities in the future?'
National-level, globally consistent accounts of energy [3, 4] and materials flow [5–9] have been developed and standardised to monitor the status and change in resource use. There are far fewer global accounts of urban energy use [10] and none regarding urban materials. Material extraction, transport, transformation, use and disposal are intrinsically coupled with the energy and greenhouse gas emissions of concern to the international community [11]. Municipal waste material flows also continue to be a particular concern at the local government level [12, 13].
In this paper we present a first order attempt at quantifying direct urban material consumption now and for a 'baseline' future scenario wherein current aggregate trends about urban population, income and material flow indicators are modeled or assumed to continue. This scenario is simplistic and agnostic of policy interventions but it serves as a reference by which we may gauge the scale of the problem.
In the absence of global standardised urban data on material consumption, we have collated a representative sample of observed or derived data for 152 cities including population, domestic material consumption (DMC), income, built land area and latitude. From gross statistics of these data we obtain an estimate of current urban DMC/capita for global regions. Combined with long-run population projections, we calculate our first estimate of future urban DMC by these global regions.
DMC from national accounts has been shown to have a correlation with population, income and land area [14, 15]. Another estimate for urban DMC derives from multivariate regression relationships found in the collated urban data.
A third estimate was obtained from a top-down analysis that made use of national time-series DMC/capita data and mathematical modelling based on observations and theory of aggregate diffusion of technological change. Grübler [16] estimated an average rate of overall technical, economic and social change in the USA based on the aggregate diffusion of 117 processes and technologies, over 150 years. He found distinct phases of S-shaped growth transitions with an average period of ~60 years. The S-shaped logistic curve has been used to: describe diffusion of innovation and technology uptake [16–19]; fit historical data on materials in in-use stocks [20]; and model urban spatial development [21, 22].
We do not model diffusion of technology and the 'baseline' scenario does not assume any specific improvement in existing technology. Indeed, the main scenario narrative for developing countries is that their citizens adopt technologies such as internal combustion vehicles, sealed roads, distributed water and energy, up to, but not surpassing, the material affluence of developed-world citizens. We suggest that this sort of technology uptake, with infrastructure investment and affluence and lifestyle change, has a collective effect on urban material consumption that may be represented with a phenomenological model.
We propose the logistic function as a simple and appropriate mathematical model of relative change in urban DMC/capita. This approach involves strong assumptions and uncertainty but it allows for a dynamic version of DMC/capita and appears to be consistent with projections of urbanisation4 in major global regions.
The next section expands on our choice of indicator, its advantages and limitations and gives a brief summary of urban material flow accounts to position this work in the technical literature. The Data and methods section describes the analyses by which we produce global estimates of urban material consumption. Subsequently we present results from each analysis and discuss these with respect to other future projections and global material flow estimates. The supplementary information (SI) available at stacks.iop.org/ERL/13/065012/mmedia expands on the regression results, limits of the modelling, explicit and implicit assumptions and presents a sensitivity analysis.
2. Urban material flow accounts (MFA)
We use the DMC indicator from the standardised economy-wide MFA to permit comparison with national or global accounts, or urban MFA case studies. Urban MFA is one method within the broader literature on urban metabolism and urban environmental sustainability [23–25]. The scope of economy-wide MFA is summarised in figure 1 and this framework has been used in other urban MFA [26–33].
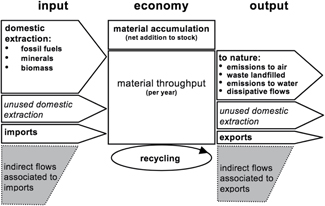
Figure 1. High-level scope of economy-wide material flow accounts from EUROSTAT [5] used to define the scope of our urban analysis with the DMC indicator.
Download figure:
Standard image High-resolution imageWe define urban DMC (or the intensive version per capita) based on EUROSTAT [5] as the annual quantity of raw materials extracted from a (metropolitan) territory (domestic extraction), plus all physical imports minus all physical exports. We interpret this to exclude the emissions to air, water and municipal solid waste flows of figure 1 consistent with other DMC analyses of major regions [14, 34].
DMC is an imperfect measure of material consumption in cities because they often import finished goods with the majority of material flows and transformations happening outside the city. DMC is also sometimes flawed as a national measure of material flow for economies that rely substantially on material extraction and trade (e.g. Chile, Australia, Canada). The overburden of resource extraction is attributed to the extracting country although they do not consume it. The accounting of total material consumption (TMC)5 and the measure of 'material footprint' in raw material equivalents overcome these limitations, but TMC is difficult and time consuming to compile and material footprint requires a complex and globally comprehensive multi-region input output analysis [35]. Neither of these measures are available in a globally comprehensive data set for urban boundaries.
In principle, urban metabolism (UM) studies aim to report the total material and energy flows (in and out) and net additions for an urban area. Due to pervasive data limitations many UM papers do not attempt a complete material account but concentrate on material flows reported by, and of relevance to, local government (e.g. emissions to air and municipal solid waste) [36–39]. There are detailed studies reporting material flows connected to urban buildings, infrastructure and urban form or density [40–47] but their scope is limited to the built environment and construction rather than being 'economy-wide'.
Very few quantitative studies have the scope and direct data support for reporting on urban DMC: Cape Town [30], Hamburg [29], Paris [28], Singapore [32], Hong Kong [33, 48], Vienna [49], and Brussels [27]. To maintain the scope of urban MFA, the alternative to direct measurement is to use data derived from national statistics. Of the UM studies that we surveyed, (> 150 cities), a clear majority use top-down techniques to some degree in estimating urban material and energy flows [26, 31, 37–39, 50–65].
'Top-down' techniques scale lower resolution data (e.g. provincial or national material flows) with city-specific information (e.g. population or GDP), or assume intensities (e.g. national DMC/capita) apply at the city level. For example, Sahely et al [39] used provincial data on total concrete flows with metropolitan data on residential building construction to estimate metropolitan concrete consumption. To estimate global urban material consumption, we use a dataset that includes derived data in order to obtain a representative sample.
3. Data and methods
We define 'urban' as equivalent to metropolitan areas wherein reside the great majority of the residents, workforce and the economic activity that can be ascribed to a named city. This definition often includes some agricultural areas and production of non-metallic minerals for local construction. The aggregate of metropolitan areas within a major global region is our most detailed level of resolution and so our analysis homogenizes over within-region variations in urban form, governance structures, culture and the different economic functions of cities, among other attributes.
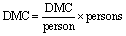
This paper presents estimations of a single urban material consumption indicator, DMC, aligned with standard MFA national accounting. Domestic material consumption is used to quantify the apparent material needs of a territory, including production activities and the net additions to long-lived stocks (vehicles, buildings and infrastructure). With the data available we could not attempt a global analysis for materials separating input and output components and net additions to stock, nor could we consistently identify separate types of material flows (e.g. biomass, fossil fuels, metals ores, non-metallic minerals).
3.1. Data and indicators
Given the general absence of direct urban material consumption data, we have collated the MIT Urban Metabolism database [62] with DMC data from nine other sources [26–33, 58]. Separate material flow classes reported in these studies do not concord easily, and we only use the aggregate DMC, or DMC/capita, data for consistency. The reference year was 2000 but where direct intensive data was available for another date (+/− 10 years), this was preferred over scaled or estimated data.
We have also collected the corresponding data for metropolitan populations, built up area and latitude from the Atlas of Urban Expansion data base [66]. 'Built up area' is based on an analysis of satellite image data of the built up, impervious area of cities. It includes any built up area within 1 km of another built up area, thus including suburbs and peripheral development but excluding large areas of agriculture and parks that may be within a metropolitan area. This is our basis for defining average population density.
Some data on urban GDP are available in the MIT Urban Metabolism database, which we supplemented with data from another global sample of cities [67, 68] converting all to a common measure of constant $US at 2000 ($US 2000). Data from Dobbs et al [67] were for 2010. Year 2000 values were obtained by reducing these data by the cities' respective national GDP growth rate 2001–2010. Data from [68] were based on original data from the OECD [69] for 78 cities collected between 1995 and 2002.
At the intersection of the DMC dataset, the GDP data and the Atlas of Urban Expansion database are 152 cities representing 425 million of the global urban population of 2.86 billion at 2000. Refer to the SI for the complete dataset.
For the transition theoretic approach, national DMC data for 1970–2010 were obtained and aggregated to these major global regional boundaries and normalised (DMC = 1 at 2000): Africa, Europe, northern America, eastern Europe, the Caucasus and Central Asia (EECCA), Latin America, the Caribbean and western Asia (see West and Schandl [70], [71] for more detail). These data were used to obtain the trend in relative change in DMC/capita over the long-term. Further justification and discussion of this approach can be found in the section on 'Use of national DMC/csapita data' in the SI.
3.2. Regression analysis
Our statistical analysis takes the same approach as a prior national-comparative global MFA study [14] and we use the same variables at the urban level. Ordinary least square regressions are used to fit the dependent variables of DMC or DMC/capita with a power law function of the explanatory variables of population, urban built up area, area per person, GDP, GDP/capita and latitude (as a proxy for climate). Initially a univariate analysis was conducted to survey correlations among all variables and to assess inclusion in the multivariate regression.
Equation 1: univariate regression equation

Equation 2: multivariate regression equation
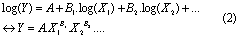
Y is the dependent variable, X is the independent explanatory variable, A and B are coefficients of the regression. Power law relations are ubiquitous in urban systems [72, 73] and this mathematical form has been used in studies of DMC/capita and 'material footprint'[35]. It also connects with the hypothesised IPAT relation [74] and the stochastic counterpart, STIRPAT [75], which both seek to explain impact (I) of socio-ecological systems in terms of population (P), affluence (A) and available technology (T). The latter term is interpreted as the materiality of affluence in lifestyle, ownership of durable goods and access to infrastructure and services such as buildings, roads, water and electricity supply.
It is important to acknowledge that data from Saldivar-Sali [62] in our global sample were derived from population scaling methods. This compromises the independence of the DMC data from population but not other explanatory variables. The original material flow data is from the Institute of Social Ecology Vienna6 [76]. Steinberger et al [14] found that population was the most significant explanatory variable in multivariate regressions for national MFA and we might also expect urban DMC to be significantly dependent on population without population scaled data.
There are further issues of population scaling where the characteristic material consumption of the host country or region is not the same as the urban areas. For this reason we have consciously excluded urban scaled data from countries that have a high DMC/capita e.g. Santiago, Chile and Melbourne, Australia.
3.3. Future estimations from regression results
To estimate future global urban DMC and DMC/capita we make use of the statistical results for urban intensive variables (e.g. km2/person, GDP/capita) and known or estimated extensive projections (e.g. persons).
Equation 3: use of intensive and extensive variables, where f() is some function obtained through the regression analysis.
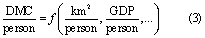
Future urban population projections were obtained from UNDESA [1]. To estimate future time-series urban GDP we used the relative change in national and regional real GDP projections (2010–2050) from the OECD [77] multiplied by average values for urban GDP/capita in major global regions at 2010 (see the SI). The latter were obtained from the sample of global cities at the union of data from the Brookings Institute7, [68] and Dobbs et al [67] collectively representing 332 globally distributed cities with 1.48 billion citizens (~40% of global citizens at 2010).
3.4. Transition theoretic approach
The sample of urban DMC/capita data supplies us with current average values for each major global region. The future relative change in those values is estimated with a logistic model fitted to regional time-series DMC/capita data (DMCcap) for regional urbanization transitions over intervals, Tr = 60–80 years. Tr and the start date for the transition, tr0, depends on the region, r (further explanation in SI). Our model has the mathematical form:
Equation 4

where t is time in yearly intervals, and k is a parameter that describes the speed of transition. The underlying assumption is that regions experience long-term transitions in their material metabolic rate through the compound and complex diffusion of new infrastructure, technology, systems and processes [34]. The projected urban populations in Africa and Asia suggest a substantial future transition that is not represented by current urban statistics.
Another assumption implicit in the mathematics is that all regions will approach some non-increasing saturation DMC/capita value by 2050. This assumed saturating trend is supported by historical observations for developed regions [34, 70, 76] noting that Europe has had a stable, long-term average DMC/capita of between 12–13 tons/person/year for at least 40 years. There is also empirical evidence of saturation of per capita stocks of key urban materials such as steel [78] and in durable goods [20]. DMCcap(T) is obtained from the extrapolation of a linear best fit through historical data, thus the model permits for a continuation of stable long-term average values, or change as guided by the historical record (see SI for more detail).
4. Results
First we present the gross statistics and variation in urban metrics for major global regions and then results based on statistical correlations between variables. Lastly, we present the outcome of the logistic modelling of regional urban DMC/capita.
4.1. Gross statistical estimation of current urban material consumption
We aggregate our sample of 152 cities to produce gross statistics about these major global regions: Africa, Europe, Northern America, EECCA, Latin America, the Caribbean and Western Asia –see table 1.
Estimates of urban DMC/capita in table 1 have considerable uncertainty but are bounded within national totals and consistent with development phase and level of urbanisation: Europe, North America and the transition economies of EECCA show the highest DMC/capita; Latin America and the Caribbean is the most urbanised region in the developing world, with 77% of its population living in urban centres and its DMC/capita is significantly greater than Africa and Asia and Pacific.
Table 1. Urban metrics for seven major global regions based on historical urban population data and averages for intensive variables at 2000 (number of cities n is shown for each region). Standard deviations (σ) of sample distributions for each region are shown for intensive variables and used to calculate the % error for the extensive calculations.
| DMCb (million tons/yr) | DMC/capa (tons/person/yr) | GDPb (billion $US 2000) | GDP/capitaa ($US 2000/person) | Built areab (km2) | Pop. density (person/km2) | Urban pop.c (millions) | |
|---|---|---|---|---|---|---|---|
| Africa | 1400 ± 43% | 5.1 σ = 2.2 (n = 25) | $2016 ± 9% | $7200 σ = $630 (n = 18) | 37700 ± 7% | 7400 σ = 490 (n = 25) | 278.8 |
| Asia and Pacific | 12300 ± 17% | 9.6 σ = 1.6 (n = 37) | $20200 ± 3.5% | $15800 σ = $560 (n = 114) | 194700 ± 4% | 6550 σ = 240 (n = 37) | 1274.8 |
| EECCA | 3200 ± 25% | 14.0 σ = 3.4 (n = 12) | $4600 ± 17% | $20100 σ = $3360 (n = 10) | 35300 ± 11% | 6500 σ = 700 (n = 12) | 230.6 |
| Europe | 4700 ± 27% | 15.3 σ = 4.2 (n = 25) | $12000 ± 7% | $38900 σ = $2670 (n = 68) | 96200 ± 6% | 3200 σ = 200 (n = 25) | 309.1 |
| Latin America and Caribbean | 5600 ± 25% | 14.0 σ = 3.5 (n = 24) | $7000 ± 8% | $17600 σ = $1340 (n = 22) | 70400 ± 7% | 5600 σ = 370 (n = 24) | 396.3 |
| North America | 6800 ± 15% | 27.4 σ = 4.0 (n = 16) | $12000 ± 11% | $48100 σ = $5170 (n = 88) | 122300 ± 10% | 2040 σ = 200 (n = 16) | 249.5 |
| West Asia | 1300 ± 18% | 10.9 σ = 1.9 (n = 14) | $2100 ± 15% | $18300 σ = $2810 (n = 12) | 19800 ± 12% | 5900 σ = 720 (n = 14) | 117.1 |
| Worldd,e | 34200 ± 22% | 12.0 σ = 2.6 (n = 152) | 56500 ± 7.4% | $19800 σ = $1470 (n = 332) | 550300 ± 4.5% | 5200 σ = 230 (n = 152) | 2856.1 |
Source: aUrban data from MIT database [62] and other sources [26–33, 58]—see SI. bObtained from per capita average multiplied by urban population. cData from UNDESA [1]. dTotals may not match sum over regions due to rounding error. eWorld average statistics are based on global totals not an average of regions or cities.
The global urban DMC at 2000 from these data is 34.2±7.5 billion tons/year (±22%). This is possibly an overestimate given that global total DMC for the same year was ~48.5 billion tons/year [14], and urban populations were still in a minority at that time.
A potential source for this overestimate is a bias toward wealthier cities that have a capacity for sustainability reporting. A first-order estimation of urban DMC at 2050 assuming the 2000 per capita rate and UN population projections is ≈73±16 billion tons/year (±22%).
4.2. Regression results
The results of the univariate regressions (table 2) show that urban DMC/capita does not correlate significantly (R2 >=0.5) with any single explanatory variable although GDP/capita and inverse density appear as good candidates for the multivariate regression. Latitude was included as a proxy for climate, anticipating that higher latitude cities might require more materials in buildings for insulation and more fuel for heating, but it does not correlate with any other variables based on data in our sample. DMC correlates strongly with GDP, population and moderately with built area and these are chosen for the multivariate regression for DMC (see table 3).
Table 2. Goodness of fit (R2) values for univariate regressions between key variables of DMC. GDP, built area, population, GDP/capita, area per person, latitude and DMC/capita. R2 values > 0.5 are highlighted in bold. See section 3.1 for information on the data sources.
| DMC (tons/yr) | GDP ($US 2000) | Built area (km2) | Pop. | GDP/capita ($US 2000/person) | Inverse density (km2/person) | Latitude | |
|---|---|---|---|---|---|---|---|
| DMC/capita (tons/person/yr) | 0.1308⁎⁎⁎ | 0.1136⁎⁎⁎ | 0.0545⁎⁎ | 0.0371⁎ | 0.4847⁎⁎⁎ | 0.2592⁎⁎⁎ | 0.1593⁎⁎⁎ |
| DMC (tons/yr) | 0.7670⁎⁎⁎ | 0.4528⁎⁎⁎ | 0.7142⁎⁎⁎ | 0.1465⁎⁎⁎ | 0.0617⁎⁎ | 0.0309⁎ | |
| GDP ($US 2000) | 0.5029⁎⁎⁎ | 0.5307⁎⁎⁎ | 0.4729⁎⁎⁎ | 0.0062 | 0.0867⁎ | ||
| Built area (km2) | 0.3299⁎⁎⁎ | 0.1818⁎⁎⁎ | 0.0884⁎⁎⁎ | 0.0244⁎ | |||
| Population | 0.00001 | 0.3063⁎⁎⁎ | 0.0019 | ||||
| GDP/capita ($US 2000/person) | 0.2226⁎⁎⁎ | 0.2268⁎⁎⁎ | |||||
| Inverse density (km2/person) | 0.0528⁎⁎ |
⁎ p < 0.1, ⁎⁎p < 0.01, ⁎⁎⁎p < 0.001.
Table 3. Results of multivariate regressions for DMC and DMC/capita, with explanatory variables identified in table 2. Shaded area indicates a rejected explanatory variable. See SI for full results.
| DMC | Coef. | Standard error | t | P>|t| | 95% Confidence interval | R2 | |
|---|---|---|---|---|---|---|---|
| GDP ($US 2000) | 0.4072 | 0.03 | 13.682 | < 0.0001 | 0.348 | 0.466 | |
| Built area (km2) | 0.0561 | 0.047 | 1.2 | 0.232 | −0.036 | 0.148 | 0.858 |
| Population | 0.4604 | 0.047 | 9.856 | <0.0001 | 0.368 | 0.553 | |
| DMC | |||||||
| GDP ($US 2000) | 0.4191 | 0.028 | 14.922 | <0.0001 | 0.364 | 0.475 | 0.999 |
| Population | 0.463 | 0.047 | 9.907 | <0.0001 | 0.371 | 0.555 | |
| DMC/capita | |||||||
| GDP/capita ($US 2000/person) | 0.3695 | 0.02 | 18.491 | < 0.0001 | 0.33 | 0.409 | 0.954 |
| Inverse density (km2/person) | 0.1419 | 0.022 | 6.384 | < 0.0001 | 0.098 | 0.186 | |
Attempting a multivariate regression for urban DMC with GDP, population and built area, we find the latter can be rejected as an explanatory variable (see shaded area of table 3). Urban GDP and population alone show a significant correlation with urban DMC (R2 = 0.999). As DMC is an extensive variable that responds to the scale of a city, it might be expected that population and income would be strong drivers of urban DMC. DMC/capita correlates well with urban GDP/capita and inverse population density (R2 = 0.954). This may be interpreted as urban DMC/capita having a connection to individual affluence through income and collective affluence through the area of the city available to each citizen (though they may not own it entirely). It is also reasonable to expect that where a city is less dense, there would be more material infrastructure connecting and serving a distributed population than otherwise. Interestingly, the national-level regression studies on DMC and DMC/capita found that area was not a good explanatory variable [14].
The significant univariate regressions from table 2 shown in figure 2 are notable for each exponent being less than 1 (sub-linear or inelastic) suggesting a global tendency for relative decoupling of direct urban material needs with increasing income and increasing population, which concords with national-level regression results [14] and sublinear population scaling seen generally in cities [72]. However, other studies have found super-linear scaling for municipal waste in megacities [38] and linear scaling of DMC against GDP for Singapore [32]8. Using urban population projections and estimated future urban area and GDP (see SI), we may substitute into the power law regression relationships using the coefficients in table 3 to obtain another estimate of global urban DMC at 2050: 106 ± 35 billion tons/year (±33%).
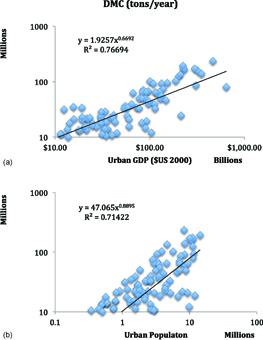
Download figure:
Standard image High-resolution image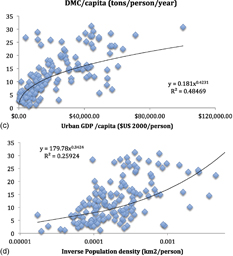
Figure 2. Univariate regression results for: urban DMC (tons/year) vs (a) urban GDP and (b) population; and DMC/capita (tons/person/year) and (c) urban GDP/capita ($US 2000/person) and (d) inverse population density. Trends fitted using a power law according to Equation 1.
Download figure:
Standard image High-resolution image4.3. Transition theoretic approach
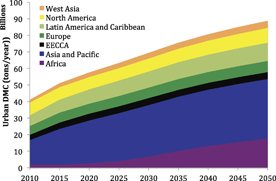
The saturation of apparent material requirements with city size and income suggest that ultimately urban DMC/capita reaches some equilibrium level related to a complex interplay between urban growth, material efficiency and the larger importance of maintenance of material-intensive in-use stocks with a larger city size. Modelled results in the following analysis assume that per capita material consumption in durable and non-durable goods, fuel use, civic and private infrastructure, will increase with development to a point [34, 36]. Evidence of saturation in regional DMC is found in the collected national data for European countries [70], which indicates the mathematical characteristics of the logistic curve described in section 3.4, are a reasonable choice. More detail on the DMC/capita simulation, assumptions, results and a sensitivity analysis is in the SI.
Under this modelling, all major global regions see an increase in their total DMC (figure 3). Total world urban material consumption is estimated to rise from around 40 billion tons in 2010 to nearly 90 billion tons in 2050 for a projected urban population of 6.31 billion. Underlying this is a simulation of urban DMC/capita where all developing regions increased, and all developed regions marginally decreased their DMC/capita. The range for average urban DMC/capita across regions was 8–17 tons/person/year at 2050 with higher values in North America, Asia and the Pacific and western Asia, mid range values in Europe, eastern Europe and Central Asia, and lower values in Africa, Latin America and the Caribbean.
Figure 3. Total urban DMC for major global regions from a simulation of future urban DMC/capita using logistic trend curves.
Download figure:
Standard image High-resolution image
5. Discussion
Table 4 summarises global estimates of urban DMC and urban DMC per/capita at 2050 from three methods: current global per capita average extrapolated with projections of World urban population; using regression relationship with an estimation of urban GDP/capita and urban built area/capita growth to 2050 and; mathematical modelling based on expectations of continuing trends and transitions in regional average DMC/capita.
Table 4. Global results for urban DMC and DMC/capita at 2050 based on three methods of estimation and projections of urban population and estimations of urban GDP/capita (see SI and [79]). Estimates of uncertainty are based on: (a) standard deviation of available data, (b) standard error of the estimate and (c) the range of outcomes from a sensitivity analysis in brackets.
| Method | Urban DMC (109t) | Urban DMC/capita (t/person/year) | Uncertainty |
|---|---|---|---|
| Mean of global sample | 73 | 12 | ±22%(a) |
| Multivariate regression | 106 | 17 | ±33%(b) |
| Logistic model | 89 (66–111) | 14 (10.5–18) | (c) |
The calculation from the power law regression relies on current data about cities when a third of the world's urban population (and approximately a third of our sample set of cities) is in the developed world. Neither the predominance of the developing world in the urban population of 2050, nor any change in regional per capita urban DMC is represented by the power law regression. This results in an overestimate compared to the modelling of transitions in DMC/capita that has regional resolution and uses regional urban projections to obtain the global urban DMC and average DMC/capita.
Our transition theoretic results are based on a phenomenological model fitted to historical data but the results are consistent with elements of expected future urban development: the persistence of the long-term de-densification trend driving up built area [80]; the expansion of urban populations, notably in Africa and South Asia; and the geometric rise in per capita income, especially in the smaller cities of the developing world [67].
A previous UN report [81] proposed several scenarios of future global material consumption. Their 'business-as-usual' scenario produced an estimate of global average DMC/capita of 16 tons/person/year at 2050 and a total DMC of 140 billion tons/year. By 2005, global total material needs were 60 billion tons, by 2010 it was 79.4 billion tons [82] and in a more recent 'business-as-usual' scenario, global material extractions were simulated to exceed 180 billion tons per year at 2050 [83]. Although our scenario serves mainly as a reference case and is agnostic of policy interventions, the global material history of the last 10–15 years suggests that the assumptions about globally increasing resource requirements are realistic. It is notable that the ratio of urban to global DMC rises from approximately 0.45 at 2000 to between 0.5 and 0.64 depending on which of the simulated future global material consumption values are used from above.
We could not provide a breakdown of urban DMC into material flow types but what is known from historical national-level data [84, 85], is that the least developed countries consume proportionally more biomass as their economy depends on it for food, buildings and energy. Over the last 10–15 years, developing and urbanising countries (e.g. Vietnam, Thailand and China) have seen a rapid increase in their consumption of non-metallic minerals (NMM) to the point where this type of material flow is > 50% of DMC. NMM flows are driven by building and infrastructure construction [42, 86]. Developed countries appear to have a proportionally greater need for NMM and fossil fuels in their DMC [84, 85]. Thus we may expect in the developing and urbanising regions of Asia and Africa that DMC/capita will rise and that much of this change will be in the form of NMM, metals and fossil fuels.
The above expectations are based on the 'business-as-usual' case and assuming an expanded use of fossil fuels in developing countries [87]. Such outcomes may be mitigated by progress toward circular economy ideals and the potential for dematerialising consumption [11].
Generating future scenarios of urban DMC/capita is problematic and uncertain as can be seen from the variation in our results. DMC/capita is highly contingent on resource availability at location, development phase, socio-economic or political upheaval and the latent effect of historical investments e.g. in long-lived infrastructure such as coal fired power stations. It would be optimal to simulate urban material flows with a stock flow model that accounted for material held in long-lived stocks (buildings, vehicles, infrastructure etc.) and the annual flows resulting from their retirement and replacement. This has been attempted for some global regions and particular materials [78, 88, 89] but no globally comprehensive database or model is available. To distinguish materials in in-use urban stocks for different regions, this effort would also entail estimating the material intensity of a large variety of urban forms and their spatial incidence. Even without an appreciation of the underlying stock dynamics, our chosen DMC indicators still connect to the operating material needs of stocks, changes in stock and the material requirements of their maintenance.
6. Conclusion
This paper estimates the material requirements of future urbanisation using three different methods (gross statistics; regression; and transition theoretic logistic model). Each assumed that current aggregate trends about urban population, income and material flow indicators continue into the future.
Urban DMC/capita is significantly correlated to urban GDP/capita and the inverse of population density in a multivariate regression that is consistent with previous statistical analysis at the national level. Regressions on extensive variables suggest that total urban DMC has some statistical relationship with income, population size and built area (or density). However, our data likely over-represents wealthier cities able to report on environmental sustainability indicators.
To model expected urban transitions at the regional level to 2050 we used a logistic model of urban DMC/capita under general assumptions that developing major global regions will increase their urban metabolic rate per capita, but not continue increasing that rate far beyond the levels seen in developed regions, which were assumed to continue or equilibrate at some level during the scenario period.
Combining trends in population, income, and models of material consumption transition, DMC was calculated for urban areas of the world's major regions to 2050 and the global aggregate compared to other estimates. We assumed no significant change in infrastructure technology. Urban material consumption is estimated to increase from ~40 billion tons in 2010 to ~90 billion tons in 2050. During this period DMC/capita across regions was estimated to converge from a range of 5–27 tons/person/year at 2000 to at around 8–17 tons/person/year, but the global average to increase from ~12 to ~14 tons/person/year exceeding the range to achieve decoupling targets [81]. This raises the question of how cities might depress resource intensive trajectories to achieve lower DMC figures, whilst also improving quality of life for their citizens.
Acknowledgments
This manuscript has benefitted from valuable input from James West, Heinz Schandl and reviews by Edgar Hertwich and Stefanie Hellweg for the UN International Resource Panel. The authors thank Professor Mark Swilling and Blake Robinson of the Sustainability Institute of Stellenbosch University for their support.
Footnotes
- 4
Depending on the context, we refer to 'urbanisation' as either the process whereby a greater proportion of people live in cities or a state represented by the proportion of people living in cities.
- 5
- 6
- 7
- 8
Singapore's historical material flow accounts are confounded with a few one-off infrastructure developments, notably Changi Airport.