

Abstract
Globally, forest die-off from global-change-type drought events (hotter droughts) are of increasing concern, with effects reported from every forested continent. While implications of global-change-type drought events have been explored for above-ground vegetation, below-ground organisms have received less attention, despite their essential contributions to plant growth, survival, and ecosystem function. We investigated rhizosphere fungal communities in soils beneath trees affected by a global-change-type drought in a Mediterranean climate-type ecosystem in southwestern Australia, quantifying how fungal richness, composition and functional groups varied along a drought impact gradient. Following a forest die-off three years previously, we collected soils beneath dead and alive trees within forest exhibiting high, minimal and relatively unaffected levels of forest die-off. Rhizosphere fungal DNA was extracted from soils, amplified and subjected to high throughput sequencing. Fungal community composition varied significantly (P < 0.001) along the drought impact gradient with less richness in drought affected stands. There was some evidence of community differentiation between dead versus alive trees (P = 0.09), and no difference in rarefied richness and diversity. When considered by functional group, die-off-impacted plots had more arbuscular mycorrhizal fungi (AM) and saprotrophs, and fewer ectomycorrhizal fungi (ECM), compared with living trees from the unaffected plots. Further, within die-off plots, dead versus alive tree rhizosphere samples contained more AM, saprotrophs and pathogens, and fewer ECM. Disruptions to rhizosphere fungal communities, such as altered functional groups, can have implications for ecosystem persistence and function, particularly in regions projected to experience increased global-change-type drought events.
Export citation and abstract BibTeX RIS

Original content from this work may be used under the terms of the Creative Commons Attribution 3.0 licence. Any further distribution of this work must maintain attribution to the author(s) and the title of the work, journal citation and DOI.
Introduction
Globally, drought and heat-induced forest die-off is garnering increasing concern and prominence, with effects reported from every forested continent (Allen et al 2010, Cobb et al 2017, Ruthrof et al 2018). The combined effects of drought and higher temperatures on forests, termed global-change-type drought (Breshears et al 2005), are of particular concern, given that drought and heat events are predicted to increase in incidence, severity and duration in the future (IPCC 2012, Cowan et al 2014). Consequences of forest die-off events may be cross-scale and complex, including substantial direct changes to forest structure (Matusick et al 2016), composition (Allen and Breshears 1998) and function (Royer et al 2011, Lindenmayer et al 2012) and indirectly through interactions with other disturbance agents, including fire (Enright et al 2015, Ruthrof et al 2016) and pests (Jactel et al 2012). Common effects include changes to the carbon cycle (Hicke et al 2012), nutrient and water balances (Adams et al 2012), near-ground radiation (Royer et al 2010), and potential fire behaviour (Ruthrof et al 2016). If tree die-off occurs at sufficiently large scales, associated changes in microclimate (Royer et al 2011) can affect important land surface-to-atmosphere feedbacks including fluxes of energy, carbon and water (Adams et al 2010, Royer et al 2010). Although the implications of global-change-type drought events have been investigated for above-ground vegetation, below-ground organisms have received much less attention, despite their essential contributions to diversity and ecosystem processes (Bardgett et al 1999, van der Heijden et al 2008).
Microbial communities are dynamic in response to disturbance events, and given the key role they play in maintaining ecosystem functioning, they may be an important factor influencing resilience under global-change-type drought. For example, mycorrhizal associations can improve host resistance to drought (Parke et al 1983, Akema and Futai 2005), which is due, partially, to improved nutrient supply and water uptake afforded to them via their mycorrhizal associations. Mechanisms involved include decreased resistance to water flow from soil to roots, increased absorptive surface, potential for fungal hyphae to penetrate smaller soil pores than root hairs, changes in membrane permeability due to increased phosphorus availability, and/or altered hormonal regulation of stomatal closure (Parke et al 1983). Species-specific functional roles of mycorrhizal fungi in drought resilience appear likely since trees can adjust their mycorrhizal associations under drought conditions (Querejeta et al 2009, Gehring et al 2014), suggesting some form of control of colonisation by trees (Kiers et al 2011). Although microbial communities may be an important buffer against disturbance-mediated environmental changes, the responses of these communities to drought per se remains unclear (Yuste et al 2012, Morrien and van der Putten 2013).
Climate change has been projected to accelerate the activity and interactions between soil consumers, detritivores, decomposers and other microbes (Wolters et al 2000). Higher temperatures can accelerate microbial activity and turnover, causing the community to shift towards taxa that are adapted to higher temperatures and faster growth rates, such as fungi (Zhang et al 2005), and chronic reduction in soil moisture conditions can trigger abundance and compositional changes in soil fungal communities (Toberman et al 2008, Schmidt et al 2018). Generally, fungal abundance increases under warming treatments (Clemmensen et al 2006, Allison and Treseder 2008, Castro et al 2010); however, experimental treatments have been warmer and moist, with little understanding how drier soils or temperature thresholds will impact fungal taxa activity, composition and abundance (i.e. the availability to colonise seedling roots).
Mediterranean southwestern Australia provides an important opportunity to study the effects of climate-change type drought. The region has undergone a distinct shift in climate since the mid-1970s with a temperature increase of 0.15 °C per decade and decline in annual precipitation by 15%–20% (Bates et al 2008). On top of this chronic change, an acute drought event occurred during the Australian winter of 2010 with 40%–50% less rainfall, and the driest year on record for much of the region (BOM 2011b). Following the acute drought, in the austral summer of 2010/2011, the region experienced a series of heatwaves, one of which included nine days over 35 °C (BOM 2011a). During this time, a number of significant forest and woodland communities experienced widespread die-off events, including Eucalyptus marginata and Corymbia calophylla forest in the Northern Jarrah Forest (NJF) (Brouwers et al 2013, Matusick et al 2013), E. gomphocephala woodland (Matusick et al 2012), and Banksia attenuata and B. menziesii woodland (Bader et al 2014, Challis et al 2016). Tree crowns began to rapidly discolour, and, in the NJF, for example, resulted in an estimated 16 000 ha (1.6% of the forest type) of near complete canopy dieback, which had not been observed previously (Matusick et al 2013). In the NJF, forest die-off was associated with sites having lower water holding capacity and close to rocky outcrops (Brouwers et al 2013), and were larger, and more densely clustered in xeric areas (Andrew et al 2016). Some secondary and tertiary effects were observed following the die-off event, such as an outbreak of a native Cerambycid beetle (Seaton et al 2015), and elevated dead material raising fire hazard and predicted intensities (Ruthrof et al 2016).
Vegetation impacts and response to the drought and heatwave event have been well documented, presenting a powerful opportunity to investigate soil fungal communities, gain globally relevant insights, and add an important example from a Mediterranean-type climate region dominated by broad-leaved, non-coniferous tree species. By quantifying overall rhizosphere fungal community change and examining functional shifts in communities, we aimed to provide fundamental insights into impacts and how the ecosystem will be affected. Specifically, we quantified rhizosphere fungal communities across a drought impact gradient in terms of (1) species richness, diversity and compositional shifts, and (2) changes in relative functional abundance, as well as (3) the contrast between fungi associated with dead and alive trees on the drought-impacted sites.
Methods
Study site
The NJF, southwestern Australia, covers an area of 1 127 600 ha (Havel 1975), and ranges in form from tall, dense stands occurring in the higher rainfall areas in the south, to shorter, more open stands in the northern and eastern fringes of the forest (Bell and Heddle 1989). The dominant forest canopy species is Eucalyptus marginata, commonly representing >80% of the composition, with Corymbia calophylla as a co-dominant, mainly in the uplands. The present study focussed on E. marginata. The climate of the NJF is Mediterranean-type, with cool, wet winters with most precipitation (∼80%) falling between April and October (Bates et al 2008), and a seasonal drought that can last four to seven months (Gentilli 1989). There is a strong west-east precipitation gradient across the forest, ranging from >1100 mm yr–1 on its western edge (Darling Scarp) to ∼700 mm yr–1 in the east and north (Gentilli 1989). The NJF covers Archaean granite and metamorphic rocks, capped by a widespread lateritic duricrust, creating a plateau with an usual elevation of ∼300 m, and interjected by occasional granite outcrops in the form of isolated hills (Churchward and Dimmock 1989).
For this study, we chose two discrete forest patches in the NFJ that had experienced die-off in 2011 and which comprised part of a broader network previously surveyed in other studies (Matusick et al 2013, Matusick et al 2016, Ruthrof et al 2016). Sites 165 and 166 (32°33'58.60''S, 116°0'16.70''E and 32°33'45.87''S, 116°0'33.76''E, respectively), were located 1 km apart and 69 km SSE of Perth, the capital of Western Australia.
Forest variables
Forest stand variables collected and used for other projects examining the forest die-off in the NJF (Matusick et al 2013, Ruthrof et al 2015, Matusick et al 2016, Ruthrof et al 2016) were used to understand what may be driving shifts in fungal communities. Variables were collected at the stand scale and took into account 18 plots, made up of 6 m radius plots, three inside the primary drought affected area, three minimally affected plots and three unaffected plots, at two sites. These included canopy cover, percent cover of leaf litter, herb, bare ground, and coarse woody debris (>7.6 cm diameter), and stem data (see below). Canopy cover was measured using a spherical densiometer (Lemmon 1956), four times at each plot, at plot centre, but facing each cardinal direction. Percent cover of leaf litter, herbs, bare ground, and wood was estimated at five points at each plot; at the centre, and at the four cardinal points, 6 m away from the centre. Stem data (as opposed to tree-level data) had been taken previously for Matusick et al (2016). Briefly, all stems over 1 cm diameter at breast height (DBH) in each 6 m radius plot were measured for species, DBH, height and crown health (rating 1–4; 1 = healthy, green turgid foliage, 2 = dying, dry and discoloured foliage, 3 = recently killed, red and dead foliage, 4 = long dead, lack of leaves and twigs, and decorticating/slipping bark).
Soil collection
Soil samples were collected from beneath adult E. marginata trees in August 2014 (three years post drought) at the two study sites. At each site, three plots were sampled: one plot within the die-off affected area (hereafter called drought), one plot 20 m away (hereafter called minimal, which was minimally affected by the drought event, but still within the same forest type), and a third, a control plot (hereafter called unaffected, as it was within unaffected forest). Unaffected plots were located 50 m away from the minimal plot (i.e. 70 m away from the drought plot). Within drought plots, soil was collected from the rhizosphere (top 5 cm of soil, 50–100 cm from the base) of five dead and five alive E. marginata trees. At each of the minimal and unaffected plots, soil was collected from ten living trees (30 samples at each site yielding a total of 60 soil samples). There were too few dead trees in the minimal and unaffected plots in which to undertake analysis (there were dead stems, however, not dead trees). At each tree, four soil samples of 50 g each were collected from the base of each tree in each cardinal direction, and then bulked. Soil sampling equipment was sterilised between replicates. Samples were kept in a cooler in the field before being transferred to a −20 °C freezer on the day of collection.
Molecular analysis
Each bulked soil sample was mixed and passed through a sterilised 2 mm sieve to remove leaves and fine debris. A 50 mg subsample was taken from the sieved and mixed soil and used for further analysis. Total DNA was extracted from the 60 soil samples using the PowerSoil Pro DNA kit (MoBio, Carlsbad, California, USA, https://mobio.com/) following the protocols specified by the manufacturer. Molecular grade water was used to resuspend the DNA pellet.
The nuclear ribosomal internal transcribed spacer (ITS) region is used as the universal barcode for fungi (Schoch et al 2012). Due to length restrictions and potential biases in sequencing the entire ITS region (Lindahl et al 2013) the ITS2 region was amplified from soil DNA using the primer fITS7 (GAACGCAGCRAAIIGCGATA; specific for higher fungi) (Ihrmark et al 2012) and the general primer ITS4 (White et al 1990) with adapters attached. The ITS4 primer contained a ten base pair tag specific to each sample. PCR amplification of each sample occurred in 25 μl reactions and contained 0.025 U μl−1 HotStarTaq and buffer (Qiagen, Valencia, CA), 200 μM of dNTPs, 500 nM fITS7, 500 nM ITS4, 2.75 mM MgCl2, and 0.125 ng μl−1 of genomic template DNA.
Extraction controls (an extraction with no soil template added) and PCR negative controls (no sample added) were used to determine that there was no contamination during DNA extraction and amplification. The PCR cycle parameters consisted of an initial denaturation at 95 °C for 5 min, 30 cycles of denaturation at 95 °C for 30 s, annealing at 57 °C for 30 s and extension at 72 °C for 30 s, followed by a final elongation step at 72 °C for 7 min. Two replicate PCRs were performed per sample and these were combined following amplification.
The products were visualised on a 1% agarose gel and then mixed in similar concentrations before being cleaned using an Agencourt AMPure® XP PCR purification kit (Beckman Coulter Inc., MA, USA). The final library was then subjected to 454 sequencing on a Roche GS Junior at the Western Australian State Agricultural Biotechnology Centre located at Murdoch University. No sequencing reads were obtained for the DNA extraction and PCR negative controls.
Bioinformatics
Sequence reads generated from the 454 sequencing were subjected to quality control and single-linkage clustering using the Sequence Clustering and Analysis of Tagged Amplicons (SCATA) pipeline (scata.mykopat.slu.se). SCATA is a bioinformatics pipeline specially developed for processing fungal ITS datasets derived from 454-sequencing (Lindahl et al 2013). The workflow of this pipeline has been extensively detailed by Clemmensen et al (2015). We used the settings described by Nguyen et al (2017). Prior to clustering, all sequences were trimmed to 300 bp length and the primers removed. A clustering similarity of 98.5% was used, corresponding approximately to species level for ITS (Lindahl et al 2013, Ottosson et al 2015, Nguyen et al 2017). The most abundant genotype for each cluster was used to represent each operational taxonomic unit (OTU). Raw molecular data are stored at the Sequence Read Archive (SRA) curated by NCBI under the accession number SRP159043.
Representative OTU sequences were identified where possible by searching against internally curated SCATA databases and by blasting against NCBI's sequence database GenBank (Altschul et al 1990) through Geneious (version R8.0.2, http://geneious.com (Kearse et al 2012). Internally curated SCATA databases included a recent version of UNITE (Koljalg et al 2013, Clemmensen et al 2015) and data collected for a number of other studies of fungi in southwestern Australia (Dundas et al 2018, Sapsford 2018, Tay et al 2018). Putative species-level assignment was made based on best matches over the entire length of the query sequence and 98.5%–100% sequence similarity. Between 94% and 98% sequence similarity was considered for genus level, 90%–93% family level and 80%–89% sequence similarity for ordinal level, after Ottosson et al (2015) and Nguyen et al (2016). Similarity less than 80% was assigned to class level. Potentially similar OTUs were aligned in Geneious to confirm identification. The relative abundance of each OTU per sample was determined from the sequence reads as the number of reads for an OTU divided by the total number of reads for the sample (Nguyen et al 2017).
OTUs were ranked by the number of reads in the dataset and for the 200 most abundant OTUs across the dataset (representing 88% of all reads), we performed NCBI blastn searches for identification (as described above) and literature searches to assign them a putative function. Where possible, these OTUs were designated into functional categories based on their putative life history following ecological guild assignment sensu FUNGuild (Nguyen et al 2016). Guilds used in this study included ectomycorrhiza (ECM), arbuscular mycorrhiza (AM), ericoid mycorrhiza (ericoid), saprotroph, endophyte, or pathogen. Where guild membership was ambiguous (i.e. ECM or saprotroph), OTUs were assigned membership in both groups.
Statistical analysis
Our overarching goals were to quantify community and functional change in rhizosphere fungi along a gradient of drought impact and alive versus dead trees. To achieve this, we present data and analyses at the community level and for functional groups within the fungal community. All analyses were performed in the R 3.2.2 programming language (R Core Team 2017) using analytical packages Vegan (Oksanen et al 2017), 1me4 (Bates and Maechler 2011) and graphical package ggplot (Wickham 2009). In all cases, we present means and 95% confidence intervals; lack of overlap of the mean with adjacent confidence intervals was interpreted as evidence for statistical difference between groups, while asymmetrical overlap of means (intervals overlap one mean but not the other) was interpreted as suggestive evidence of a statistical difference between groups (Ramsey and Schafer 2002).
Above-ground vegetation. The sampled sites and plots formed portions of a larger study (Matusick et al 2016, Ruthrof et al 2016). Data were summarised to characterise the forest understory (percent cover of leaf litter, understory vegetation, bare ground), tree canopy condition (percent canopy cover measured with a densitometer), and drought impact on trees (percent stem mortality).
Community metrics and analysis. To assess compositional shifts in the rhizosphere soil fungal community along the drought impact gradient and with tree status (alive/dead), non-metric dimensional scaling (NMDS) based on Bray–Curtis dissimilarity was carried out on relative abundance data generated from the OTU species matrix after removing global singletons and doubletons. The resulting matrix of 1306 OTUs by 60 sample units had a two-dimension solution with a stress of 0.21. Rarefied richness and Shannon diversity of OTUs were calculated using the 'diversity' function in Vegan using raw OTU counts for rarefaction and relative abundance for Shannon diversity. To support the NMDS analysis and quantify differences in fungal community composition among groups, permutational multivariate analysis of variance (PERMANOVA) using the 'adonis' function (Anderson 2001) was used (9999 permutations) to test for differences in rhizosphere fungal community composition along the drought impact gradient (Oksanen et al 2017), and in rhizosphere fungal community composition beneath dead and alive trees within the die-off plots.
To quantify changes in individual functional groups and OTUs, we employed two analytical approaches. First, we used a linear mixed-effect model to evaluate evidence for changes in functional group mean relative abundance in drought condition (control-minimal-drought) and tree status (alive–dead). In all cases, the experimental units were individual trees with a random effect of plot and a fixed effect of drought type or tree status. These models were run for each of the six focal functional groups and we report effect estimate, standard error, t-value, and p-value. We found no evidence of model violations after visually inspecting model residuals. Second, to identify OTUs associated with each unique condition (alive versus dead trees, drought affected, hereafter = drought, minimally affected = minimal, unaffected = unaffected) we used an indicator species analysis with function 'indicspecies'. Indicator OTUs were assigned to functional guilds in the same manner as previously described for the most abundant OTUs (De Caceres and Legendre 2009) and then tallied by sample type (dead trees in drought plots and alive trees in drought plots, minimal, unaffected plots).
To supplement our understanding of changes in relative abundance, we followed the approach of Treseder et al (2016) calculating the change in frequency of occurrence, For each OTU with a functional assignment (top 200 OTUs), we calculated the percent change in occurrence along the drought gradient: drought versus unaffected, minimal versus unaffected and dead versus alive trees. OTUs not occurring in either member of a pairwise contrast were excluded.
Results
Forest variables
Consistent with larger datasets from the same ecosystem measuring forest impacts and response, the drought gradient was associated with a significant, monotonic decline in stem density from most impacted to not impacted (figures 1(a), (d)). More dead stems were present in drought plots (figures 1(a), (d)) and canopy cover showed a more threshold style impact with drought plots having significantly lower canopy cover (figures 1(b), (d)–(f)). There were very few dead trees (as opposed to individual resprouting stems) in the minimal and unaffected plots). Understory dynamics were characterised by more leaf litter and less bare ground in unaffected plots and more understory vegetation in drought plots (figure 1(c)).
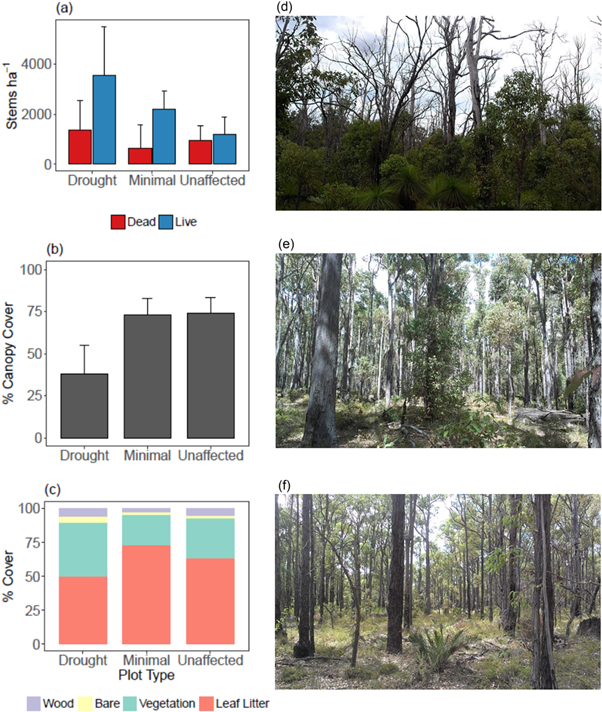
Figure 1. Forest variables (a) mean alive and dead stems/ha, (b) mean % canopy cover, (c) mean % cover of wood, bare ground, understorey vegetation, leaf litter, and photos showing examples from the Northern Jarrah Forest, southwestern Australia, along a drought gradient: (d) drought (drought affected plot), (e) minimal (minimally affected plot), and (f) unaffected (unaffected plot). Forest variables are means of six plots/plot type for stems/ha, 24 measurements/plot type for % canopy cover and 30 measurements/plot type for % cover.
Download figure:
Standard image High-resolution imageFungal community dynamics
A total of 1790 fungal OTUs and 880 singletons were identified, comprising 151 063 sequences. After removing singletons and doubletons, 1306 OTUs remained (149 215 sequences). The two hundred most abundant OTUs comprised 131 331 reads (∼88% of the total) and primarily belonged to the Ascomycota (62%) and Basidiomycota (28.5%).
Along the gradient of drought, minimal, and unaffected plots, a decline in richness and diversity was observed (figures 2(a), (b)). We found no evidence for a difference in rhizosphere fungi under dead versus alive trees in the drought plots in terms of richness or diversity (figures 2(a), (b)).

Figure 2. (a) Mean observed operational taxonomic units (OTU) rarefied richness (with 95% confidence intervals, CI) and (b) mean Shannon diversity (with 95% CI) of rhizosphere fungal communities along a drought gradient and dead and alive trees in the Northern Jarrah Forest, southwestern Australia. Values are means for the dead (n = 10) and alive (n = 10) trees inside the die-off plots and for the minimal drought (n = 20) and unaffected (n = 20) plots.
Download figure:
Standard image High-resolution imageFor the three pairwise contrasts in the dataset, we found most OTUs exhibited increasing or decreasing responses rather than neutral (table 1). Neutral responses ranged from 7% (drought versus unaffected) to 20% (dead versus alive trees) whereas negative responses ranged from 38% (minimal versus unaffected) to 46% (drought versus unaffected; table 1).
Table 1. Counts and proportion of total for three pairwise contrasts of all operational taxonomic units (OTUs) in rhizosphere fungal communities along a drought gradient and alive/dead trees in the Northern Jarrah Forest, southwestern Australia.
| Contrast | Responsea | Count | Proportion |
|---|---|---|---|
| Dead versus alive tree | Negative | 354 | 0.40 |
| Neutral | 180 | 0.20 | |
| Positive | 346 | 0.39 | |
| Drought versus unaffected | Negative | 490 | 0.46 |
| Neutral | 74 | 0.07 | |
| Positive | 503 | 0.47 | |
| Minimal versus unaffected | Negative | 431 | 0.38 |
| Neutral | 179 | 0.16 | |
| Positive | 518 | 0.46 |
aNegative: decreasing occurrence; neutral: no change; positive: increasing occurrence.
The NMDS revealed particularly clear differences among plot types (drought, minimal, unaffected) with some separation of dead versus alive tree samples (figure 3, table 2) but no evidence for an effect of dead versus alive trees (F = 1.3, P = 0.09; table 2).

Figure 3. Non-metric multidimensional scaling (NMDS) ordination for fungal communities based on DNA extracted from rhizosphere soils along a drought gradient (drought, minimal and unaffected), and for dead (squares) and alive trees (circles) within the drought plots in the Northern Jarrah Forest, southwestern Australia.
Download figure:
Standard image High-resolution imageTable 2. Analysis results for rhizosphere fungal community composition from soil along a drought gradient (drought, minimal, unaffected) and dead/alive trees in the Northern Jarrah Forest, southwestern Australia.
| df | Sums of sqs | Mean sqs | F-stat | R2 | P-value | |
|---|---|---|---|---|---|---|
| Plot type | 2 | 1.29 | 0.64 | 3.1 | 0.10 | <0.001 |
| Tree condition | 1 | 0.27 | 0.27 | 1.31 | 0.02 | 0.09 |
| Residuals | 56 | 11.53 | 0.21 | 0.88 | ||
| Total | 59 | 13.08 | 1.00 |
Indicator species analysis detected a total of 112 unique OTUs significantly (P < 0.05) associated with one of the groups (drought, minimal, unaffected, dead versus alive trees). Of the 112 OTUs (∼8.6% of all OTUs), 46 were within the top 200 most abundant OTUs while 66 were not.
Changes in functional groups
Mean relative abundance (+95% confidence intervals) of each functional group displayed several distinct, substantial shifts along the drought gradient or between dead versus alive trees (table 3, figure 4). Monotonic changes along the drought gradient with highest relative abundance in drought plots was observed for ericoid, saprotrophic, and AM groups with ericoid response statistically significant (t = 3.81, P = 0.001; table 3). ECM fungi displayed an opposite and strong, statistically significant monotonic trend being most abundant in unaffected plots (t = 3.72, P = 0.001). Mixed patterns with regard to the drought gradient were present for endophytes and pathogenic fungal guilds. When considering alive versus dead trees within drought plots, AM and pathogenic fungi (t = 3.41, P < 0.003) were more abundant associated with dead trees. In contrast, ECM, ericoid, and endophytes were more abundant associated with alive trees though no significantly so (figure 4).
Table 3. Analysis results for rhizosphere fungal functional groups from soil along a drought gradient, and dead and alive trees, in the Northern Jarrah Forest, southwestern Australia.
| Estimate | SE | t-value | p-value | ||
|---|---|---|---|---|---|
| ECM | Minimal | −0.001 22 | 0.000 56 | 2.18 | 0.04 |
| Drought | −0.002 55 | 0.000 69 | 3.72 | 0.001 | |
| Dead | −0.000 91 | 0.000 51 | 1.79 | 0.08 | |
| Ericoid | Minimal | 0.002 52 | 0.0011 | 2.25 | 0.03 |
| Drought | 0.005 21 | 0.0014 | 3.81 | 0.001 | |
| Dead | −0.0021 | 0.0018 | 1.14 | 0.2 | |
| Saprotroph | Minimal | 0.000 541 | 0.0054 | 0.99 | 0.24 |
| Drought | 0.000 593 | 0.000 59 | 1.01 | 0.23 | |
| Dead | −0.002 09 | 0.0018 | 1.14 | 0.2 | |
| AM | Minimal | 0.000 179 | 0.000 96 | 0.19 | 0.39 |
| Drought | 0.001 76 | 0.0011 | 1.62 | 0.11 | |
| Dead | 0.001 68 | 0.0028 | 0.61 | 0.32 | |
| Endophyte | Minimal | −0.000 72 | 0.0026 | 0.27 | 0.38 |
| Drought | 0.000 236 | 0.0027 | 0.09 | 0.39 | |
| Dead | −0.001 52 | 0.0012 | 1.22 | 0.19 | |
| Pathogen | Minimal | 0.000 893 | 0.000 88 | 1.12 | 0.21 |
| Drought | 0.000 754 | 0.000 88 | 0.86 | 0.27 | |
| Dead | 0.000 285 | 0.000 84 | 3.41 | 0.003 |
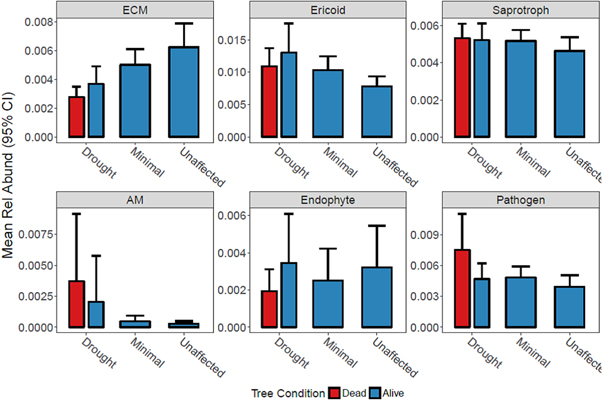
Figure 4. Mean relative abundance of functional groups of fungi from rhizosphere soils along a drought gradient and alive and dead trees in the Northern Jarrah Forest, southwestern Australia. Values are means and 95% CI of ten dead and alive trees inside the drought plots and 20 trees for minimal drought and unaffected plots.
Download figure:
Standard image High-resolution imageWhen considered by functional group and tallied by plot type (drought gradient, tree alive/dead in drought plots), indicator OTUs mirrored changes in relative abundance for saprotrophs and ericoid groups with more OTUs associated with drought plots (dead and alive trees; figure 5), although the relative composition of the indicators did not vary significantly (χ12 = 8.5, p = 0.75). Indicator OTUs were detected in drought plots at roughly 1.5x the rate of minimal or unaffected plots despite being a minority of samples (two sets of N = 10 versus N = 20 for minimal and unaffected). Unique indicator OTUs associated with every plot, and dead and alive trees in the drought plots, likely reflects high diversity and taxon turnover.
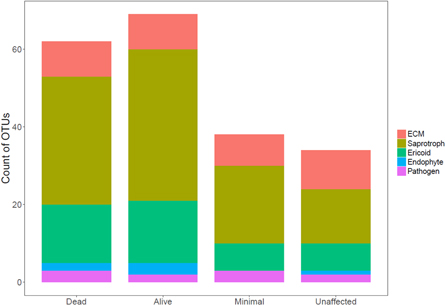
Figure 5. Overall count of indicator operational taxonomic units (OTUs) by their functional assignment in rhizosphere fungal communities along a drought gradient and alive/dead trees in the Northern Jarrah Forest, southwestern Australia. Values represent means for dead (n = 10) and alive (n = 10) trees inside the drought plots and in the minimal drought (n = 20) and unaffected (n = 20) plots.
Download figure:
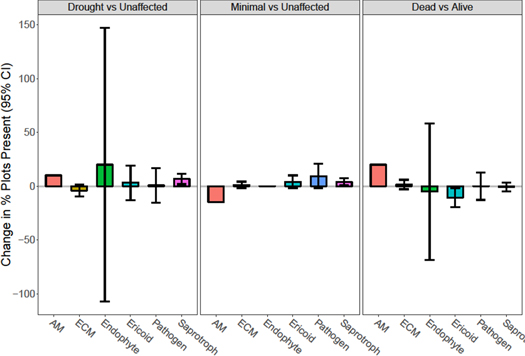
Standard image High-resolution imageChanges in occurrence for the top 200 OTUs largely mirrored that of relative abundance, with most groups having broad overlap of 95% confidence intervals with zero, with the exception being the increase of saprotrophs in drought impacted plots and a decrease of ericoid taxa beneath dead trees (figure 6).
Figure 6. Change in mean occurrence (95% confidence intervals) of functional groups of fungal taxa isolated from soils beneath live trees associated with a drought gradient (drought versus unaffected; minimally affected versus unaffected) and soils beneath dead versus live trees in drought affected plots in the Northern Jarrah Forest, southwestern Australia. Saprotroph frequency increased with drought and ericoid frequency decreased beneath dead trees. Values are means for dead (n = 10) and alive (n = 10) trees inside the drought plots and the minimal drought (n = 20) and unaffected (n = 20) plots.
Download figure:
Standard image High-resolution image
Discussion
Our study has revealed rhizosphere soil beneath forest trees affected by a global-change-type drought was characterised by significantly different fungal community composition and abundance of key functional groups, namely higher levels of AM fungi, saprotrophs, and fewer ECM fungi in drought-affected plots. Shifts in community composition were also present between dead and living trees within drought affected plots, with more saprotrophs and pathogens, and fewer ericoid fungi observed in soil beneath dead trees. These patterns could be explained in a number of different ways: first, drought impacts on forest trees could have caused shifts in rhizosphere communities. Second, the differences in rhizosphere communities may be a result of inherent plot differences. Even though the study plots are a maximum of 70 m apart, drought-affected trees across this forest, such as those found at our study sites, are associated with areas that have lower water holding capacity, rocky outcrops (Brouwers et al 2013) and more xeric areas (Andrew et al 2016). Thus, differences in rhizosphere fungal communities may be due to micro-topographic differences and hence inherent to the plots. Third, the patterns seen could be the result of a combination of drought and micro-topographic effects. If the differences are due to drought-induced tree mortality, these results provide important insights; shifts in fungal communities have implications for ecosystem resistance, resilience and forest-atmospheric feedbacks. This is particularly concerning in regions projected to experience more frequent drought and heat events, and especially where there is a potential for legacy effects (Kaisermann et al 2017, Matusick et al 2018), that is, as biotic resilience of ecosystems is degraded by increasing disturbance frequency.
Changes in fungal communities likely represent a composite of abiotic and biotic processes directly impacting taxa (i.e. temperature, moisture tolerances exceeded versus altered vegetation structure and composition influencing species turnover). This study, allied studies of the same event, and other examples globally, have repeatedly shown significant shifts in forest structure, composition and microclimate resulting from drought and heat (Allen and Breshears 1998, Matusick et al 2016, Ruthrof et al 2018). More specifically, generation of dead stems, loss of canopy cover, elevated bare ground, and decreased litter have been associated with substantial changes in abiotic attributes such as temperature, humidity and wind (Ruthrof et al 2016). If shifts in fungal communities are due to trees affected by drought (and not due to micro-topographic differences, as noted above), these could be associated with changes over short (e.g. sudden flux of litter input from canopy to ground), and longer timescales (e.g. increased light penetration, generation of dead wood and roots and fluxes in carbon pools (Campbell et al 2016). Interactions of abiotic and biotic processes may also be important. For example, a hotter microclimate (more radiation, higher temperature, greater wind) may drive greater soil evaporation rates (physical processes) and lowered decomposition rates (biotic processes) (Breshears 2006, Royer et al 2010). Such interactions are likely to propagate through the soil fungal community with highly variable and xeric microclimates potentially driving fungal composition towards those species possessing greater tolerance to temperature and moisture extremes.
Microbial physiology and community composition can be substantially influenced by drought (Bardgett et al 2008). For instance, soil moisture commonly affects fungal composition and primary limits to productivity (Toberman et al 2008). In our study, although rhizosphere fungal richness was not altered by tree die-off, shifts in community composition were detected with a high turnover between contrasts. For example, in surviving trees, the changes in drought versus unaffected plots had the lowest portion of neutral responses with most OTUs being positive or negative, underscoring high turnover rates. Similarly, in the NMDS, drought impacted samples occupied a much narrower graph space than minimally or unaffected samples, suggesting that the disturbance may have acted as a filter on the fungal rhizosphere community (if the fungal communities were altered by the drought-induced tree mortality, and not only an inherent plot difference). Consistent with this interpretation, an experiment investigating drought impacts on fungal communities reported a significant decline in the abundance of dominant fungal species in heathland soils in a long-term field-scale experiment in Wales, UK (Toberman et al 2008).
Changes in functional group abundance aid in revealing deeper understanding of drought induced forest die-off effects on fungal communities. For example, higher levels of AM, and fewer ECM fungi in drought-affected plots were identified. Failing forest health and changes in overstory cover has been associated with declining ECM elsewhere; for Eucalyptus gomphocephala in southwestern Australia, colonisation of seedling roots by ECM fungi was higher in soil taken from sites with healthy canopies, whereas colonisation by AM fungi dominated roots in soil from sites with declining canopies (Ishaq et al 2013). In a study of drought-induced mortality of Pinus edulis in the western United States, surviving trees from high-mortality sites had a shift in fungal community composition with 50% lower ECM colonisation compared with low-mortality sites (Swaty et al 2004). Indeed, delaying of fungal colonisation of roots has been shown to exert a larger influence on seedling growth than competition (Peay 2018). Further, ECM fungi were found to be associated with higher soil moisture while AM fungi showed no response in Quercus agricolia in California, USA (Querejeta et al 2009). Changes in soil microclimate resulting from declining tree canopies suggests that under drying climate, woodlands in water-limited ecosystems may become increasingly reliant on AM symbiosis over that of ECM. Shifting colonisation from ECM to AM may have implications for seedling recruitment, as lower ECM colonisation at stressful sites could lead to lower levels of fungal inoculum in the soil, resulting in less favourable conditions for seedling establishment, as seen in Quercus suber (Ibanez et al 2015). Although, in our broader examination of recovery of the NJF to the drought and heatwave event (Matusick et al 2016), we found higher levels of regeneration (seedlings and coppice) in drought-affected sites at 16 months following the event. Since the spatial distribution of the seedling-mycorrhiza association responds to the health status of individual adult trees, as supported by Ishaq et al (2018), and if mycorrhizal colonisation affects seedling performance, tree decline in the longer term may influence forest dynamics through shifts in plant–soil biota feedbacks (Ibanez et al 2015). This is certainly an area that requires further research.
In our current study, there was an increase in saprotrophs in dead trees in the drought-affected plots both in relation to relative abundance and OTUs identified by the indicator species analysis, likely owing to increased dead roots in the soil associated with both dead trees and surviving but impacted trees. This also fits with the timeframe of our sampling undertaken three years after the event and allowing sufficient time for response of fungal taxa including saprotrophs. Likewise, Stursova et al (2014), in a study of Picea abies in Central Europe, found that saprotrophs increased and fungal symbionts with tree roots disappeared following forest mortality. Warnock et al (2016), in their study of drought-induced Pinus edulis mortality in the western USA, also provide evidence of shifts from soil fungal communities dominated by biotrophic mycorrhizal fungi, to communities dominated by saprobic organisms via forest mortality. Future work quantifying change over shorter and longer timescales will aid in distinguishing disturbance impacts from longer-term successional change and potential permanent loss of some taxa.
Conclusions
Our study of rhizosphere fungal communities following a drought-induced forest die-off event revealed that fungal richness was not significantly different between trees in drought-affected plots compared with minimally affected and unaffected plots. However, soil beneath trees affected by drought had different fungal community composition and changes in the abundance of key functional groups, namely higher levels of AM and saprotrophs, and fewer ECM mycorrhizal fungi. Fungal communities were also different beneath living and dead plants within the drought-affected sites with more AM fungi, saprotrophs and pathogens, and fewer ECM beneath dead trees found in the drought-affected plots. If the differences in rhizosphere communities seen in our study are due to drought-affected trees, and not due to micro-topographic and inherent plot differences, our results mirror other studies from different ecosystem types across the world, suggesting common global trends in shifts in fungal composition in response to climate change. If such changes in fungal communities are being driven by drought-induced forest die-off, these may have consequences for ecosystem resistance, resilience and stability, which is increasingly concerning in regions that are projected to be hotter and drier in the future. Future studies should disentangle the interaction between drought impacts and micro-topographic effects, examine the effects of repeated die-off events and potential feedback of altered microbial communities on plant community composition, ecosystem processes, and interactions with disturbance events such as fire. This information will be critical to our ability to better predict future ecosystem responses to climate change, both above- and below-ground.
Acknowledgments
The authors thank the Western Australian Department of Biodiversity Conservation and Attractions, specifically Parks and Wildlife Services, Dr Kate Taylor for assistance with DNA extractions, Diane White for assistance with the sequencing, and Dr Christina Birnbaum for constructive comments. The research was conducted within the Western Australian State Centre of Excellence for Climate Change, Woodland and Forest Health, which is a partnership between private industry, community groups, universities and the Government of Western Australia. This research was also supported by a Murdoch University Small Grant, and an Athena Swan Advancement Scheme Kick-Start Science Prize for Dr Anna Hopkins through Edith Cowan University.