

Abstract
Technology deployment policies can play a key role in bringing early-stage energy technologies to the market and reducing their cost along their learning curves. Yet deployment policies may drive unintended and premature lock-in of currently leading technologies. Here we develop an empirically calibrated agent-based model to analyse how deployment policy design influences which technologies are selected by investors. We focus on Germany's solar photovoltaics feed-in tariff policy between 2003 and 2011 and analyse two design features, technology specificity and application specificity. Our results show that both features are highly important in technology selection and that spillover effects between applications exist. Policies that fail to consider these effects can unintendedly lock in or lock out technologies. To avoid this, policymakers can leverage the fact that different technologies are competitive in different applications and, by designing application-specific deployment policies, effectively offer a level playing field for competing technologies.
Export citation and abstract BibTeX RIS

Original content from this work may be used under the terms of the Creative Commons Attribution 3.0 licence. Any further distribution of this work must maintain attribution to the author(s) and the title of the work, journal citation and DOI.
1. Introduction
Climate change mitigation requires a technological transition of our energy systems (IPCC 2014, Erickson et al 2015). Besides carbon pricing and R&D support, technology deployment policies play a central role in inducing such transitions by addressing market failures associated with learning by doing (Sandén and Azar 2005, van Benthem et al 2008, van den Bergh 2013, Bertram et al 2015). Deployment policies have been crucial in triggering capacity additions and thus inducing technological learning and cost reductions, particularly for renewable energy technologies (del Río González 2008, Fouquet and Johansson 2008, Couture and Gagnon 2010, Huenteler et al 2016). Solar photovoltaics (PV), for instance, has experienced a steep increase in global deployment to 300 GW in 2016 (REN21 2017) and a sharp decrease in cost of over 99% in the past four decades (Trancik et al 2015). As a result, today, solar PV is cost competitive with conventional technologies in many markets (Creutzig et al 2017). Technology deployment policies are also important for new technologies necessary for the deep decarbonisation of energy systems, such as battery storage (Trancik 2014, Landry and Gagnon 2015, Malhotra et al 2016).
Yet deployment policies may drive unintended and premature technological lock-in, a situation where one technology is almost exclusively selected at the expense of other technologies (Unruh 2000, Zeppini and van den Bergh 2011, Battke et al 2016). This phenomenon arises from self-reinforcing and path-dependent processes which reduce the cost of the adopted technology, such as economies of scale, learning-by-doing, learning-by-using, and network externalities, and hence give it a sustained advantage over competing technologies (Dosi 1982, David 1985, Arthur 1989, Sandén and Azar 2005, van den Bergh 2008). For novel technologies, the early phase of market deployment is pivotal to drive down their learning curve and thus determining their future competitiveness with other technologies (Hoppmann et al 2013). Lock-in may be undesirable in early-stage technologies for two reasons. First, it can result in long-term inefficiencies (Schmidt et al 2016). These arise from locking out technologies which, though more expensive at the outset, would offer superior learning rates. Thus, long-term economic cost of deployment would be higher because faster learning technologies would not have been deployed in their early stage. As predicting future learning curves of early-stage technologies is difficult, encouraging technological diversity is regarded a viable alternative to achieve long-term economic efficiency (Arthur 1989, Sandén and Azar 2005, del Río González 2008, Schmidt et al 2016). Second, premature technological lock-in, all else equal, inherently reduces long-term diversity and hence the resilience of the energy system against external shocks (van den Bergh et al 2006, Stirling 2010). An example is the carbon lock-in of the current energy system which not only is the main source of climate change but also leaves the economy vulnerable to fossil-fuel price shocks, such as the 1970s oil crises (Unruh 2000, 2002). It is important to note that premature technological lock-in is not per se economically inefficient. In fact, in case the superior technology becomes dominant early on, societal costs are reduced. However, since it is difficult to predict future developments—whether of economic, environmental, or technological nature—it may be preferential to foster competition between different technological choices at least at the outset in order to avoid locking in inferior technologies (van den Bergh 2008, Schmidt et al 2016). In any case, policymakers should be aware of deployment policies' potential consequences in terms of lock-in.
Different modelling approaches have been used in the literature to analyse technology diffusion and lock-in in the energy sector. The spectrum ranges from equation-based models, such as system dynamics models (e.g. Usha Rao and Kishore 2009; Guidolin and Mortarino 2010, Davies and Diaz-Rainey 2011, Islam 2014, Radomes and Arango 2015) to more rule-based approaches, such as agent-based models (e.g. Faber et al 2010, Maya Sopha et al 2011, Rai and Robinson 2013, Rai and Robinson 2015, Robinson and Rai 2015). However, two aspects remain underexplored. On the one hand, the number of ex-post models using empirical data for policy evaluation is scarce (Rai and Henry 2016). On the other hand, the role of deployment policy design (Howlett et al 2015) in locking-in technologies has not yet been explicitly analysed in such models, despite lively debates in the literature suggesting that the policy design is a key factor in inducing technology diffusion and innovation (Dinica 2006, Lipp 2007, Kemp and Pontoglio 2011, Schmidt and Sewerin 2018).
In this article, we address this gap by improving the understanding of how different design features of deployment policies influence which technologies are selected by markets. We do so by analysing the case of Germany's solar PV feed-in tariff (FiT)4 and the selection between the main solar PV technologies, crystalline silicon and thin film. Germany's FiT is widely acknowledged to have been the first and foremost driver of global solar PV deployment in the analysed period between 2003 and 2011 and therefore a key contributor to the substantial decrease in solar PV cost during that period (Peters et al 2012, Trancik et al 2015, Lauber and Jacobsson 2016). The German case thus represents a relatively unique policy experiment with an immense impact on the global energy system. In the absence of alternative cases with similar importance but different policy design, we use an empirically calibrated agent-based model (ABM) to analyse counterfactual policy scenarios, i.e. we model what could have happened had the German policy design been different. For this purpose, we first remodel the historical German case and then analyse how hypothetical alternative policy design scenarios could have changed the selection of PV technologies.
2. Design features of deployment policies
We analyse the influence of two deployment policy design features, technology specificity and application specificity, on technology selection. Here, technology selection is defined as the choice of a particular technology among alternatives by investors. In a market environment, technology selection largely depends on the competitiveness of the different technological options and is closely interrelated to technology diffusion in the way that investors selecting one technology push its increased diffusion.
Technology specificity is the key design feature analysed in the literature about technology selection and lock-in (del Río González 2008, Azar and Sandén 2011, Kalkuhl et al 2012, Lehmann and Gawel 2013, Schmidt et al 2016, Gawel et al 2017, Schmidt and Sewerin 2018). Technology-specific policy instruments directly foster the deployment of an individual technology or groups of technologies (Gawel et al 2017). Importantly, they may be technology-specific to a greater or lesser extent. For example, while most renewable portfolio standards enacted in the US states did not differentiate between renewable energy technologies (Carley 2009, Horner et al 2013, Jenner et al 2013, Wiser et al 2017), the FiT in Germany offered different levels of support for various renewable energy technologies, such as wind or solar PV, but did not make a distinction between different solar PV technologies (Hoppmann et al 2014, Lauber and Jacobsson 2016).
Application specificity is the second analysed design feature and has only recently received attention from policy scholars. It refers to the question of whether a policy differentiates between applications in which multi-purpose technologies can be employed (Battke and Schmidt 2015, Schmidt et al 2016). Examples of multi-purpose technologies include solar PV, which can be used for open-space or rooftop installations, and batteries, which can offer different grid services, such as frequency regulation or grid investment deferral (Battke and Schmidt 2015). In 2004, Germany's solar PV FiT shifted from an application-neutral tariff for all installations to an application-specific system that differentiates not only between open-space and rooftop applications but also between sizes within the rooftop application (Hoppmann et al 2014) (see figure 1 and supplementary note 1 available online at stacks.iop.org/ERL/13/104011/mmedia). This shift provided an opportunity for different users and investors, such as homeowners and professional investors, to enter the market and, together with a large increase in rooftop tariffs, led to a surge in capacity additions (Hoppmann et al 2014).
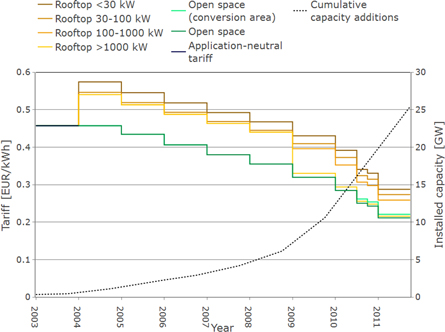
Figure 1. Historical development of the solar PV FiT and total installed capacity in Germany during the analysed period 2003–2011 (Bundesgesetzblatt 2000, 2004, 2008, 2011, BMWi 2016). The tariffs were typically granted for 20 years. At first, the size of installations eligible to receive the FiT was capped. A policy design change in 2004 not only removed the size cap but also paid different tariffs to the two applications, open space (green shades) and rooftop (ochre shades). Installed capacity (dashed line) increased massively after this change, and solar PV therefore progressed along the learning curve. The automatic annual tariff regression of 5% which had been implemented to account for technology cost reductions was exceeded by the solar PV learning rate.
Download figure:
Standard image High-resolution imageIn our study, we operationalise the two design features in the model using the remuneration granted for individual technologies and applications. In other words, we offer different tariffs for the technologies and applications in the case of technology-specific and application-specific policy designs, respectively. Analogously, a neutral policy design corresponds to equal tariffs for all installations.
3. Methods
3.1. The rationale for using agent-based modelling
In this study, we model a system that reproduces the selection and diffusion patterns of solar PV technologies under the actual as well as counterfactual policy designs in Germany from 2003 to 2011. This system is characterised by a large number of decentralised solar PV installations with capacities ranging from a few kW to over one MW and built on rooftops as well as on open space. Different types of investors typically choose different types of installations (Dewald and Truffer 2011): homeowners build small-scale rooftop installations, while professional investors, such as farmers, financial investors and also supermarket chains, opt for larger-scale rooftop and open-space installations. We first calibrate the model with historical data on these investments and then use the number of investment decisions that were taken in the calibration to evaluate the counterfactual policy design scenarios. Thus, the modelled number of installations in other policy scenarios is flexible to diverge from the historical case.
In previous studies, different approaches have been taken to model technology diffusion processes. On the one hand, system dynamic models, such as the Bass-diffusion model, are used to model aggregate diffusion on the basis of a small number of homogeneous representative agents whose adoption decisions are based on the number of previous adopters (Bass 1969, Norton and Bass 1987). However, these diffusion models have been criticised for their lack of predictive and explanatory power since they do not inform about the mechanisms behind the diffusion process and are entirely stylised which is why they cannot be empirically calibrated (Kiesling et al 2012). Additionally, they assume a homogeneous population.
On the other hand, agent-based models distinctly simulate the adoption decision of a number of heterogeneous agents who interact with and are dependent on other agents and, by aggregating them, can simulate macro-level phenomena (Bonabeau 2002, Kiesling et al 2012, Rai and Robinson 2015).
In this study, we use an agent-based model for three main reasons: first, our case consists of a heterogeneous population of investors, whose investment decisions influence future agents in their decision-making. Second, high-resolution bottom-up data on historically-built solar PV installation is available and hence allows for the use of a calibrated and computationally expensive model. Third with the ABM approach, we are not limited to model a fixed number of agents nor a fixed installed capacity, and we can hence keep these parameters as well as the modelled policy outcome variable. Other modelling approaches would not allow for this flexibility which we think is necessary to model the effect of counterfactual policy designs on the technology diffusion across different technologies and applications.
3.2. Agents' characteristics and operationalisation of investment decision
The agents in our model take investment decisions for specific solar PV installations, i.e. they decide whether to invest in an installation and, if so, in which technology. Their decision-making process is based on the net present value (NPV) of the potential installation. The NPV is the sum of the discounted cash flows over the investment's lifetime minus the initial investment (equation (1)) and represents the expected future earnings at today's value. It therefore allows for different investment options, which, in this study, are the two solar PV technologies thin film and crystalline silicon, to be easily compared

where It=0 represents the initial investment, r the discount rate, CFt the net cash flow in year t, and T the duration of the investment. The investment cost depends on the size of the installation and the module and balance-of-system (BOS) prices which we draw from different price curves. More specifically, we use two different module price curves for crystalline silicon and thin film, respectively, and one BOS price curve for all installations (supplementary figures 1(a)–(c)). However, since the size is defined as the installed capacity, BOS prices are increased by 20% for thin film because of its lower efficiency (Fraunhofer ISE 2015) and the resulting need for more BOS equipment. With increasing project size, we assume that the module and BOS prices decrease linearly due to economies of scale (see supplementary figure 1(d)). The annual cash flows correspond to the difference between the revenues from electricity sales and expenses and are represented by equation (2):

where Et is the energy produced by the installation in year t, FiTt the tariff granted in year t for the produced energy, and O&Mt the cost for the operation and maintenance of the installation. Values are based on literature and summarised in supplementary tables 1 and 3. The annually produced energy is determined by the installation's capacity and the number of annual full-load hours.
The agents determine the NPV of a potential installation and hence the investment attractiveness for both technologies and decide whether to invest at all (NPV ≥ 0) and, if so, in which PV technology (maximum NPV).
We consider two types of agents who take investment decisions: small-scale rooftop investors, such as homeowners, and large and medium-scale investors, such as farmers, supermarket chains and financial investors. The agents are differentiated by the type of installation for which an investment decision is taken. Small-scale rooftop investors are considered to invest in rooftop installations with peak capacities up to 30 kW, while large-scale investors are considered to invest in rooftop installations with peak capacities above 30 kW and open-space installations.
The heterogeneity between the agents is modelled by the propensity of the agents for choosing crystalline silicon as opposed to thin film which we assume to be larger for small-scale rooftop investors than for large-scale investors (see supplementary note 2 for the drivers of this propensity). We operationalise the propensity for crystalline silicon by applying a transaction cost parameter which increases the investment cost of thin film compared to crystalline silicon, hence rendering thin film slightly less attractive. The parameter is used to fit the model to the historical data (see section 3.3).
The model aggregates the investment decisions of all agents with an annual resolution.
3.3. Aggregation of investment decisions
The model performs two steps which are executed independently5 . The Calibration Step is used to calibrate the model to simulate historical solar PV diffusion in Germany, and the subsequent Alternative Policy Scenario (APS) Step uses the output of the Calibration Step to analyse how the technology selection changes under the counterfactual FiT design scenarios.
The two steps work in a similar fashion, and each consists of two modules, the Investment Decision Module and the Price Curve Module (figure 2). First, the Investment Decision Module models one year (see (1) in figure 2). It starts with the selection of an installation. An installation is defined by its size (in kW) and application type (rooftop or open space) and hence determines if the agent is a small-scale rooftop investor or a large-scale investor. In the Calibration Step, the installations are picked from a pool of the historically-built installations for the specific year, while in the APS Step, the installations are randomly selected from a distribution based on all historical installations built during the analysed timeframe (see data in supplementary figure 2(a)). This distribution is assumed to proportionally represent the actual surfaces available for solar PV installations in Germany. When the agent has analysed the investment attractiveness of her installation and taken her investment decision, the model moves to the next installation and its corresponding agent. The number of annual investment decisions is defined, in the Calibration Step, by the number of investment decisions necessary to represent all the historical capacity additions of the specific year, and conversely, in the APS Step, by the total number of investment decisions—whether positive or negative—taken for the same year in the Calibration Step (supplementary table 4)6 . Once all the investment decisions of a specific year have been taken (2), the model moves to the Price Curve Module. Here, the annual capacity additions are introduced in the historical price curves for the respective solar PV technology as well as for BOS (3) (supplementary figures 1(a)–(c)), and the module prices and BOS prices are determined for the next year (4). The new prices are then input back in the Investment Decision Module (5) where the next year is modelled7 .
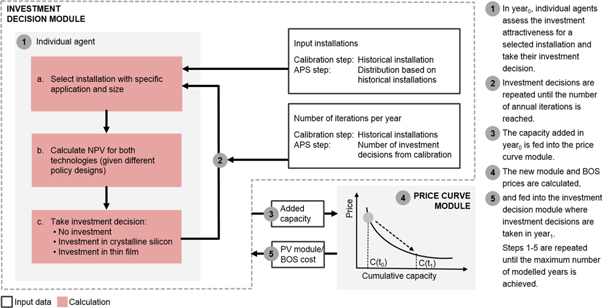
Figure 2. Simplified overview of the model. The consequent steps taken in the model are represented by the numbered bubbles and explained on the right-hand side.
Download figure:
Standard image High-resolution imageThe model output consists of the number of annual installations and their capacity, application as well as solar PV technology. Total annual capacity additions and shares of the two solar PV technologies are obtained by aggregation. The results are fitted to the empirical data by varying the agents' propensity to install crystalline silicon (see section 3.2). More precisely, we run the model with different combinations of the parameters for small-scale investors and large-scale investors, respectively, and then choose the combination with the minimum cumulative square deviation from the historical total annual shares of thin film for the analysis of the different policy scenarios (see supplementary table 2 and supplementary figure 3). The historical total annual shares of thin film and crystalline silicon are derived from different data sources (supplementary figure 2(d)).
3.4. Alternative policy design scenarios
The first step of our analysis remodels the history of Germany's FiT between 2003 and 2011 and hence assesses the influence of past policy design on the selection between the two major PV technologies, thin film and crystalline silicon (see supplementary note 3 for details on the technologies). The thus obtained technology shares were validated in interviews with two German solar PV experts.
In the second step, we analyse technology selection under three hypothetical alternative policy design scenarios using the number of investment decisions from the historical case, all other input data and the model architecture remaining equal. As shown in table 1, the historical case as well as the alternative scenarios vary in their technology specificity and application specificity—that is, their tariff levels differ for specific PV technologies and applications. Since the historical FiT was very generous (Hoppmann et al 2014), we use the lowest historical tariff (i.e. the open-space tariff) as baseline tariff (see data in supplementary table 5). The historical annual tariff reduction of 5% is thus preserved. In the technology-neutral and application-neutral Scenario 1, this baseline tariff is offered to both technologies and applications. In the technology-specific and application-neutral Scenario 2, the baseline tariff is only offered to one technology while the tariff for the other technology is varied and applications are not differentiated. Conversely in the technology-neutral and application-specific Scenario 3, the baseline tariff is only offered to one application while the tariff for the other application is varied and technologies are not differentiated. To assess how the level of the tariff influences the selection of the technology, we vary the tariffs between −15% and +15% of the baseline tariff. This range is selected because historically the rooftop tariffs were, on average, 15% higher than the open-space tariffs.
Table 1. Policy design of the historical case and the alternative scenarios analysed in this study. The columns illustrate if the historical case and scenarios are specific (in dark grey) or neutral (in light grey) in terms of application or technology, as well as which tariff variations are studied in the second step of the modelling process.
| Technology | Application | Variation | |
|---|---|---|---|
| Historical case | Neutral | Specific (higher tariff for rooftop) | — |
| Scenario 1 | Neutral | Neutral | Total tariff ±15% |
| Scenario 2 | Specific | Neutral | Tariff for individual technology ±15% |
| Scenario 3 | Neutral | Specific | Tariff for individual application ±15% |
We assume the input parameters to remain the same for all scenarios (see supplementary note 4 for more details).
4. Results
4.1. Historical case
Figure 3(a) displays the simulated results of the historical case representing the diffusion of the crystalline-silicon and thin-film technologies within the rooftop and open-space applications. The results show that, in the historical case, both PV technologies are selected by investors and neither achieves complete dominance, with crystalline silicon and thin film obtaining total final shares of 87% and 13%, respectively. The selection of technologies between the two applications differs greatly. Crystalline silicon dominates rooftop capacity additions, with a total share exceeding 94% compared to roughly 71% for open-space installations. These differences stem from the smaller size of rooftops and rooftop installations (see supplementary figure 2(a)). Since thin-film installations incur higher BOS costs per installed capacity due to the lower efficiency and these BOS costs make up a higher share of the total investment costs for small-scale installations, crystalline silicon is the more popular choice. The opposite applies to open-space installations. This fact is reflected by the results in figure 3(b) which show that installations smaller than 100 kW are almost entirely dominated by crystalline silicon, whereas more than a quarter of installations larger than 100 kW use thin-film technology.
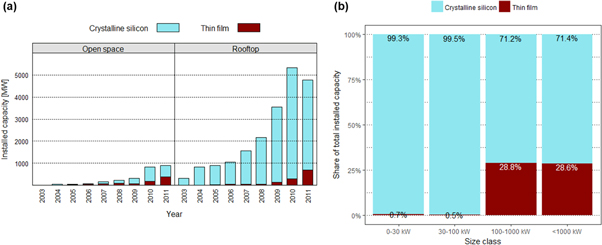
Figure 3. Simulation results of the historical case for (a) the annual diffusion of thin film (in red) and crystalline silicon (in blue) across applications, and (b) the total shares of thin film (in red) and crystalline silicon (in blue) by size class totalled over the entire period. The results were validated by German solar PV experts (see section 3.4).
Download figure:
Standard image High-resolution image4.2. Scenario 1: Technology-neutral, application-neutral policy design
We start by analysing the PV technology-neutral and application-neutral policy design scenario which offers the same baseline tariff to all installations (Scenario 1). Figure 4(a) shows that for this scenario, crystalline silicon is initially utilised, especially in rooftop, but is subsequently replaced and completely dominated by thin film. Increasing the overall tariff by 10% results in the same selection pattern; crystalline silicon is completely replaced by thin film by 2009, but with a 3-times higher overall deployment (figure 4(b)).

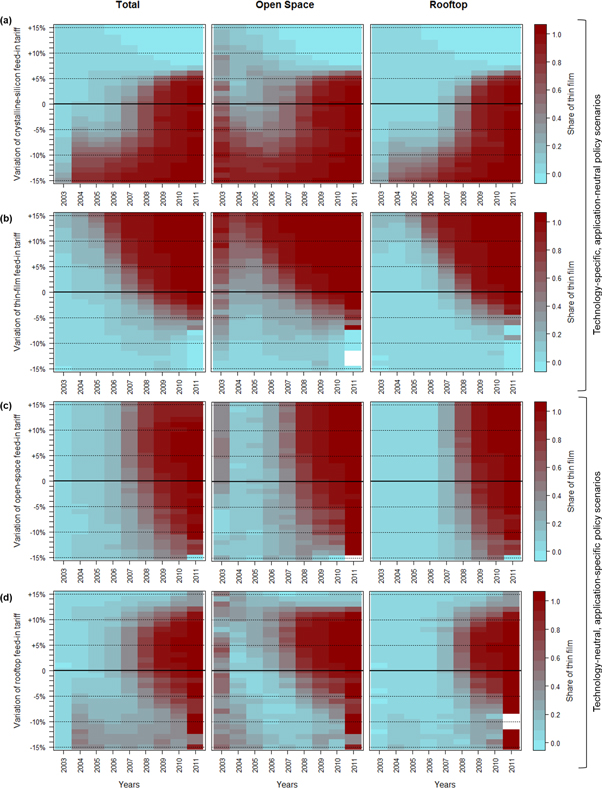
Figure 4. Application-neutral and PV technology-neutral policy design (Scenario 1); (a), (b) Simulation results of PV technology diffusion across applications at the application-neutral and PV technology-neutral baseline tariff and at a 10% higher tariff, respectively; (c) sensitivity analysis indicating the shares of the thin-film PV technology (in red) and crystalline silicon PV technology (in blue) when the baseline tariffs are varied between −15% and +15%. A variation of 0% in the heatmaps corresponds to the baseline tariff for all installations. The results represent the average values of ten different random seed runs. The white areas represent years in which neither of the PV technologies diffused—that is, no installation was built and, hence, no PV technology was selected.
Download figure:
Standard image High-resolution imageFigure 4(c) displays the PV technology shares when the overall tariff varies between −15% and +15% relative to the baseline tariff. The red and blue colours represent a high share of thin film and crystalline silicon, respectively. Tariffs in the range of −3% to +12% of the baseline tariff result in the lock-in of thin film—that is, in the latter years, the share of thin film approaches 1.0. This dominance originates in open space (middle heatmap), is followed by rooftop roughly two years later (right heatmap), and suggests that spillover effects between applications are highly relevant in the analysed diffusion and selection mechanisms. Spillover effects are cost reductions achieved for one business case which also improve another business case. They can occur between technologies but also between applications (Nemet 2012, Battke and Schmidt 2015). In this study, we only focus on spillovers between applications. Tariffs above +13% of the baseline tariff should be interpreted with caution, as they exceed the generosity of the historical tariff, which was used to calibrate our model.
At tariffs below −5% of the overall tariff, no clear pattern is discernible. This outcome is attributable to the very low deployment of both PV technologies in both applications which drops to below 1 GW at a tariff 6% lower than the baseline tariff (see supplementary figure 4). This outcome is also reflected in the empty areas in the heatmaps, which represent years during which no installation is built. Comparing the individual heatmaps of both applications shows that the rooftop market is dominated by one technology while in open space competition between the technologies prevails, i.e. shares between 0.3 and 0.7 are achieved for both technologies. These results suggest that, if competition between the two technologies is the desired outcome, the tariff in a neutral policy design scenario needs to be very low—that is below 3% of the baseline tariff. Yet, as previously mentioned, this option only induces very low technology diffusion.
4.3. Scenario 2: Technology-specific, application-neutral policy design
Figures 5(a) and (b) display the results for Scenario 2 with variations of the tariffs for crystalline silicon (figure 5(a)) and thin film (figure 5(b)). They show that a PV technology-specific but application-neutral policy design induces similar selection patterns of the two applications in that the more supported PV technology becomes dominant and competition between the PV technologies is low (see also overall levels of deployment for the most extreme cases, i.e. +15% and −15%, in supplementary figures 5(a) and (b)). For crystalline silicon, however, this only applies when a tariff differential of at least 7% is implemented because, below 7%, thin film is dominant in the last year of analysis. This level seems to be the price difference that would have been necessary in Germany for crystalline silicon to overcome its generally higher cost. For the individual applications, the selection patterns are similar to the results for the historical case and Scenario 1: at the outset, crystalline silicon dominates rooftop while competition between the two technologies is present in open space before one technology becomes dominant in both applications.
Figure 5. (a), (b) Technology selection patterns under application-neutral, PV technology-specific policy design (Scenario 2) with variation of the (a) thin-film and (b) crystalline-silicon tariff. (c), (d) Technology selection patterns under application-specific, PV technology-neutral policy design (Scenario 3) with variation of the (c) open-space and (d) rooftop tariff. The shares of thin film and crystalline silicon are indicated in red and blue, respectively. In all heatmaps, variation of 0% corresponds to an equal tariff (baseline tariff) for all installations and, therefore, the results at 0% are the same throughout all heatmaps. The results represent the average values of ten different random seed runs. The white areas represent years in which neither of the PV technologies diffused—that is, no installation was built and, hence, no PV technology was selected.
Download figure:
Standard image High-resolution image
4.4. Scenario 3: Technology-neutral, application-specific policy design
Figures 5(c) and (d) display the results for the application-specific but technology-neutral policy design with variations of the tariffs for open space (figure 5(c)) and rooftop (figure 5(d)). They show that varying the open-space tariff while keeping the rooftop tariff constant (figure 5(c)) always results in thin film's dominance and only influences the speed at which this dominance is achieved—that is, how early or late the colour change to red occurs in the figure. This result arises from the fact that the baseline tariff is too low to induce significant capacity additions for the rooftop application and hence does not offer crystalline silicon the same cost reductions as thin film for the open-space application (see overall levels of deployment for the most extreme cases, i.e. +15% and −15%, in Supplementary figures 5(c) and (d)). Conversely, varying the rooftop tariff (figure 5(d)) induces more competition between the technologies and prevents the complete lock-in of thin film at rooftop tariffs that are 13% higher than the open-space tariff. These results do not only correspond to the historical case, where rooftop received, on average, a 15% higher tariff, they also show a remarkable degree of similarity to the results of Scenario 1 (figure 4(c)), suggesting that the diffusion of open-space installations is more influenced by cost reductions from rooftop capacity additions than by increases in the open-space tariff.
4.5. General observations
Generally, for almost any tariff combination, we find that one technology becomes dominant. In most cases, the eventually dominant PV technology is thin film, even though crystalline silicon is initially more economically interesting because of its lower BOS costs and hence a more attractive investment option at the outset of the analysed time period. As for the historical case analysis, spillover effects between applications are the driving force behind thin film's dominance. In the scenario analyses, however, policymakers cannot adjust the policy design throughout the modelled period. This contrasts with the historical case, where policymakers adapted the tariffs in 2010 beyond the 5% annual rate in view of the high module price reductions.
The results show that the relative deployment of crystalline silicon vis-à-vis thin film is decisive in which technology is mainly selected. The more crystalline silicon is selected in the early phase the less likely is a lock-in to thin film. This is because of the initial cost disadvantage for crystalline silicon which needs to be overcome by deploying enough crystalline silicon compared to thin film to push further down its learning curve. This can be reached through higher tariffs for crystalline silicon (figure 5(a) and supplementary figure 5(b)) or for rooftop (figure 5(d) and supplementary figure 5(d)).
5. Discussion and policy implications
Our findings provide general insights on the role of deployment policy design in energy technology selection and offer a qualitative basis to derive policy implications for multi-purpose technologies. We demonstrate not only that technology specificity directly influences technology selection, but also that application specificity is equally important since the competitiveness of technologies varies across applications. The risk of locking-in technologies prematurely may be reduced by supporting a niche application where alternative technologies can thrive and profit from learning feedbacks. In the analysed case, German policymakers managed to break the initial lock-in of crystalline silicon and induce competition by including open-space installations in the support scheme.
The results illustrate that spillover effects between applications are extremely important in the process of technology adoption. Cost reductions attributable to capacity additions in one application can also induce high diffusion in other applications thanks to learning feedbacks in technology-unspecific elements of solar PV installations, such as BOS (Shum and Watanabe 2008). Policymakers can leverage these effects by implementing application-specific policy designs which are more cost-efficient but achieve the same goals as application-neutral designs. This outcome arises from the fact that policymakers may offer higher remuneration to applications that are initially more expensive while supporting other applications to a lesser extent. To achieve the same results, application-neutral policies contrarily need to remunerate all applications equally, thus offering unnecessary revenues to cheaper applications.
Finally, the technology selection dynamics differ between applications. Our analysis shows that dominance by one technology generally occurs in one application first, then spilling over to other applications and, finally, locks in the entire market. This gradual change in competitiveness between technologies leaves policymakers time to react and adapt their policy design if competition between technologies is desired. Note that lock-in might be undesirable not only in the short term in order to avoid potential long-term inefficiencies but also in the long-run because technological diversity increases the resilience of the energy sector against shocks, such as fuel or resource shortages (van den Bergh et al 2006, Stirling 2010). Policymakers, however, need to be aware that supporting several technologies over long periods is not necessarily the most cost-efficient strategy, since the learning rates for different technologies may vary and technologies which prove inefficient in the long term may thus receive unjustified policy support (Azar and Sandén 2011).
Our insights can be extended to other multi-purpose technologies, such as battery storage (Battke and Schmidt 2015, Schmidt et al 2016, Stephan et al 2016). To avoid premature lock-in, policymakers can leverage the fact that different technologies are competitive in different applications and, by designing application-specific deployment policies, effectively offer a level playing field for many technologies (Schmidt et al 2016). Thus, learning effects can be fostered for all early-stage technologies, and the ultimately most efficient technologies may then be selected by markets at a later point. However, our results also show that competition between technologies within and across applications and the risk of ending up with a technological lock-in at the outset need to be understood when designing deployment policies. Dynamic models calibrated with historical data and using predictions of future price developments can thus be used by policymakers to make informed decisions about the design of future technology deployment policies.
We contribute methodologically to the emerging but still scarce number of ex-post models for policy design evaluation (Rai and Henry 2016) and offer a tool to better understand the mechanisms between design elements and technology selection. Yet given the limitations of our modelling approach and case, future research could explore if similar results are achieved when a structurally different model is used or a different policy field is analysed.
Acknowledgments
We gratefully acknowledge the financial support provided by the Swiss National Science Foundation (Project number: PYAPP1_166905). We also would like to thank two German solar PV experts for their expertise, as well as two anonymous reviewers, various participants at IST2017, ICPP 3, and APPAM 2017, and the team of the Energy Politics Group at ETH Zurich for valuable input and feedback on this study. The authors declare no competing financial interests.
Footnotes
- 4
A FiT is a technology deployment policy which offers long-term and cost-covering remuneration per unit of electricity as well as guaranteed grid access to renewable energy (Jacobs 2012).
- 5
The model code as well as the data are available from the corresponding author upon reasonable request.
- 6
The average number of investment decision amounted to 2194 734 decisions over the analysed period.
- 7
Overall, we ran ten different seeds resulting in 5311 255 312 individual model runs for the two-step calibration (each representing one investment decision) and 342 378 452 individual model runs for the analysis of the historical case and the alternative policy scenarios. The output of the ten seeds was averaged.