


Abstract
In order to overcome limitations of climate projections from Global Climate Models (GCMs), such as coarse spatial resolution and biases, in this study, the Statistical Down-Scaling Model (SDSM) is used to downscale daily precipitation and maximum and minimum temperature (T-max and T-min) required by impact assessment models. We focus on East Africa, a region known to be highly vulnerable to climate change and at the same time facing challenges concerning availability and accessibility of climate data. SDSM is first calibrated and validated using observed daily precipitation, (T-max, and T-min) from 214 stations and predictors derived from the reanalysis data of the National Centers for Environmental Prediction. For projection (2006–2100), the same predictors derived from the second generation Canadian Earth System Model (CanESM2) are used. SDSM projections show an increase in precipitation during the short-rain season (October–December) in large parts of the region in the 2020s (2011–2040), 2050s (2041–2070), and 2080s (2071–2100). During the long-rain season (March–May (MAM)) precipitation is expected to increase (up to 680 mm) in Ethiopia, mainly in the western part, and Kenya and decrease (up to −500 mm) in Tanzania in the 2020s, 2050s, and 2080s. However, the western part of Ethiopia will be much drier than the baseline period (1961–1990) during June–September (JJAS) in the 2020s, 2050s, and 2080s, which indicates a shift in precipitation from JJAS to MAM. Annually, precipitation, T-max, and T-min will be higher than during the baseline period throughout the 21 century in large parts of the region. The projection based on SDSM is in line with the direction of CMIP5 GCMs but differs in magnitude, particularly for T-max and T-min. Overall, we conclude that the downscaled data allow for much more fine-scaled adaptation plans and ultimately better management of the impacts of projected climate in basins of Ethiopia, Kenya, and Tanzania.
Export citation and abstract BibTeX RIS

Original content from this work may be used under the terms of the Creative Commons Attribution 3.0 licence. Any further distribution of this work must maintain attribution to the author(s) and the title of the work, journal citation and DOI.
1. Introduction
East Africa is one of the most vulnerable regions in Africa to climate change and variability (McDowell et al 2016) and environmental resources and sectors such as the agriculture and water resources are increasingly threatened by the changes. In this region, the projected climate based on Global Climate Models (GCMs) shows an increase in the frequency of extreme climate events such as floods, droughts, tropical storms, and heavy rainstorms (IPCC 2007, Bates et al 2008, Niang et al 2014) which requires immediate adaptation measures. Mitigation of the possible impacts of the projected changes in climate requires, however, consistent and long-term series of daily weather series with finer spatial resolution than provided by GCMs to drive impact assessment models at local and regional scale. Current climate projections from GCMs provide reliable information to understand the global climate (IPCC 2007, 2013) and support a better understanding of the variability and changes in large-scale climate (Dixon et al 2016). The information from GCMs is, however, spatially too coarse (>100 km) to assess the regional or local scale impact of climate change (Gutmann et al 2012, Meenu et al 2013) and it must be downscaled to finer resolutions (Tavakol-Davani et al 2012). In addition to the coarser resolution, GCMs face large biases and uncertainties in representing the current and future climate and these issues increase at the local scale (Knutti and Sedláček 2013, Joetzjer et al 2013, Lutz et al 2013, 2016), which limits the applicability of GCMs in impact assessment studies at the local scale. Impact and adaptation assessment require, in fact, climate information equivalent to data from field-based meteorological stations parametrized in large-scale climate models (Wilby and Dawson 2004).
To bridge the resolution gap between GCMs and impact assessment models, downscaling techniques have been introduced to synthesize the regional or local scale climate information from GCMs (Coulibaly et al 2005, Wilby and Dawson 2007). Downscaling techniques, dynamical or statistical, are used to transfer changes in large-scale climate variables (predictors) to regional or local scale meteorological variables (predictands). Dynamical downscaling (regional downscaling) is a process used to simulate climate information at high spatial resolution by incorporating local physical factors such as topography. In Africa, regional downscaling is performed by the CORDEX-Africa (http://cordex.org/domains/region-5-africa/), providing climate data with a spatial resolution of 50 km (e.g. Endris et al 2013, Dosio et al 2015). Even though the spatial resolution of dynamical downscaling is higher than provided by GCMs, its applicability in impact assessment studies at a local scale is limited due to the complexity of the models, resources requirements, biases and uncertainties, and sensitivity of the models to the boundary condition of GCMs (Wilby and Dawson 2007, Brown et al 2008, Hamlet et al 2010). Downscaling based on statistical models, on the other hand, requires less processing requirements and computational expenses, making it more effective, simple, and faster than dynamical models.
A basic assumption in statistical downscaling models is that the predictor-predictand relationship remains valid throughout the projection period (Wilby and Dawson 2007). Statistical downscaling synthesizes a daily weather series equivalent to station data which makes it more suitable for impact assessment studies in sectors such as water resource and hydrology (Wilby and Dawson 2007, Brown et al 2008, Khan and Coulibaly 2009). Due to their suitability in impact and adaptation studies, statistical models, particularly regression-based models, have received more attention during the last decades (Tavakol-Davani et al 2012). Finding the statistical relationship between the predictors and predictands is the core aim in statistical models. Based on the statistical approaches used, statistical models are classified under three categories: weather typing (Anandhi et al 2011), stochastic weather generator (Semenov and Barrow 1997), and transfer function (Wilby et al 2002). In weather typing, local meteorological data are grouped in relation to the dominant patterns of atmospheric circulation and scenarios are developed by re-sampling from observed data (Wilby and Dawson 2007, Samadi et al 2011). Downscaling using stochastic and transfer function methods is performed by modifying parameters using weather generators (e.g. LARS-WG) and developing a statistical relationship between predictands and predictors, respectively (Wilby and Dawson 2007).
In this study, Statistical Down-Scaling Model (SDSM), a hybrid of the transfer function and stochastic weather generator, is applied to develop fine-scaled climate projections for East Africa, particularly Ethiopia, Kenya, and Tanzania (supplementary figure: SF. 1 is available online at stacks.iop.org/ERL/14/044031/mmedia). By creating the statistical relationship between the predictors and predictands, SDSM produces ensembles (up to 100) of daily weather variables, required in impact assessment models, under current and future climate scenarios (Wilby and Dawson 2007). We used 26 predictors (1961–2100) and three predictands (precipitation and maximum and minimum temperature (T-max and T-min)) from more than 200 stations to create a station-based and regional (by spatial interpolation) climate projection under the RCP2.6, RCP4.5, and RCP8.5 scenarios. The downscaled data is used to assess changes in seasonal and annual precipitation, T-max, and T-min throughout the 21 century by classifying three climate periods; 202020s (2011–2040), 2050s (2041–2070), and 2080s (2071–2100). Ultimately, the output (regional maps) will help to identify hotspot areas in a detailed manner that could support developing sustainable adaptation strategies in this region. In addition, the output from SDSM allows driving impact assessment models to assess the impacts of the projected climate in different sectors such as in agriculture and hydrology.
2. Datasets
Observed daily precipitation, T-max, and T-min from 332 stations were collected from the National Meteorological Agency (NMA) of Ethiopia and the National Climate Data Centre (NCDC: https://7.ncdc.noaa.gov/) starting from 1954 to 2016. Due to the limited number of ground stations available in this topographically complex region, additional data from remote sensing and reanalysis based daily precipitation and temperature data is used in areas with less or no ground stations. According to Wilby and Dawson (2013), climate products (e.g. remote sensing based precipitation products) with high spatial and temporal resolution can be used for statistical downscaling in remote and data sparse regions. Therefore, for Ethiopia, Kenya, and Tanzania we have in an earlier study (Gebrechorkos et al 2018b) identified such data products to be used for climate and hydrological modelling in areas with less or no ground stations. The products are the Climate Hazards Group InfraRed Precipitation with Station data (CHIRPS, (Funk et al 2015)) for precipitation and Observational-Reanalysis hybrid (Sheffield et al 2006, Chaney et al 2014) for T-max and T-min. CHIRPS (0.05°) and observational reanalysis hybrid (up to 0.1°) are available from the Climate Hazards Group (CHG), UC Santa Barbara (http://chg.geog.ucsb.edu/data/chirps/) and Terrestrial Hydrology Research Group Department of Civil and Environmental Engineering, Princeton University (http://hydrology.princeton.edu), respectively.
In this study, the predictors derived from the reanalysis data (Kalnay et al 1996) of the National Centers for Environmental Prediction (NCEP) and the second generation Canadian Earth System Model (CanESM2) are used for model calibration (1961–1990) and validation (1991–2005) and downscaling of the future projection (2006–2100), respectively (table 1). The spatial resolution of the predictors is available at nearly uniform longitude and latitude of about 2.8125°. For the future climate, projections are provided under the three Representative Concentration Pathways (RCPs): RCP2.6, RCP4.5, and RCP8.5 and are available from the Canadian climate data and scenarios (http://climate-scenarios.canada.ca/). In addition, historical and projected precipitation, T-max, and T-min under the RCPs from 29 GCMs (ST. 1) of the Coupled Model Inter-comparison Project Phase five (CMIP5) are retrieved from the Canadian climate data and scenarios data portal with a spatial resolution of 1° (http://climate-scenarios.canada.ca/).
Table 1. List of the NCEP predictors used for model calibration and validation and their description according to Wilby and Dawson (2007).
| No | Code | Long name | No | Code | Long name |
|---|---|---|---|---|---|
| 1 | mslp | Mean sea level pressure | 14 | p5zh | 500 hPa divergence |
| 2 | p1_f | Surface airflow strength | 15 | p8_f | 850 hPa airflow strength |
| 3 | p1_u | Surface zonal velocity | 16 | p8_u | 850 hPa zonal velocity |
| 4 | p1_v | Surface meridional velocity | 17 | p8_v | 850 hPa meridional velocity |
| 5 | p1_z | Surface vorticity | 18 | p8_z | 850 hPa vorticity |
| 6 | p1th | Surface wind direction | 19 | p850 | 850 hPa geopotential height |
| 7 | p1zh | Surface divergence | 20 | p8th | 850 hPa wind direction |
| 8 | p5_f | 500 hPa airflow strength | 21 | p8zh | 850 hPa divergence |
| 9 | p5_u | 500 hPa zonal velocity | 22 | prcp | Precipitation |
| 10 | p5_v | 500 hPa meridional velocity | 23 | s500 | Specific humidity at 500 hPa |
| 11 | p5_z | 500 hPa vorticity | 24 | s850 | Specific humidity at 850 hPa |
| 12 | p500 | 500 hPa geopotential height | 25 | shum | Surface specific humidity |
| 13 | p5th | 500 hPa wind direction | 26 | temp | Mean temperature at 2 m |
3. Methodology
SDSM uses a multi-linear regression method to develop a statistical relationship between predictors and predictands. The model enables performing multiple processes such as data quality control, screening of predictors, model calibration, and scenario generator (SF. 2). Screening of the predictors is one of the most challenging tasks in SDSM, particularly for precipitation, and the accuracy of the model highly depends on the selected predictors. The selection of a predictor is based on the scatterplots, correlation and partial correlation analysis, and the statistical significance (P < 0.05) of the predictand-predictor relationships. Taking a single predictand (e.g. daily T-max) and screened NCEP predictors (e.g. mslp, p1th, and shum), the model produces up to 100 daily weather ensembles, which are considered to be equally plausible. The weather ensembles are generated by linear regression models and stochastic methods of bias correction (Tavakol-Davani et al 2013). According to Wilby and Dawson (2007), SDSM reduces systematic biases of GCM predictors by normalizing them? with the baseline period. Depending on the length of the available daily data, the model can be calibrated on monthly, seasonal, and annual time scales under conditional (e.g. precipitation) and unconditional process (e.g. T-max and T-min).
The study area is divided into about 37 GCM (CanESM2) grid boxes with a spatial resolution of about 2.8125° (SF. 1). From the 332 stations provided by the NMA of Ethiopia and NCDC, only 152 stations were found suitable for downscaling. Stations with poor quality (e.g. data gaps) and shorter time series during 1961–2005 are not considered to ensure selection of the best fit predictors for a given location. In addition to those 152 stations, we used 62 data points, equivalent to station data, for precipitation and T-max and T-min retrieved from CHIRPS and Observational-Reanalysis hybrid, respectively.
For the 214 stations and three predictands, the model is calibrated (1960–1990) and validated (1991–2005) more than 642 (3*214) times. The 26 predictors are analysed more than 5564 times (214*26) for a single predictand and 16 692 times (214*26*3) for the three predictands used in this study. In addition to the statistical methods for model evaluation available in SDSM, we computed R2 (coefficient of determination) and root mean square error and mean bias to evaluate the accuracy of the model as explained in the supplementary material (SM 1.1). In order to provide regional maps of the future climate, the point information generated by SDSM are spatially interpolated. According to Chai et al (2011), Borges et al (2016) we used the inverse distance weighting to spatially interpolate the downscaled daily precipitation, T-max, and T-min. For ease of statistical analysis, the long-term climate projection is divided into three climate periods; 2020s, 2050s, and 2080s. Further, the results obtained from SDSM for the three climate periods are compared with the output from the CanESM2 and the mean of the CMIP5 GCMs (GCMs) on a regional scale.
4. Results
4.1. Long-term projections
With respect to local impacts of climate variables, seasonal values are much more relevant than yearly values. In large parts of East Africa, the long and short rain seasons are from March–May (MAM) and October–December (OND), respectively. Moreover, June–September (JJAS) is the most important rain season for rain-fed agriculture in the highland parts of the region. January–February (JF) is the driest season in Ethiopia and Kenya, but Tanzania receives a moderate amount of rainfall (Camberlin and Philippon 2002, Daron 2014). The representation of the current climate by SDSM is first assessed by comparing model outputs with data from ground stations (details are provided in the supplementary material). In general, for the stations used in this study the model showed an R2 of greater than 0.95 and 0.8 during calibration and validation (see supplementary material 1.2).
The projections under the three RCPs (RCP26, RCP4.5, and RCP8.5) show a considerable change in climate variables, in particular in seasonal precipitation. In general, differences are more pronounced between seasons and regions, but rather consistent between RCPs and during the projection period. In the 2020s, compared to the baseline period (1961–1990), precipitation during JF will increase (up to 380 mm) in large parts of Tanzania and decrease in Ethiopia and Kenya (figure 1). On the other hand, the MAM precipitation will increase (up to 600 mm) in Ethiopia and the western parts of Kenya while a decrease is projected in large parts of Tanzania (up to −420 mm). In the western parts of Ethiopia, unlike to the change during MAM, precipitation during JJAS is projected to decrease (up to −250 mm). However, in other parts of Ethiopia as well as in Tanzania and Kenya, precipitation during JJAS is projected to increase (up to 400 mm) under the RCPs. During OND, precipitation will increase (up to 200 mm) in large parts of Kenya and Tanzania and the south-eastern parts of Ethiopia. Similar to the projected change in JJAS, precipitation during OND will decrease (up to −280 mm) in the western part of Ethiopia, particularly under RCP2.6.
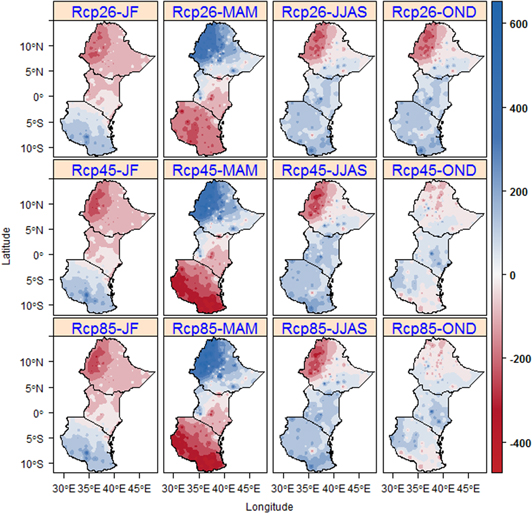
Figure 1. Projected long-term changes in seasonal precipitation (mm) in East Africa in the 2020s (2011–2040) under RCP2.6, RCP4.5, and RCP8.5.
Download figure:
Standard image High-resolution imageSimilar to the 2020s, precipitation in the 2050s (figure 2) and 2080s (figure 3) will continue to increase during MAM (up to 680 mm) in Ethiopia and large parts of Kenya and decrease (up to −500 mm) in Tanzania. Moreover, precipitation during OND will increase in large parts of the region in the 2050s and 2080s. Compared to the 2020s, precipitation in large parts of the region will increase during JF, MAM, JJAS, and OND in the 2050s and 2080s, particularly under RCP8.5. Overall, during the projection period, the western part of Ethiopia will be much wetter than the baseline period during MAM, but it will be drier during JF and JJAS. In addition, Kenya will be wetter than the baseline period during JJAS and OND, but drier during JF and MAM (particularly the eastern and southern parts). Moreover, Tanzania will be drier than the baseline period during MAM, but wetter during JF, JJAS, and OND.

Figure 2. Projected long-term changes in seasonal precipitation (mm) in for East Africa in the 2050s (2041–2070) under RCP2.6, RCP4.5, and RCP8.5.
Download figure:
Standard image High-resolution image
Figure 3. Projected long-term changes in seasonal precipitation (mm) in for East Africa in the 2080s (2071–2100) under RCP2.6, RCP4.5, and RCP8.5.
Download figure:
Standard image High-resolution imageOn an annual basis, large parts of the region will be wetter than the baseline period in the 2020s, 2050s, and 2080s (figure 4). Compared to the other parts of the region, the south-eastern part of Tanzania will be drier in the 2020s, 50, and 2080s, particularly under RCP2.6.
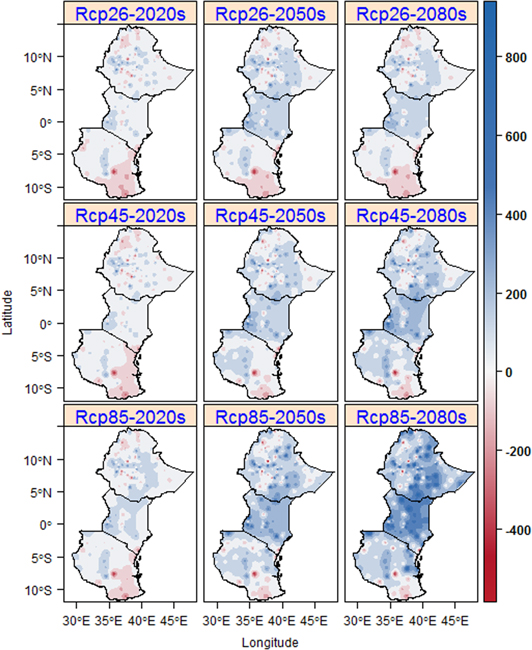
Figure 4. Projected long-term changes in yearly precipitation (mm) in East Africa in 2020s, 2050s, and 2080s under RCP2.6, RCP4.5, and RCP8.5.
Download figure:
Standard image High-resolution imageThe projected change in temperature shows an increase in T-max in large parts of the region in the 2020s, 50, and 2080s under the RCPs (figure 5). In large parts of Ethiopia and Kenya and the northern and south-eastern parts of Tanzania, T-max will increase in the 2020s (up to 1.5 °C), 2050s (up to 3.1 °C) and 2080s (up to 4.3 °C). However, T-max in the western and central-western parts of Tanzania will decrease (up to 1.8 °C) in the 2050s and 2080s. In the 2050s and 2080s, T-max will be warmer under RCP8.5 compared to RCP2.6 and RCP4.5. In addition, the projected decrease in T-max in the western parts of Tanzania is higher under RCP8.5 (up to −1.65 °C) compared to RCP2.6 (up to −0.6 °C) and RCP4.5 (up to −1.2 °C).

Figure 5. Projected long-term average changes in T-max (°C) in East Africa for 2020s, 2050s, and 2080s under RCP2.6, RCP4.5, and RCP8.5.
Download figure:
Standard image High-resolution imageMoreover, T-min will be warmer (up to 6.1 °C) than the baseline period, even in the south-eastern parts of Tanzania, in the 2020s, 2050s, and 2080s under the RCPs (figure 6). Compared to the 2020s (increase up to 1 °C), the change is higher in the 2050s (up to 3 °C) and 2080s (up to 6.1 °C), particularly under RCP8.5. Overall, T-max and T-min will be warmer than the baseline period in this region, particularly in the 2050s and 2080s under RCP8.5.
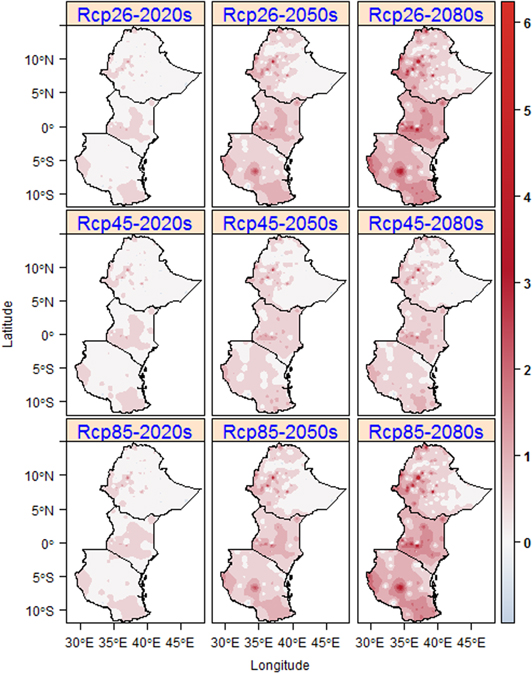
Figure 6. Projected long-term average changes in T-min (°C) in East Africa in the 2020s, 2050s, and 2080s under RCP2.6, RCP4.5, and RCP8.5.
Download figure:
Standard image High-resolution image4.2. Regional average of changes in precipitation and temperature
To compare the output of SDSM with the CanESM2 (used to develop predictors for SDSM) and GCMs the projected change is regionally averaged over Ethiopia, Kenya, and Tanzania. Based on the CanESM2 and GCMs, both T-max and T-min will be warmer than the baseline period in the 2020s, 2050s, and 2080s (figure 7 and ST. 2 and ST. 3), thus showing a similar trend compared to SDSM. However, the extent of projected changes differs substantially. The projected change in T-max and T-min by SDSM, CanESM2, and GCMs will be warmer than the baseline period, particularly under RCP8.5 compared to RCP2.6 and RCP4.6 in Ethiopia, Kenya, and Tanzania.

Figure 7. Projected, spatially averaged, changes in T-max (°C, top panels), T-min (°C, middle panels) and precipitation (mm, bottom panels) in East Africa in the 2020s, 2050s, and 2080s under RCP2.6, RCP4.5, and RCP8.5 based on different climate models (SDSM, CanESM2 and ensemble-means of GCMs).
Download figure:
Standard image High-resolution image
When comparing projections for T-max under RCP2.6, based on SDSM it will increase in the 2020s by 0.24 °C, 0.41 °C, and 0.15 °C in Ethiopia, Kenya, and Tanzania, respectively. The projection based on CanESM2, on the other hand, showed an increase in T-max by 1.18 °C, 0.94 °C, and 1.50 °C in Ethiopia, Kenya, and Tanzania, respectively, which is 2–10 times higher than projections by SDSM. In addition, GCMs show an increase in T-max by 1.1 °C, 1.0 °C, and 1.15 °C in Ethiopia, Kenya, and Tanzania, respectively. Similarly, SDSM shows an increase in T-min in the 2020s (>0.23 °C), 2050s (>0.32 °C), and 2080s (>0.29 °C) in Ethiopia, while projections based on CanESM2 are 7–13 times higher and show that T-min in Ethiopia will increase by >1.85 °C, >2.39 °C, and >3.88 °C in the 2020s, 2050s and 2080s. GCMs show an increase in T-min, which is 3–5 times higher than shown by SDSM, in the 2020s (>1.1 °C), 2050s (>1.16 °C), and 2080s (>1.24 °C) in Ethiopia. In the 2020s, SDSM, CanESM2, and GCMs estimate an increase in T-min in Kenya by more than 0.44 °C, 1.57 °C, and 1.28 °C, respectively. Moreover, SDSM, CanESM2, and GCMs show an increase in T-min in Tanzania by more than 0.30 °C, 1.56 °C, and 1.23 °C, respectively. Overall, the projected change in T-max and T-min is much higher based on CanESM2 and GCMs compared to SDSM in the 2020s, 2050s, and 2080s.
Compared to temperature projections, for precipitation there was no general difference between SDSM and the other climate models. Instead, SDSM values tended to be in between those obtained by CanESM2 (highest estimates) and GCMs (lowest estimates). Based on SDSM (GCMs), precipitation in Ethiopia will increase by more than 40 mm (>18 mm), 84 mm (>26 mm), and 70 mm (>29 mm) in the 2020s, 2050s, and 2080s, respectively (figure 7 and ST. 4). Similarly, in Kenya, SDSM (GCMs) predicts an increase in precipitation by more than 66 mm (40 mm), 144 mm (55 mm), and 129 mm (56 mm) in the 2020s, 2050s, and 2080s, respectively. Compared to Ethiopia and Kenya, the projected increase in precipitation by SDSM and GCMs is lower in Tanzania, particularly in the 2020s. In Tanzania, the projections based on SDSM (GCMs) show an increase in precipitation by more than 13.7 mm (33 mm), 49.6 mm (29.7), and 37.4 mm (29.4 mm) in the 2020s, 2050s, and 2080s, respectively. However, the projected change in precipitation by CanESM2 is much higher than SDSM and GCMs in the 2020s, 2050s, and 2080s. Similar to change in T-max and T-min, the projected change in precipitation is higher in the 2080s compared to the 2020s and 2050s under RCP8.5 than RCP2.6 and RCP4.5.
To identify which models are showing the possible change in the future in this region, the accuracy of the individual models is evaluated based on the current climate by computing the percentage of biases. Therefore, the long-term average (1961–2005) of CanESM2 and GCMs are compared with the long-term average observed T-max and T-min for each station. The result shows that both CanESM2 and GCMs over- and underestimate, with a higher deviation (0.39%–63.04%), T-max and T-min compared to SDSM, which showed a deviation of less than 1% (table 2). As shown in table 2, for example, T-max in three stations of Ethiopia (Bahirdar), Kenya (Nakuru), and Tanzania (Arusha) is over- and underestimated by both CanESM2 and GCMs. In Ethiopia (Bahirdar), T-max is overestimated only slightly by SDSM (0.42%), but much more by CanESM2 (21.1%) and GCMs (14.2%). In Kenya (Nakuru) T-max is underestimated by SDSM (0.33%) and GCMs (2.08%) and overestimated by the CanESM2 (8.41%). Moreover, T-max in Tanzania (Arusha) is underestimated by SDSM (0.08%) and overestimated by CanESM2 (4.42%) and GCMs (0.39%). Similarly, T-min is highly overestimated by CanESM2 and GCMs by more than 59.5%, 31%, and 5.2% in the stations of Ethiopia, Kenya, and Tanzania, respectively (table 2). In general, CanESM2 and GCMs show higher deviations in representing the current climate at a local scale, particularly for T-max and T-min, compared to SDSM.
Table 2. Example of observed and synthesized long-term average daily T-max and T-min for selected stations of Ethiopia, Kenya, and Tanzania based on projections from SDSM, CanESM2, and GCMs. The percentage deviation from the observed data is given in brackets.
| Location | Long-term mean (1961–2005) | |||||||
|---|---|---|---|---|---|---|---|---|
| Stations | Country | Latitude | Longitude | Variable | Observed | SDSM | CanESM2 | GCMs |
| Bahirdar | Ethiopia | 11.60 | 37.32 | T-max | 23.80 | 23.90 (0.42) | 28.82 (21.1) | 27.17 (14.2) |
| T-min | 9.01 | 9.05 (0.44) | 14.69 (63.04) | 14.37 (59.49) | ||||
| Nakuru | Kenya | −0.27 | 36.01 | T-max | 27.36 | 27.27 (−0.33) | 29.66 (8.41) | 26.79 (−2.08) |
| T-min | 10.89 | 10.81 (−0.73) | 14.25 (30.85) | 14.60 (34.07) | ||||
| Arusha | Tanzania | −3.37 | 36.3 | T-max | 25.36 | 25.34 (−0.08) | 26.48 (4.42) | 25.46 (0.39) |
| T-min | 15.15 | 15.18 (0.2) | 16.00 (5.61) | 15.94 (5.21) | ||||
5. Discussion
Regional information, particularly for regions in Africa, is urgently needed considering the projected global warming (Lennard et al 2018) and the required adaptation. Currently, climate change projections are available from GCMs and dynamically downscaled GCMs with a relatively coarse spatial resolution and large biases which makes them unsuitable for being used in impact assessment and adaptation studies at a local scale. Even though many GCMs are available (with a range of biases and uncertainties) in practice a single GCM is typically used for detailed impact assessment studies since considering all GCMs requires enormous computational resources (Lutz et al 2016). From this study, we agree that using a single GCM and finding the best fit predictors during the calibration process, which is the most time-consuming part, particularly for precipitation should be the most feasible approach and represents the key part of the modelling process. Selection of the best fit predictors for a given predictand at a given location, as shown in table 2, enables to accurately synthesize the observed station data. The application of a single GCM for impact assessment studies is common practice (Souvignet et al 2010, Hashmi et al 2011, Mahmood and Babel 2013, Hassan et al 2014, Abbasnia and Toros 2016, Saymohammadi et al 2017, Wang et al 2018). However, as our comparative study (figure 7, table 2) demonstrates, uncertainties of climate projections based on GCMs can be very high (see below).
The results based on SDSM show an increase in T-max (>0.15 °C) and T-min (>0.23 °C) in the 2020s, 2050s, and 2080s and this is in line with current studies based on RCMs (Engelbrecht et al 2015, ICPAC 2016, Osima et al 2018), which showed an increase in T-max and T-min by more than 0.5 °C. The projected change in T-min is higher than for T-max and the overall change will be higher than the change in global mean temperature (IPCC 2014). However, compared to SDSM, the projected change in T-max and T-min by CanESM2 and GCMs is very high. In addition to the high projection in T-max and T-min, both CanESM2 and GCMs showed higher deviation in representing the current climate compared to SDSM (table 2). In addition to the coarse resolution, the weak performance of the CanESM2 and GCMs in representing the current climate, compared to SDSM, could be due to the complex topography of the region and because GCMs provide an area average rather than point information. These models are already showing higher deviation, particularly high overestimation for T-max and T-min, and cannot be expected to be accurate in the future at a local scale as they are designed for large-scale climate and impact assessment studies (Meijl et al 2018). The projected change in T-max and T-min is higher in the 2050s and 2080s, particularly under RCP8.5 and this is due to the expected change in emissions of greenhouse gases (IPCC 2013).
For this particular region, the deviations in temperature projections between SDSM and GCMs are indeed substantial, while they did not systematically differ with regard to precipitation. Based on comparisons between the long-term mean and model results presented in table 2, for example, GCMs overestimated T-max (T-min) at station Bahirdar (Ethiopia) compared to the observed value by 3.37 °C (5.36 °C) but the deviation of SDSM-results were only 0.1 °C. Based on these observations, we consider projections by SDMS to be more reliable than by GCMs. While, based on SDSM, warming should be less severe than expected earlier, evaluating the potential impact requires considering the baseline to which warming adds. For example, in Ethiopia and large parts of Tanzania, projected warming adds to the observed warming trend amounting to up to +1.9 °C in T-max during 1979–2010 (Gebrechorkos et al 2018a). One also has to consider warming patterns and in this regard, besides seasonal differentiation, e.g. the frequency of warm or dry spells duration and warm and cold days and nights is decisive for impacts on agriculture, health and infrastructure (Gebrechorkos et al 2018a). In line with the observed changes, projections show an increase in climate extremes (e.g. in temperature extremes) (Niang et al 2014, Nkemelang et al 2018, Klutse et al 2018, Osima et al 2018).
Based on SDSM, precipitation in the western part of Ethiopia will be much higher than during the baseline period but this part will be much drier during JJAS, one of the most important rain seasons for rain-fed agriculture in the highlands, in the 2020s, 2050s, and 2080s. In line with the projection, using the observed data (1981–2016), precipitation shows an increasing trend during MAM and decreasing trend during JJAS in the western part of Ethiopia. According to Osima et al (2018), the western part of Ethiopia will be drier during JJAS under the 1.5 °C and 2.0 °C global warming levels. Therefore, there seems to be a shift in seasonal rainfall from JJAS towards MAM, particularly during the 2020s. Hence, the observed trends will continue in the 2020s, 2050s, and 2080s: increase in the western parts of Ethiopia and Kenya and decrease in Tanzania and the eastern parts of Kenya during MAM (Lyon and DeWitt 2012, Tierney et al 2015, 2015, Nicholson 2017). Moreover, observed increasing trends in precipitation in large parts of the region during OND (Liebmann et al 2014) will continue to increase in large parts of the region in the 2020s, 2050s, and 2080s.
Overall, the projected decrease during MAM and increase during OND in Kenya and Tanzania are in line with current studies based on RCMs and GCMs (James and Washington 2012, Cook and Vizy 2013, Tierney et al 2015, ICPAC 2016). The projected decline in precipitation during MAM in Kenya and Tanzania is linked with the projected warming of the Indian Ocean (Cooper et al 2013) and the projected changes in climatic conditions of the Congo basin (Cook and Vizy 2013). According to Shongwe et al (2011), the increase in precipitation during OND in large parts of the region is significantly linked with the projected changes in sea surface temperature of the Indian Ocean and Walker circulation in the Eastern Hemisphere. Compared to the baseline period, the western parts of Ethiopia will be drier during JJAS and OND and according to recent studies (Neupane and Cook 2013, Lyon 2014, Souverijns et al 2016), the drying is due to the projected warming of the Gulf of Guinea and changes in the low level of geopotential height. In Tanzania, precipitation during JF will increase in the 2020s, 2050s, and 2080s and this is in line with the observed increasing trend, which was also concluded as a signal of climate change (Dosio and Panitz 2016). In general, precipitation in large parts of the region is projected to be higher than the baseline period throughout the 21 century and this is in line with previous studies based on RCMs and GCMs (Christensen et al 2007, James and Washington 2012, Cooper et al 2013, Engelbrecht et al 2015), which showed an increase, with greater model uncertainties, in precipitation in large parts of the region.
In Africa, compared to the observed data, high biases (associated with local and regional climate processes) in RCMs and GCMs have been demonstrated by (Buontempo et al 2015) and RCMs were considered weak in simulating the current climate (Endris et al 2013, Gebrechorkos et al 2018b). GCMs, the most widely used data source in Africa, poorly resolve local climate forcing such as topography (Lennard et al 2018). Overall, several studies (e.g. Su et al 2012, Engelbrecht et al 2015, Lutz et al 2016) concluded that current projections based on GCMs show very large uncertainties in different parts of the world. Therefore, the downscaled high-resolution climate data can help detect the changes in climate even at a smaller scale (e.g. watersheds) and allow for detailed climate change impact assessment and adaptation studies in sectors such as agriculture and water resources.
6. Summary and conclusion
High-resolution climate data are usually required to facilitate adaptation to the projected change in climate in East Africa, which is one of the most climate vulnerable parts of Africa. The projected climate based on SDSM and GCMs shows an increase in T-max and T-min throughout the 21 century. However, the projection based on CanESM2 and GCMs is much higher than SDSM and both CanESM2 and GCMs showed high deviation (over- and under-estimation) compared to the observed long-term average (1961–2005) T-max and T-min. SDSM, on the contrary, showed higher agreement with T-max and T-min in all the stations used. Based on SDSM, precipitation shows a considerable change, particularly during the seasons, in the 2020s, 2050s, and 2080s in Ethiopia, Kenya, and Tanzania. Precipitation during the long-rain season (MAM) will be higher in the western part of Ethiopia and lower in large parts of Kenya and Tanzania in the 2020s, 2050s, and 2080s under the RCPs. On the other hand, compared to the baseline period, precipitation during JJAS will decrease in the western part of Ethiopia and increase in Kenya and Tanzania. The increase during MAM and decrease during JJAS (throughout the 21 century) and OND (in the 2020s) might indicate a shift in seasonal rainfall in the western part of Ethiopia. In line with the projected change, the observed long-term precipitation (1981–2016) shows an increasing trend during MAM and decreasing trend during JJAS in the western part of Ethiopia. During OND, on the other hand, large parts of the region will be wetter than the baseline period in the 2020s, 2050s, and 2080s under the RCPs. Overall, based on SDSM, average annual precipitation in large parts of the region will be higher than the baseline period in the 2020s and further increases in the 2050s and 2080s. Therefore, the output from SDSM with high spatial resolution can be best used for impact assessment and adaptation studies in sectors such as agriculture and water resource at a local and regional scale in East Africa.
Acknowledgments
We would like to thank the National Meteorological Agency of Ethiopia for providing the observed data and World Meteorological Organization (WMO) for their support in data collection. The online data services of International Research Institute for Climate and Society (IRI; http://iridl.ldeo.columbia.edu/) and National Climate Data Center (NCDC) (https://ncdc.noaa.gov/) were very helpful.