

Abstract
Emissions from the transportation sector are a major contributor to ambient air pollution, the leading environmental health risk factor globally. This study aims to quantify the contribution of tailpipe emissions from global transportation, disaggregated by four sub-sectors, to the global disease burden associated with ambient fine particulate matter (PM2.5) and ground-level ozone in 2010 and 2015. We use the GEOS-Chem global chemical transport model to simulate transportation-attributable PM2.5 and ozone concentrations, combined with epidemiological health impact assessment methods consistent with the Global Burden of Disease 2017 study to estimate the associated burden of disease. We estimate that emissions from the transportation sector were associated with 361 000 (95% CI, 258 000–462 000) PM2.5 and ozone deaths in 2010 and 385 000 (95% CI, 274 000–493 000) in 2015. These results translate into 11.7% of total global ambient PM2.5 and ozone deaths in 2010 and 11.4% in 2015. Together, PM2.5 and ozone concentrations from transportation tailpipe emissions resulted in an estimated 7.8 million years of life lost and approximately $1 trillion (2015 US$) in health damages globally in 2015. Among transportation sub-sectors, on-road diesels contributed most to the health burden from transportation tailpipe emissions in nearly all trade blocs, for both PM2.5 and ozone, though other sub-sectors also contributed substantially (particularly on-road non-diesel vehicles for ozone mortality, and shipping and non-road mobile sources for PM2.5 mortality). These results indicate that despite recent adoption of more stringent vehicle emission regulations in many countries, the transportation sector remains a major contributor to the air pollution disease burden globally. Future work may explore the degree to which currently adopted policies, as well as expected growth in the transportation sector in India, Africa, and other rapidly developing locations, will influence future transportation-attributable public health burdens.
Export citation and abstract BibTeX RIS

Original content from this work may be used under the terms of the Creative Commons Attribution 3.0 licence. Any further distribution of this work must maintain attribution to the author(s) and the title of the work, journal citation and DOI.
1. Introduction
Ambient air pollution is the leading environmental contributor to the global burden of disease. Ambient fine particulate matter (PM2.5) was estimated to be associated with 2.9 million premature deaths in 2017, including from ischemic heart disease, stroke, chronic obstructive pulmonary disease (COPD), lung cancer, lower respiratory infections, and diabetes mellitus type 2 [1]. In addition, ground-level ozone was estimated to be associated with 472 000 premature deaths from COPD. Information about the contribution of each major emission sector to PM2.5 and ozone concentrations and disease burdens can highlight the extent to which mitigating emissions from each sector can improve air quality and public health. Such information can also inform the costs and benefits of technology and policy packages capable of mitigating these impacts in individual countries. Tracking how the impact of each sector changes over time can also demonstrate the influence of changes in source sector activity levels and policies to reduce emissions.
Previous studies consistently estimate that tailpipe emissions from transportation sources, which include on-road vehicles, shipping, and other non-road mobile sources, impose substantial public health damages, particularly in world regions where large populations are co-located with high transportation activity levels and/or lax emission regulations. Estimates of the global mortality burden from transportation emissions range from 165 000 [2] in 2010 to 376 000 in 2005 [3] for mortality attributable to PM2.5 and ozone. Those estimated premature deaths correspond to 5%–10% of global PM2.5 mortality and 16% of global ozone mortality. The percentage of air pollution-related mortality that is attributable to transportation emissions was estimated to be much higher in some regions compared with the global average. Lelieveld et al [2] estimated that land traffic contributes 5% of the global PM2.5 mortality, but up to 20% in Germany and 21% in the United States. Similarly, Silva et al [3] estimated that transportation emissions contributed 32% and 24% of total PM2.5 mortality in North America and Europe, respectively, and 20%–26% of total ozone mortality in North America, South America, Europe, Former Soviet Union, and the Middle East.
Transportation emissions have been changing rapidly around the world, driven by many factors, including economic development (often increasing personal vehicle ownership and freight activity), changes in fuel quality, and introduction of emission controls on vehicles and engines in response to tightening environmental standards. Chambliss et al [4] described the importance of estimating the transportation-attributable disease burden to 'facilitate public health surveillance through the ongoing and systematic collection, analysis and interpretation of sector-specific disease burden.' Here, we provide updated estimates of the air pollution-related health impacts attributable to global transportation tailpipe emissions in 2010 and 2015. Our study builds on previous estimates of the health burden from transportation emissions that report transportation air pollution-related mortality estimates for earlier years. We advance beyond the previous literature in several ways: (1) by focusing on more recent years and comparing 2010 with 2015, we account for changes in transportation emissions resulting from changes in vehicle activity, emission factors, fuel quality, and other factors affecting transportation emissions; (2) we use updated global emissions inventories which account for vehicle emissions under real-world driving conditions [5, 6]; (3) we use updated epidemiologically-derived concentration-response factors consistent with the latest Global Burden of Disease study, which now include more health endpoints (e.g. diabetes) and more epidemiological studies from around the world [7, 8]; (4) we explore health impacts of transportation tailpipe emissions within cities and trade blocs worldwide, whereas previous studies have focused on national, regional, and global scales; and (5) we present results for four transportation sub-sectors, whereas previous studies have focused mainly on the transportation sector as a whole.
2. Methods
We estimated the ambient PM2.5- and ozone-attributable health burden globally from transportation tailpipe emissions globally in 2010 and 2015. We excluded other air pollution-related health impacts of the transportation sector, which include evaporative emissions, emissions from brake and tire wear, and resuspension of road dust. We also excluded injuries and fatalities from vehicle accidents and physical activity health benefits from active transportation.
2.1. Emissions
Emissions for on-road diesel vehicles are from Miller and Jin [6]. These emissions estimates were derived using bottom-up fleet modeling of six diesel vehicle types in 199 countries covering 99.8% of the world population in 2015. Data on vehicle sales, used vehicle imports, stock, mileage, and fuel efficiency are from the International Energy Agency's Mobility Model [9]. Energy consumption estimates were calibrated to match IEA energy balances [10], which were adjusted for some countries using estimates by the London-based consultancy CITAC as reported by Naré and Kamakaté [11] and data from the Joint Organisations Data Initiative [12]. Technology-specific emission factors are from a review of emission factor models such as MOVES [13] and COPERT [14] (figure S1 is available online at stacks.iop.org/ERL/14/094012/mmedia). NOx emission factors for Euro 4 and later diesel cars and light commercial vehicles are from a 2017 review of real-world NOx emissions testing that accounted for the effects of dieselgate and other causes of excess NOx emissions [15]. Region-specific PM emission factor adjustments to account for the effects of high emitters were applied following Klimont et al [5]. Vehicle survival rates were calibrated to align historical estimates of vehicle sales, used imports, and in-use vehicle stock. The distribution of vehicle fleet activity by vehicle age includes mileage degradation rates from the International Council on Clean Transportation's India Emissions Model. Vehicle emissions characteristics were derived using policy information on new vehicle emissions standards [16, 17], used vehicle import restrictions [18, 19], and fuel quality [20]. Emissions for on-road diesel vehicles are spatially allocated according to population and road networks, following Anenberg et al [15].
Spatially allocated emissions for international shipping were obtained from Comer et al [21]. All other anthropogenic emissions were from the gridded ECLIPSE emissions inventory [5, 22], including primary and precursor emissions for ambient PM2.5 and ozone from on-road non-diesel vehicles and non-road mobile sources and all non-transportation sources. The online supplementary material contains more information on emissions and uncertainties.
2.2. Chemical transport modeling
We simulated ambient PM2.5 and ozone concentrations using the GEOS-Chem chemical transport model at the 2° × 2.5° spatial resolution (using the version within the GEOS-Chem adjoint model v35 m, which includes updates to GEOS-Chem up through v9 of the standard forward model). We used assimilated meteorological fields from the NASA Global Modeling and Assimilation Office GEOS-5 product, extending from the surface level up to 0.01 hPa across 47 vertical layers. In addition to the anthropogenic emissions described above, natural emissions included NOx from lightning [23], fertilizer and soils [24], SO2 from dimethyl sulfide and volcanic sources, primary biogenic organic carbonaceous aerosol from MEGAN 2.1 [25], monthly biomass burning from GFEDv3 [26], and natural emissions of NH3 [27]. Tropospheric ozone formation included a HOx-VOC-NOx mechanism, with stratospheric boundary conditions provided by the Global Modeling Initiative as implemented in [28]. Aerosols were treated as an external mixture of primary organic and black carbonaceous aerosols [29], secondary inorganic aerosols [30], natural dust [31], and sea salt [32]. Thermodynamic partitioning of secondary inorganic species was calculated using RPMARES [30]. Atmospheric tracers were removed through wet scavenging [33] and dry deposition [34]. Secondary organic aerosols (e.g. [31]) and anthropogenic dust particles [35] were not treated in this version of the model. Halogen chemistry [36] was not included in this version of the model, which may lead to high modeled ozone biases of up to 10% over land at the surface.
We conducted six 12-month model runs for each of 2010 and 2015 to simulate PM2.5 and ozone concentrations, one base case with all emissions in the model, and five simulations with emissions of the following transportation subsectors zeroed out: (1) on-road diesel vehicles; (2) on-road vehicles of all fuel types; (3) international shipping; (4) non-road sources; and (5) all transportation sources (table S1). To isolate the influence of transportation emission changes, all simulations used the same non-transportation emissions and 2010 meteorology. Interannual meteorological differences can affect estimated concentrations, but we expect that meteorological influences on concentrations would be about 20% or less of annual mean population-weighted surface PM2.5, based on satellite-derived PM2.5 estimates [37].
To capture finer scale co-location of high PM2.5 concentrations and population, within each 2° × 2.5° gridcell, we imposed the 0.1° × 0.1° spatial pattern of surface PM2.5 concentrations from van Donkelaar et al [38], following previous work [15]. Van Donkelaar et al [38] integrated satellite aerosol optical depth with vertical aerosol profiles from a chemical transport model, and then calibrated estimated surface concentrations to ground-based monitors. We directly regridded ozone concentrations to 0.1° × 0.1° degrees since ozone concentrations are more spatially homogenous and previous studies show that the spatial resolution of ozone concentrations does not substantially impact estimated health burdens [39].
We calculated a transportation attributable concentration (TAC) and transportation attributable fraction (TAF) for each pollutant (PM2.5 and ozone), country, source category, and year. TAC is defined as the difference in source-specific concentrations from the zeroed-out scenario compared to the baseline (in units of concentration). TAF is defined as the fractional difference in total mortality from the zeroed-out scenario compared to the baseline (i.e. the percent of total air pollution mortality that is attributable to transportation tailpipe emissions and each transportation subsector). Unlike TAC, TAF is influenced by non-transportation emission sources, since the denominator is total PM2.5- and ozone-attributable mortality, which are affected by many different emission sources.
2.3. Health impact assessment
To estimate health impacts, we used the 'proportional' approach, in which we assumed that the contribution of emissions from each transportation subsector to PM2.5 and ozone mortality was the same as its contribution to PM2.5 and ozone concentrations. We first estimated the burden of disease from total PM2.5 and ozone concentrations in each 0.1° × 0.1° gridcell globally in 2010 and 2015, using methods that are consistent with the Global Burden of Disease 2017 Study (GBD2017). To estimate the transportation-attributable PM2.5 and ozone disease burdens, we multiplied the gridded total PM2.5 and ozone disease burdens by the gridded fraction of total concentration that is attributable to transportation emissions, separately for each pollutant.
To estimate the total PM2.5 disease burden, we used year-specific concentration estimates reported by Shaddick et al [37] (figures S2 and S3) and integrated exposure response (IERs) curves for five year age bands for ischemic heart disease, stroke, COPD, lung cancer, lower respiratory infections, and diabetes from the GBD2017 study [1].
The IER curves take the form:
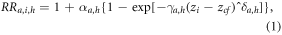
where RR is relative risk in gridcell i for health endpoint h and age group a, z is the PM2.5 concentration in gridcell i, zcf is the counterfactual PM2.5 concentration below which health impacts are not calculated, and α, γ, and δ are model parameters for health endpoint h and age group a. The PM2.5 theoretical minimum exposure level (TMREL), or zcf, was included in the IER parameters and ranged from 2.4–5.9 μg m−3. Following Anenberg et al [15], we obtained 1000 Monte Carlo draws of the IER model parameters (α, γ, δ, and zcf), which we used to generate 1000 RR estimates for each 0.1 μg m−3 PM2.5 step in a lookup table, for each health endpoint and age group. We then applied the mean of the 1000 RR estimates for each health endpoint and age group to the gridcell PM2.5 concentrations to estimate age- and cause-specific premature mortality in each gridcell.
For ozone, we applied the RR for COPD of 1.06 (95% CI, 1.02–1.10) used by the GBD2017 study based on five epidemiological cohorts in Canada, the US, and the UK [1]. We used year-specific six-month average of the 8 h daily maximum concentration estimates reported by Chang et al [40], which fused six chemical transport models and the Tropospheric Ozone Assessment Report ozone monitor database [41] (figures S2 and S3). This ozone dataset was later updated in January 2019 to correct an error that led to ∼25% overestimation of ozone concentrations (figure S4). We continue to report the results based on the original ozone dataset in the main text to be consistent with the GBD2017, and because the updated dataset is for an average of 2008–2014 and has not been produced for 2010 and 2015 specifically. Estimates of transportation-attributable ozone mortality using the updated concentrations are in the supplementary material.
The concentration-response relationship for ozone is:

where RR is relative risk in gridcell i, β is the model parameterized slope of the log-linear relationship between concentration and mortality, and X is the six-month average of the 8 h daily maximum ozone concentration in gridcell i, and Xcf is the counterfactual concentration below which health impacts are not calculated. For ozone, we estimated health impacts only above the midpoint of the uniform distribution of theoretical minimum risk exposure levels (TMREL, or Xcf in equation (2)) used by the GBD2017 Study (32.4 ppb).
We then calculated the PM2.5- and ozone-attributable disease burden within each 0.1° × 0.1° gridcell using the common population attributable fraction (PAF) method:
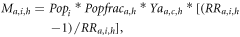
where M is the disease burden (pollutant-attributable deaths or years of life lost) in gridcell i for age group a and health endpoint h, Pop is the population in gridcell i, Popfrac is the population fraction for age group a for health endpoint h, Y is the baseline incidence rate (deaths or years of life lost per 100 000 people) in country c for age group a and health endpoint h. The GBD2017 began using an integrated risk model for ambient PM2.5 and household air pollution to account for overlap between the two, resulting in lower estimates for both risk factors. To be consistent with this new approach, we scaled our gridded PM2.5 burden estimates so that national totals match the GBD2017 national results. This resulted in a 27% reduction in our calculated global total PM2.5-attributable deaths of 3.9 million, for an adjusted global total of 2.9 million.
Country-, cause-, and age-specific baseline disease rates from the GBD2017 study were downloaded from the Global Health Data Exchange [42]. Gridded population estimates were from the GBD2017, which were extrapolated from the Gridded Population of the World Version 4 dataset [43] and regridded from 30 arsecs (0.0083° × 0.0083°) to 0.1° × 0.1°. We used year-specific population and baseline mortality rates to calculate best estimates for year-specific transportation health impacts. For PM2.5 mortality, we calculated 95% confidence intervals using the 2.5th percentile and 97.5th percentile of 1000 Monte Carlo simulations of the IER curves. For ozone mortality, we applied the 2.5th percentile and 97.5 percentile of the RR estimates.
Population and disease rate estimates are uncertain, particularly for developing countries where data availability is often limited. We use population and disease rate estimates from the Institute for Health Metrics and Evaluation (IHME) to be consistent with the GBD, though estimates from the World Health Organization (WHO) and other sources may differ. Transportation-attributable PM2.5 and ozone mortality would scale linearly with different population and disease rate inputs.
See supplementary material and table S2 for valuation methods.
3. Results
We first report estimated impacts of transportation tailpipe emissions on global-scale concentrations (using the TAC metric), premature deaths, and welfare losses. We estimate that in 2015, the global population-weighted TAC for annual average PM2.5 was 3.0 μg m−3, the global TAC for 6 month average of the 8 h daily maximum ozone was 5.6 ppb, and the global TAC for annual average black carbon (BC) was 0.2 μg m−3 (see supplementary material for additional results for BC). Vehicle tailpipe emissions were associated with an estimated 361 000 (95% CI, 258 000–462 000) premature deaths globally in 2010, and 385 000 (95% CI, 274 000–493 000) in 2015 (table 1). Confidence intervals here represent uncertainty in the concentration-response function only (see section 4 for additional detail on other sources of uncertainty). These estimated transportation-attributable health burdens represent 11.7% of global PM2.5- and ozone-attributable deaths in 2010 and 11.4% in 2015. Central estimates of mortality impacts translate into 5.43 deaths per 100 000 people globally in 2010 and 5.38 deaths per 100 000 people in 2015. Global transportation-attributable deaths were associated with an estimated 7.9 million years of life lost (YLL) in 2010, and 7.8 million YLL in 2015 (88% of these from PM2.5). The global welfare loss associated with transportation-attributable deaths was approximately $1 trillion (in 2015 US$) in 2010 and 2015.
Table 1. Global air quality and health impacts of transportation tailpipe emissions in 2010 and 2015. For premature deaths, 95% confidence intervals reflect uncertainty in the relative risk estimate only.
| Measure | Description | Metric | 2010 | 2015 |
|---|---|---|---|---|
| Transportation-attributable concentration (TAC) | How much do tailpipe emissions from transportation sources contribute to global population-weighted air pollutant concentrations? Units: depends on pollutant | Annual average PM2.5 | 2.9 μg m−3 | 3.0 μg−1 m−3 |
| 6 month average of the 8 h daily maximum ozone | 5.5 ppb | 5.6 ppb | ||
| Annual average BC | 0.2 μg m−3 | 0.2 μg m−3 | ||
| Transportation-attributable deaths | How many premature deaths are associated with global transportation attributable concentrations of PM2.5 and ozone? Units: thousands (95% confidence interval) | PM2.5 deaths | 312 (240–386) | 330 (255–408) |
| Ozone deaths | 49 (18–76) | 55 (20–85) | ||
| Total ambient PM2.5 and ozone deaths | 361 (258–462) | 385 (274–493) | ||
| Transportation-attributable fraction (TAF) | What fraction of ambient air pollution deaths are attributable to tailpipe emissions from transportation sources? Units: percent | Transportation share of ambient PM2.5 deaths | 11.9% | 11.6% |
| Transportation share of ambient ozone deaths | 10.4% | 10.7% | ||
| Transportation share of combined ambient PM2.5 and ozone deaths | 11.7% | 11.4% | ||
| Transportation health damages | What is the welfare loss due to global transportation-attributable deaths? Units: 2015 US$ | PM2.5 | $900 billion | $891 billion |
| Ozone | $70 billion | $85 billion | ||
| Total PM2.5 and ozone | $970 billion | $976 billion |
We next explore how the transportation-attributable fraction (TAF) of combined PM2.5 and ozone deaths differ geographically. G20 economies were responsible for 77% of ambient PM2.5 and ozone deaths from all emissions sources and 84% of transportation-attributable deaths (table 2). These impacts were further concentrated in the top four vehicle markets: China, the EU, the US, and India (figure 1). In 2015, these four markets accounted for 70% of global transportation-attributable PM2.5 and ozone deaths but just under half of the global population. China, the EU, the US, and India had total TAFs of 11%, 24%, 19%, and 9% in 2015, respectively (including PM2.5 and ozone contributions). From 2010 to 2015, transportation-attributable deaths declined in the United States, the EU, and Japan in response to tightening environmental standards; in contrast, impacts increased in China, India, and other regions where growth in transportation activity outpaced environmental standards (figures 2 and S5–S6).
Table 2. Air quality and health impacts of transportation tailpipe emissions in G20 economies in 2015. Estimates are rounded to two or three significant figures.
| Region | Ambient PM2.5 and ozone deaths | Transportation health damages | Share of transportation-attributable deaths by subsector | ||||||
|---|---|---|---|---|---|---|---|---|---|
| Transportation-attributable deaths | All emissions sources | Transportation-attributable fraction (%) | Transportation health damages (billion 2015 US$) | As a share of GNI, Atlas method (%) | On-road diesel vehicles | On-road non-diesel vehicles | Non-road mobile sources | International shipping | |
| Argentina | 970 | 16 000 | 6% | 2.1 | 0.38% | 38% | 9% | 38% | 15% |
| Australia | 620 | 4800 | 13% | 6.4 | 0.45% | 36% | 9% | 29% | 25% |
| Brazil | 5700 | 52 000 | 11% | 9.9 | 0.47% | 50% | 7% | 18% | 25% |
| Canada | 1400 | 8700 | 16% | 12 | 0.68% | 37% | 28% | 30% | 5% |
| China | 114 000 | 1 020 000 | 11% | 160 | 1.43% | 34% | 21% | 27% | 18% |
| France | 6400 | 20 000 | 32% | 45 | 1.65% | 66% | 5% | 12% | 18% |
| Germany | 13 000 | 43 000 | 31% | 110 | 2.83% | 66% | 8% | 13% | 14% |
| India | 74 000 | 800 000 | 9% | 20 | 0.96% | 66% | 10% | 19% | 5% |
| Indonesia | 7100 | 54 000 | 13% | 4.2 | 0.47% | 34% | 29% | 10% | 27% |
| Italy | 7800 | 32 000 | 25% | 44 | 2.21% | 66% | 6% | 11% | 17% |
| Japan | 9900 | 52 000 | 19% | 66 | 1.34% | 32% | 13% | 15% | 41% |
| Mexico | 8100 | 36 000 | 23% | 14 | 1.11% | 39% | 31% | 25% | 6% |
| Russian Federation | 13 000 | 104 000 | 13% | 27 | 1.55% | 27% | 21% | 48% | 5% |
| Saudi Arabia | 420 | 8800 | 5% | 1.7 | 0.23% | 55% | 17% | 10% | 18% |
| South Africa | 1400 | 20 000 | 7% | 1.5 | 0.44% | 48% | 24% | 11% | 16% |
| South Korea | 2900 | 18 000 | 16% | 14 | 0.97% | 45% | 18% | 13% | 24% |
| Turkey | 2900 | 41 000 | 7% | 6.0 | 0.64% | 46% | 11% | 19% | 25% |
| United Kingdom | 8400 | 25 000 | 33% | 63 | 2.20% | 46% | 6% | 10% | 38% |
| United States | 22 000 | 115 000 | 19% | 210 | 1.16% | 43% | 28% | 24% | 6% |
| Other EU | 22 000 | 119 000 | 18% | 110 | 1.68% | 58% | 9% | 15% | 19% |
| G20 subtotal | 323 000 | 2 590 000 | 12% | 914 | 1.37% | 47% | 16% | 22% | 15% |
| Global | 385 000 | 3 370 000 | 11% | 976 | 0.72% | 47% | 17% | 21% | 16% |
| G20 share of global | 84% | 77% | 94% | ||||||

Figure 1. National total PM2.5 and ozone mortality that is attributable to transportation emissions in 2015 in major trade blocs globally, using central relative risk estimates. AMU = Arab Maghreb Union (North Africa); ASEAN = Association of Southeast Asian Nations; CARICOM = Caribbean Community; CEMAC = Central African Economic and Monetary Community; CIS = Commonwealth of Independent States; EAC = East African Community; ECOWAS = Economic Community of West African States; EU & EFTA = European Union and European Free Trade Association; GCC = Gulf Cooperation Council; MERCOSUR = Southern Common Market (South America); NAFTA = North American Free Trade Agreement; SAARC = South Asian Association for Regional Cooperation; SADC = Southern African Development Community; SICA = Central American Integration System. Trade bloc assignments for each country can be found in table S3.
Download figure:
Standard image High-resolution image
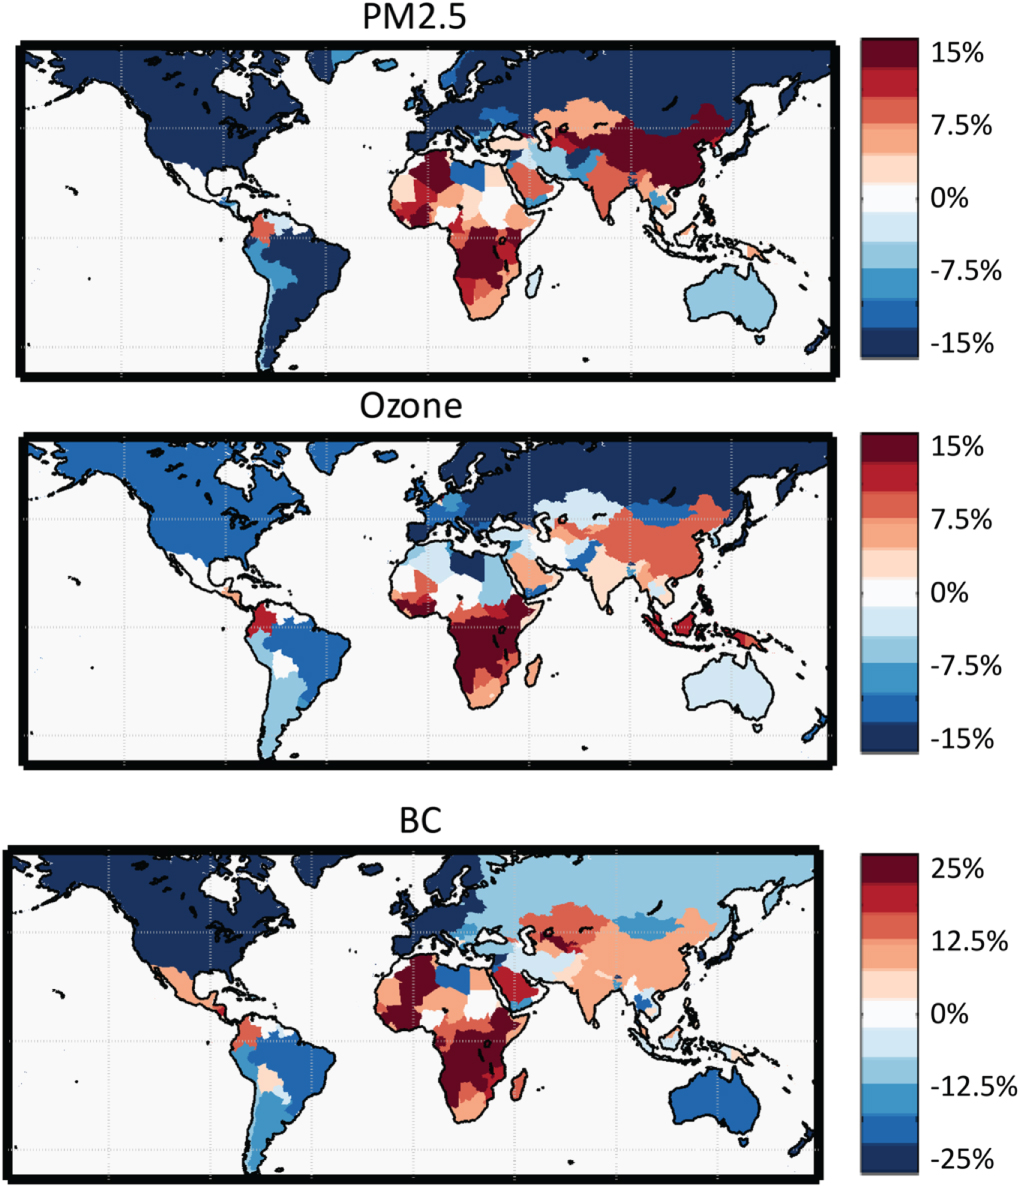
Figure 2. Maps of percent change in national population-weighted average transportation-attributable concentrations from 2010 to 2015 (annual average concentration for PM2.5 and BC, six-month average of the 8 h daily maximum for ozone).
Download figure:
Standard image High-resolution imageWe further assessed this spatial heterogeneity in transportation emissions impacts by trade bloc, as these groups of countries with formal trade agreements have opportunities for coordinated action to harmonize fuel and vehicle emission policies. Considering PM2.5 and ozone together, the trade bloc with the highest TAF was the European Union & European Free Trade Association (EU & EFTA; deaths per 100 000 people=11.9 and TAF = 25%), followed by the North American Free Trade Agreement (NAFTA; deaths per 100 000 = 6.7 and TAF = 20%); figures 3 and S7. Considering PM2.5 and ozone separately, we found that PM2.5 and ozone TAFs exhibited different spatial patterns globally (figure S8). PM2.5 TAFs were highest in the EU & EFTA (27%), while ozone TAFs were highest in the Andean Community (27%). Out of 250 urban areas, those with the highest number of transportation-attributable air pollution deaths were a combination of those with the largest populations and transportation emissions (top 10 in descending order: Guangzhou, Tokyo, Shanghai, Mexico City, Cairo, New Delhi, Moscow, Berlin, London, and Los Angeles (figure 4)). When normalized by population or using the TAF metric, the most impacted urban areas were mainly in Europe (figure 4 and table S4). On-road diesel vehicles contributed most to transportation-attributable air pollution deaths in two-thirds of the urban areas examined (see supplementary material).
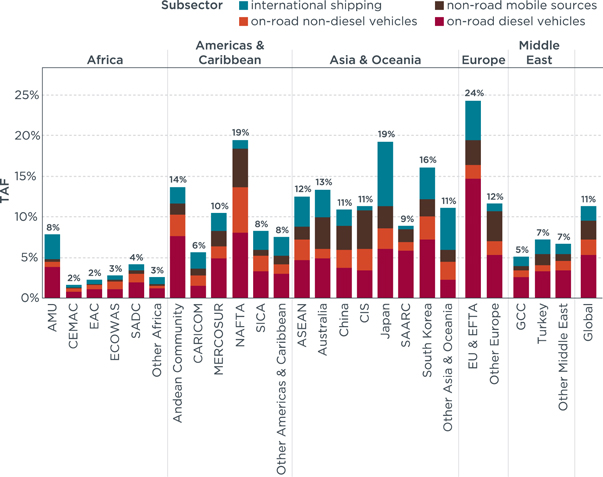
Figure 3. Globally and for each trade bloc, transportation-attributable fractions (TAF) of combined PM2.5 and ozone deaths in 2015, broken out by subsector. AMU = Arab Maghreb Union (North Africa); ASEAN = Association of Southeast Asian Nations; CARICOM = Caribbean Community; CEMAC = Central African Economic and Monetary Community; CIS = Commonwealth of Independent States; EAC = East African Community; ECOWAS = Economic Community of West African States; EU & EFTA = European Union and European Free Trade Association; GCC = Gulf Cooperation Council; MERCOSUR = Southern Common Market (South America); NAFTA = North American Free Trade Agreement; SAARC = South Asian Association for Regional Cooperation; SADC = Southern African Development Community; SICA = Central American Integration System.
Download figure:
Standard image High-resolution image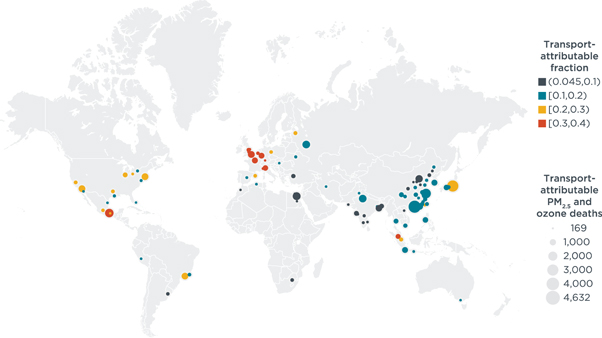
Figure 4. Total number of transportation-attributable PM2.5 and ozone deaths in 2015 by urban area. Bubble size indicates total number of transportation-attributable PM2.5 and ozone deaths using central relative risk estimates. Bubble color indicates transportation-attributable fraction (TAF) of total PM2.5 and ozone deaths.
Download figure:
Standard image High-resolution image
When we examined each transportation subsector individually, we found that diesel engine emissions were the dominant contributor to total transportation-attributable health impacts in 2015 (figure 3). In total, emissions from on-road diesel vehicles, international shipping, and non-road mobile sources (which includes agricultural and construction equipment) contributed 82% to the total TAF globally. On-road diesels were the largest contributor to transportation-attributable PM2.5 and ozone burdens in nearly all trade blocs, accounting for 47% of the transportation burden globally and two-thirds of the transportation-attributable PM2.5 and ozone burden in India, Germany, France, and Italy, where diesels accounted for a high fraction of the in-use car fleets. On-road non-diesel vehicles, which were predominantly gasoline, contributed more to the total transportation-attributable ozone burden compared with PM2.5 for all trade blocs, although this subsector also contributed substantially to the PM2.5 TAF in the NAFTA trade bloc, reflecting the dominance of gasoline vehicles in the US passenger vehicle fleet (figure S7). Shipping and non-road mobile sources were relatively minor contributors to ozone TAFs but together made up more than half of the total combined PM2.5 and ozone TAF in Australia, Japan, and CARICOM region, and more than one-third of the total TAF globally.
4. Discussion
We estimated that from 2010 to 2015, the global fraction of ambient PM2.5 and ozone deaths attributable to transportation tailpipe emissions declined slightly, as did the global rate of transportation-attributable deaths per 100 000 population; in contrast, the absolute number of transportation-attributable deaths increased from 361 000 (95% CI, 258 000–462 000) in 2010 to 385 000 (95% CI, 274 000–493 000) in 2015, at a slightly slower rate than population growth and total ambient PM2.5 and ozone deaths. We found substantial heterogeneity in transportation-attributable health impacts and their trends around the world. While transportation-attributable deaths were greatest in China and SAARC (includes India) trade blocs, the transportation-attributable deaths per 100 000 population were highest in the EU & EFTA and in other European countries. The transportation-attributable fraction of ambient PM2.5 and ozone deaths was highest in the EU & EFTA and NAFTA trade blocs, in part due to their success in reducing non-transport emissions. Among transportation subsectors, on-road diesels contributed most to the health burden from transportation tailpipe emissions in nearly all trade blocs, for both PM2.5 and ozone, though other subsectors also contributed substantially (particularly on-road non-diesel vehicles for ozone mortality, and shipping and non-road mobile sources for PM2.5 mortality).
Our estimates of global transportation-attributable deaths are within the range of estimates reported by previous studies, though towards the upper end (table S3). Chambliss et al [4] estimated 242 000 PM2.5 deaths in 2005; Silva et al [3] estimated 376 000 PM2.5 and ozone deaths from transportation in 2005; and Lelieveld et al [2] estimated 165 000 PM2.5 and ozone deaths in 2010. Our estimated global TAF (11.4%) is also within the range of previous studies: Chambliss et al [4] estimated 8.5% in 2005, Lelieveld et al [2] estimated 5% for land transportation in 2010, and Silva et al [3] estimated 13.8% (of PM2.5 and ozone mortality from anthropogenic emissions only) in 2005. In addition, Weagle et al [44] estimated that transportation contributed 8.6% of total PM2.5 concentrations in 2014. Our finding that TAFs are substantially higher than the global average in Europe and North America is also consistent with these previous studies. Our TAFs for PM2.5 are similar to previous estimates examining contributions of major emission sources in China and India, though slightly lower for China (12% versus 15%) and higher for India (8% versus 6%) [45, 46]. See the supplementary material and table S5 for additional discussion of these differences.
These estimated health impacts associated with the transportation sector are likely underestimated for several reasons. First, air pollution from transportation tailpipe emissions is just one component of the public health impacts of the transportation sector; we have excluded other important health impacts of the sector, including from noise, physical activity effects, road injuries, resuspension of road dust, particles from brake and tire wear, evaporative emissions, and fuel lifecycle emissions. Further research to update and refine global inventories of brake and tire wear would benefit from disaggregated data on vehicle-km by vehicle type, speed, and road surface type. Further research to develop a global inventory of evaporative emissions would benefit from country-specific data on fuel volatility; average vehicle trip length, speed, duration, frequency, and parking time; and real-world VOC emission factors for a wide range of fuel system technologies, vehicle operating patterns, and ambient conditions.
Health impacts from tailpipe emissions specifically may also be underestimated because we considered only the health impacts from PM2.5 and ozone, and excluded direct impacts of other transportation-related pollutants, such as NO2. NO2 is a precursor to PM2.5 and ozone—the effects of which are captured in this study—yet direct exposure to NO2 is also associated with asthma incidence among children worldwide [47–49] and asthma emergency department visits [48, 50–52], which were not assessed in this study. Transportation is the largest source of NO2 concentrations, and health effects may be particularly pronounced in cities, which can have very high NO2 concentrations [53, 54]. Finally, our PM2.5 health risk modeling may underestimate impacts because recent evidence indicates that the health response to air pollution could continue relatively linearly at extremely high concentrations rather than flattening out [7]. For example, our estimates of global transportation-attributable mortality from PM2.5 could approximately double if we used an updated PM2.5 concentration-response curve for mortality that includes only epidemiological studies from ambient air pollution (as opposed to ambient air pollution, household air pollution, environmental tobacco smoke, and active smoking) and all non-accidental mortality (as opposed to only stroke, ischemic heart disease, lung cancer, chronic obstructive pulmonary disease, lower respiratory infections, and diabetes) [7]. In addition, recent evidence indicates that considering only the six diseases currently included in the GBD2017 study excludes other diseases that may also be associated with air pollution, including asthma [47, 48], chronic kidney disease [55], preterm birth and other birth outcomes [56], and cognitive decline [57]. Finally, the 0.1° × 0.1° resolution used for our analysis may be too coarse to capture co-location of high pollutant concentrations and population densities. It is also too coarse to capture near-roadway gradients of PM2.5 and ozone.
While we used established methods that are commonly applied to estimate health impacts of air pollution on a global scale, our results are subject to several uncertainties that could influence our results. Transportation-attributable air pollution mortality results are influenced by estimates of emissions, pollutant concentrations, population, and disease rates (figure S9). In any assessment of air pollution health impacts, there are uncertainties at each analytical step, including characterizing emissions, pollutant concentrations, and associated health impacts. The most influential uncertainty is likely from the choice of the health impact function. There are also important uncertainties in the magnitude and spatial distribution of transportation emissions, the ability of our chemical transport modeling to capture atmospheric chemistry processes occurring at urban scales, and the representativeness of the epidemiological concentration-response functions for all pollution mixtures and all populations globally, among others. The direction in which these uncertainties would influence results is unknown.
5. Conclusion
Our results point to the need for reducing emissions from the transportation sector to be a central element of management plans aimed at reducing ambient air pollution and its burden on public health. Since the timeframe for our analysis is 2010 and 2015, it does not capture the projected changes in transportation emissions impacts from factors in more recent years, including the adoption and continued implementation of world-class standards, declining diesel market shares among LDVs in Europe and India, and growing uptake of vehicles with zero-tailpipe emissions. Future work therefore can continue to monitor the changes in health impacts associated with transportation-sector emissions associated with these policies. Future work may also address the additional co-benefits, such as from more physical activity and fewer greenhouse gas emissions, from increased access to active transportation and public transportation.
Acknowledgments
We are grateful to Bianca Bianchi Alves, Michael Brauer, Thiago Hérick de Sá, Reto Thönen, and Joseph Spadaro for their insights and constructive feedback. We appreciate assistance from Casey Kalman on the city-level disease burden estimates. We thank the Institute for Health Metrics and Evaluation and the developers of the ECLIPSE emissions inventory for making their data publicly available. We also thank Kai-Lan Chang, Jason West, and Owen Cooper for sharing and assistance with the ozone dataset. S A and D H were supported by the International Council on Clean Transportation through a project sponsored by the Climate and Clean Air Coalition to Reduce Short-Lived Climate Pollutants and its Initiative on Reducing Emissions from Heavy-Duty Vehicles and Fuels. This paper extends the information and analyses in the final report from that project, which is available at: https://theicct.org/publications/health-impacts-transport-emissions-2010–2015. Specifically, this paper provides results for new ozone mortality calculations, transportation-attributable air pollution mortality for 150 more urban areas, and breakdown of transportation-attributable air pollution mortality by transportation sub-sector for all 250 urban areas.
Data availability statement
Any data that support the findings of this study are included within the article.