

Abstract
Although tropical forests harbour most of the terrestrial carbon and biological diversity on Earth they continue to be deforested or degraded at high rates. In Amazonia, the largest tropical forest on Earth, a sixth of the remaining natural forests is formally dedicated to timber extraction through selective logging. Reconciling timber extraction with the provision of other ecosystem services (ES) remains a major challenge for forest managers and policy-makers. This study applies a spatial optimisation of logging in Amazonian production forests to analyse potential trade-offs between timber extraction and recovery, carbon storage, and biodiversity conservation. Current logging regulations with unique cutting cycles result in sub-optimal ES-use efficiency. Long-term timber provision would require the adoption of a land-sharing strategy that involves extensive low-intensity logging, although high transport and road-building costs might make this approach economically unattractive. By contrast, retention of carbon and biodiversity would be enhanced by a land-sparing strategy restricting high-intensive logging to designated areas such as the outer fringes of the region. Depending on management goals and societal demands, either choice will substantially influence the future of Amazonian forests. Overall, our results highlight the need for revaluation of current logging regulations and regional cooperation among Amazonian countries to enhance coherent and trans-boundary forest management.
Export citation and abstract BibTeX RIS

Original content from this work may be used under the terms of the Creative Commons Attribution 3.0 licence. Any further distribution of this work must maintain attribution to the author(s) and the title of the work, journal citation and DOI.
Introduction
By storing about 30% of the Earth's terrestrial carbon [1] and half of the world's biodiversity [2], regulating hydrological cycles [3], and furnishing a wide range of timber and non-timber goods, tropical forests are critical for human welfare and climate-change mitigation. These benefits notwithstanding, tropical forests are being converted into cropland at a higher-than-ever rate (1.1 Mkm2 between 2000 and 2012 [4]) and are facing increasing pressure from other human activities [5]. One established way to counter tropical forest loss is to create restricted access protected areas, but this simple dichotomy (protected or not) poorly reflects the wide gradient of forest uses and their effects (e.g. [6, 7]).
In the tropics, nearly 40% of the sawn wood traded annually is harvested from natural forests [8]. Brazil is among the largest producers of tropical round wood, with 14–28 million m3 (25%–50% of its total log production) annually harvested from Amazonian natural forests, mainly for local markets [9, 10]. Selective logging is the dominant harvesting system in the region, consisting in felling only a few commercial trees (1–5 trees ha−1, around 5–30 m3 ha−1 of timber) in the forest. Because most of the forest cover remains after the harvest, selectively logged forests still maintain most of their initial carbon stocks, biodiversity, and other conservation values [11]. Recovery of what is lost depends on logging practices, intensity, and the elapsed time before the next harvest [12, 13]. For this reason, arguments are made for the integration of selectively logged forests into forest conservation schemes [14].
Although recognition of the value of production forests in providing a diversity of ecosystem services (ES) is increasing, most conservation programs and payments for ES schemes focus on a single ES (e.g. carbon in REDD+ programs [15]). Very few studies have addressed multi-criteria decision-making process regarding the optimisation of ES provision in tropical forests, even though some trade-offs might exist between ESs, e.g. timber production, carbon retention [16] or biodiversity conservation [17]. Integrating several ESs in one unique framework is thus essential to account for the multi-functionality and complexity of forests [18].
Plot-level studies provide useful insights for local forest managers, but conservation-related policies need to be informed by broader-scale assessments that account for infrastructure planning, location of protected areas, and logging regulations [19]. In addition, since ES provisioning varies across space (e.g. carbon stocks [20]), logging rules should also vary spatially to optimise ES provisioning, and complex spatial patterns are expected to emerge when plot-level information is scaled up [21]. Nevertheless, current country-wide logging regulations are typically based on results from local plot-level studies. For example, minimum cutting cycles (i.e. years between logging events) are set at 20 years in Bolivia and Peru [22], 25–35 years in Brazil [23], and 65 years in French Guiana [24]. There is thus a need to provide policymakers with regional assessments of ES trade-offs in Amazonian production forests, to develop spatially-explicit forest management rules that optimise multiple ESs based on local ecological specificities.
Here we explore optimal scenarios for ES provision in Amazonian production forests in a spatially explicit framework. We analyse the effect of different logging intensities (i.e. no logging and logging at intensities of 10, 20, and 30 m3 ha−1) and cutting cycles (15, 30, and 65 years) on three ES, i.e. post-logging timber recovery, carbon storage, and biodiversity conservation (as support of ecosystem functioning [25]). Our main research questions are: (i) where, how much, and how often should timber harvests occur to optimise ES provision in Amazonian production forests; (ii) how do ES prioritisation and availability of production forest areas affect optimal logging configuration and resulting ES provision, and (iii) how might projected changes in high-quality timber demand affect forest management and ES provision?
We explore eight management strategies (table 1) and identify the spatial logging configuration that optimises ES provision over the first cutting cycle, given a timber extraction objective of 30 Mm3 yr−1, equivalent to timber extraction rates in the region [26]. Strategies differ in terms of (i) ES prioritisation, (ii) total forest area allocated to selective logging, (iii) whether total timber stocks must fully recover (i.e. sustained timber yields (STY) objective), and (iv) whether a unique cutting cycle length is applied (30 years). We then compare the optimal spatial logging configurations and ES provisions associated with each strategy. Finally, we analyse the consequences of changing the timber extraction objective on ES provision.
Table 1. Strategies tested in this study. ES prioritisation refers to the weights given to ES in the optimisation process: either only one ES (timber, carbon or biodiversity) is optimised, or weights are balanced between timber recovery, carbon retention and biodiversity conservation. Potential production forests (PPFs) are areas that can be logged in a given strategy: accessible unprotected forests (AUFs) are areas that have >90% forest cover, are not protected and are within 25 km of an existing road (figure 1); remote unprotected forests (RUFs) are areas with >90% forest cover outside protected areas and >25 km from a road. Two optional constraints can be added: STY (sustained timber yields) requires that the total timber stocks are recovered in all logged grid cells whereas the 30 year cycle constraint allows only 30 year cutting cycles (MCC strategy).
| Acronym | Strategy | ES prioritisation | PPF | STY | |
|---|---|---|---|---|---|
| 1 | Timber | Maximise timber recovery | Timber | AUF | No |
| 2 | Carbon | Climate change mitigation | Carbon | AUF | No |
| 3 | Biodiversity | Biodiversity conservation | Biodiversity | AUF | No |
| 4 | Balanced | Multi-functionality | Balanced | AUF | No |
| 5 | MCC | Only Medium (30 year) Cutting Cycles allowed | Balanced | AUF | No |
| 6 | STY | Sustained timber yields | Balanced | AUF | Yes |
| 7 | Increased accessibility | Building roads to access remote areas | Balanced | AUF + RUF | No |
| 8 | STY + Increased accessibility | Sustained timber yields with increased accessibility | Balanced | AUF + RUF | Yes |
Materials and methods
Study region
The study region is the Amazon region, located in tropical South America and straddling nine countries (Brazil, Bolivia, Colombia, Equator, French Guiana, Guyana, Peru, Suriname, and Venezuela). Amazonia is the most diverse and carbon-rich tropical biome on Earth [2, 20] with around 600 Mha of tropical rainforest of which 400 Mha is considered 'intact' (i.e. no detectable human impacts; [27]). To date, 33% of Amazonian forests are under legal protection [28] (figure 1). However, since the 1970s and the opening of the Trans-Amazonian highway—the first highway built deep inside the forest—20% of the original forest extent has been replaced mainly by pastures and, more recently, soybean crops [29, 30]. Despite the recent roads, a large portion of the forest biome is at a great distance from any road and thus inaccessible to most commercial activities (figure 1).
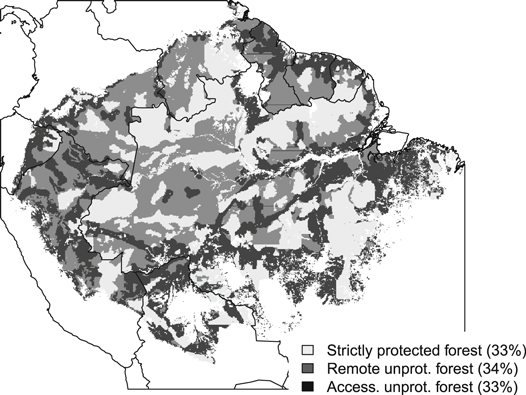
Figure 1. Availability of Amazonian forests for logging (forest cover >90%). Strictly protected areas (light grey; does not include category VI of the IUCN) are not included in our analysis. Forests <25 km and >25 km from any road (accessible and remote unprotected forests) are depicted in dark and medium grey, respectively. Some roads are only accessible by the river network, which results in some isolated AUFs surrounded by RUFs. Strictly protected forests cover 191 Mha, remote unprotected forests 195 Mha (RUFs) and accessible unprotected forests (AUFs) 190 Mha.
Download figure:
Standard image High-resolution imageTimber extraction through selective logging is the dominant forest use in the region [23]. About 14% of Amazonian forests are designated for timber production [31]. Estimates of annual sawlog extraction in these forests are around 30 Mm3 [26], but some results suggest that timber extraction in the Brazilian Amazon has decreased during the last decade [9]. This decrease is likely due to a combination of the Brazilian government's fight against deforestation [32] and the progressive substitution of tropical timber with other cheaper materials in construction [9].
Optimisation framework
The optimisation procedure finds the best spatial configuration of selective logging in Amazonia, which we divided into 556 1° cells (i.e. the coarsest resolution of input maps). In each grid cell, the potential production forest (PPF) area (i.e. the area used in the optimisation framework) is defined either as the area of accessible unprotected forests (AUFs) or as the area of all AUFs and remote unprotected forests (RUFs) (figure 1), depending on the management strategy (table 1); further information is provided in section 'PPF area', and figure S3.
To reflect the range of logging practices currently used in the region, grid cells can be allocated to one of the following logging types: a logging intensity of 10 (Low), 20 (Medium) or 30 (High) m3 ha−1, and a cutting cycle length of 15 (Short), 30 (Medium) or 65 (Long) years, or no Logging. Medium intensity and cutting cycle length correspond to current median logging practices in Amazonia [23]. The spatial optimisation seeks the most efficient spatial configuration of logging rules (cutting cycles and logging intensities) that maximises an ES provision function (defined in section 'ES prioritisation') under pre-defined objectives.
The pre-defined objectives always include (1) an annual timber extraction objective (figure 2): the optimal solution must include enough harvested areas to meet the extraction objective; and (2) an intact-forests objective that consists of conserving intact forest landscapes (IFLs), defined as forests with no detectable sign of human activity [27]. IFLs are irreplaceable for biodiversity conservation [7], especially for species that are highly sensitive to forest degradation. Because Amazonian forests have high levels of endemism and all regions are not equivalent in terms of species composition, we defined the biodiversity conservation objective as follows: in each of the six ecoregions (according to ter Steege et al [33]), namely the Guiana Shield, eastern Amazon, southeastern Amazon, central Amazon, southwestern Amazon, and northwestern Amazon, at least 80% of IFLs are to remain unlogged (equation (3)). Those include forests in protected areas, inaccessible forests (>25 km from a road or track), or forests inside grid cells allocated to the 'No Logging' type.
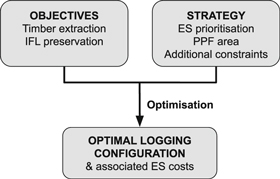
Figure 2. Spatial optimisation steps. Depending on the scenario, PPFs are either accessible unprotected forests (AUFs), or all unprotected forests, i.e. AUFs and remote unprotected forests (RUFs). IFLs are intact forest landscapes [27]. The eight strategies tested are summarised in table 1.
Download figure:
Standard image High-resolution imageIn some cases, an additional STY objective can be added, that consists of recovering as much timber as was initially harvested (equation (4)).
The optimisation problem is defined as:

subject to (i) a timber extraction objective P:

and subject to (ii) an intact-forest-landscape objective:
and, if included in the management strategy, subject to (iii) a STY objective:
where areap is the PPF area in grid cell p, either AUFs or AUFs and RUFs (table 1), further described in section 'PPF area'. ESp,z is the ES provision change when allocating cell p to logging type z, relative to the ES provision when allocating cell p to logging type z = 0 (i.e. no logging): the calculation of this ES provision function is further described in paragraph 'ES prioritisation'. xp,z = 1 when cell p is allocated to logging type z, and xp,z = 0 otherwise. vextz and trotz are respectively the logging intensity (10, 20 or 30 m3 ha−1) and cutting cycle length (15, 30 or 65 years) associated to logging type z. R is the ecoregion (6 ecoregions in total) according to ter Steege et al [33]. IFLp is the total area of IFLs in grid cell p, based on data from Potapov et al [27]. Trecp,z is the amount of timber recovered in grid cell p after logging during the cutting cycle duration under logging type z, calculated with a previously developed volume recovery model calibrated at the Amazonian scale [34] (see paragraph 'ES prioritisation').
The optimal spatial configuration for each strategy is found with integer linear programming using a methodology adapted from the optimisation software Marxan with Zones [35, 36], using the package prioritzr [37] developed in R programming language [38]. Codes and data are available at https://doi.org/10.6084/m9.figshare.8153777.
It should be noted that, contrary to many conservation planning studies, we did not include the connectivity of protected areas in the optimisation process. In our case, the total area of one grid cell is around 11 000 km2. At this scale, the additional benefit of connected grid cells is difficult to quantify and interpret, although connectivity also has implications at large landscape scales.
Strategy description
We tested different strategies to meet future timber demand in Amazonia (table 1): (1) Timber: only timber recovery is maximised to ensure long-term timber stocks, (2) Carbon: only carbon is maximised as a climate change mitigation strategy, (3) Biodiversity: only biodiversity is maximised as a conservation strategy, (4) Balanced: timber recovery, carbon and biodiversity conservation are balanced as a multi-functionality strategy, (5) MCC: balanced ES prioritisation under Medium (30 year) Cutting Cycles only, similar to current management strategies imposing nation-wide minimum cutting cycle, (6) STY : balanced ES prioritisation with a STY objective, i.e. the volume of timber extracted must be recovered at the end of the first cutting cycle. In scenarios (1)–(6), PPFs are restricted to AUFs (table 1). Two additional scenarios also include RUFs in the PPF area: (7) Increased accessibility: balanced ES prioritisation when all unprotected forests (AUFs and RUFs) are made accessible, and (8) STY + Increased accessibility: balanced ES prioritisation with a STY objective when all unprotected forests (AUFs and RUFs) are made accessible. The annual timber extraction objective is first set to 30 Mm3 (figures 3 and 4); the effects of changing the timber extraction objective are then tested with objectives between 10 and 80 Mm3 yr−1 (figure 5).
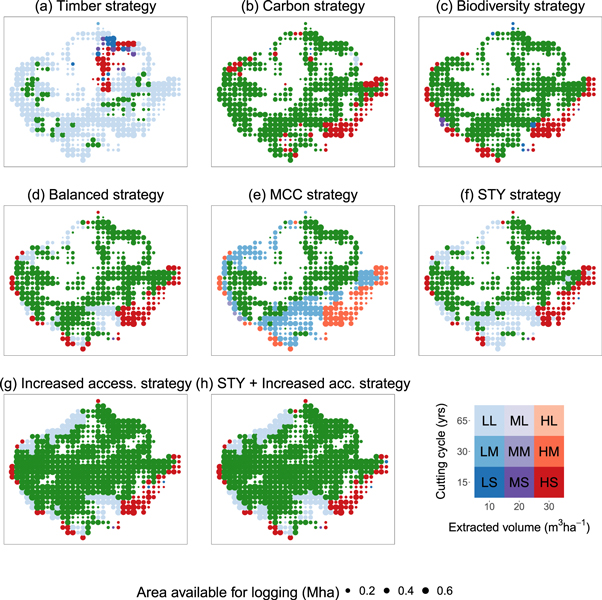
Figure 3. Results of spatial optimisation with the eight strategies defined in table 1 with a natural forest timber extraction objective of 30 Mm3 yr−1. Green areas are not logged, white areas are not PPFs. The size of each dot is proportional to the PPF area. Logging type colour (blue–purple–red) represents the logging intensity (Light: 10, Medium: 20 and High: 30 m3 ha−1). Logging type transparency represents the cutting cycle length (Short: 15, Medium: 30, Long: 65 years): light colours correspond to longer cycles. For example, in the Balanced strategy (d), most PPFs are not logged (green), except some areas in the margin of the Basin that are intensively logged (red; 30 m3 ha−1 every 15 years) in east and southwest Amazonia, and extensively logged (light blue; 10 m3 ha−1 every 65 years) in south and northwest Amazonia.
Download figure:
Standard image High-resolution image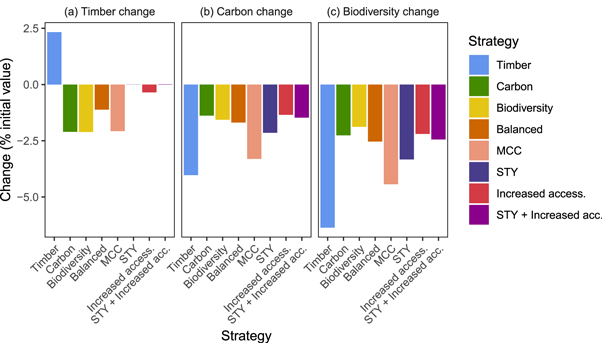
Figure 4. Impact of the eight management strategies (described in table 1) in terms of total ES provision (% of the initial ES value) with the timber extraction objective of 30 Mm3 yr−1. (a) Changes in regional timber stocks; (b) changes in regional carbon stocks; and, (c) changes in regional biodiversity. A positive value indicates an increase in total ES provision; a negative value indicates a loss in total ES provision. Changes in ES provision are standardised by the initial value of a given ES (i.e. initial timber, carbon stocks, and mammals and amphibians potential richness as a proxy of biodiversity) over all areas with forest cover >90% (see figure S3: 'All forests').
Download figure:
Standard image High-resolution image
Figure 5. Characterisation of different strategies for timber extraction with different timber extraction objectives. (a) Total area logged (Mha). (b) Mean logging intensity in logged areas (m3 ha−1). (c) Mean cutting cycle length (year). (d) Changes in timber stocks (% of the initial value). (e) Carbon emissions (% of the initial value). (f) Changes in biodiversity value (% of the initial value). The eight strategies' characteristics are summarised in table 1. STY and STY + Increased accessibility strategies cannot sustainably provide more than 50 and 60 Mm3 of annual timber extraction respectively. In plots (d)–(f), values are calculated over all areas outside of protected areas. Additional maps with distribution of logging types (intensity, cutting cycle) are provided in the supplementary material (figure S5).
Download figure:
Standard image High-resolution image
PPF area
In each grid cell, we only consider unprotected forests, i.e. areas having at least 90% of forest cover [4] and outside strictly protected areas (i.e. all IUCN categories except VI: 'Protected area with sustainable use of natural resources') [28]. Unprotected forests are further divided into two groups, depending on their distance to any road, here defined as any motorable track registered in OpenStreetMap [39]. Areas within 25 km of an existing road are referred to as AUFs; areas >25 km from an existing road are referred to as RUFs. In Peru, where an official map of permanent production forests was available online [40], we added these permanent production forests to AUFs.
Depending on the scenario (table 1), PPF area is then calculated for each grid cell as either the area of AUFs (scenarios (1)–(6)) or AUFs and RUFs (scenarios (7)–(8)). Because only 50%–80% of production forest area is considered suitable for logging due to steep slopes, riparian buffers and previous heavy degradation [41, 42], the PPF area is multiplied by a coefficient π = 58%. This value corresponds to the mean ratio between the area actually logged and the total area of forest concessions in French Guiana [34], and is similar to other pan-tropical data [43].
ES prioritisation
The spatially explicit ES provision function is estimated as the relative difference between the ES provision (i.e. timber volumes, carbon sequestration, and potential species richness) when a grid cell p is allocated to one logging type z and the ES provision when the same grid cell is not logged (logging type z = 0):
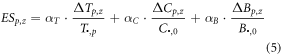
αT, αC and αB are the relative weights of timber, carbon and biodiversity respectively. When a unique ES (timber, carbon or biodiversity) is prioritised in a given strategy, its weight is set to 1 and the other weights are set to 0. When ES prioritisation is balanced,  . To analyse the effect of ES prioritisation on final ES provision, we ran 66 simulations with all combinations of weights from 0 to 1, with 0.1 steps. Results are presented in the supplementary material which is available at stacks.iop.org/ERL/14/124090/mmedia (figure S4).
ΔTp,z, ΔCp,z and ΔBp,z are respectively the net timber volume change (in m3 ha−1), the net carbon stock change (in Mg C ha−1), and the potential richness loss (mammals and amphibians) in grid cell p under logging type z (after one cutting cycle). Additional details are provided in equations (6), (7) and (8) respectively (see below).
T•,0, C•,0, and B•,0 are respectively the mean timber volume [34], mean carbon stocks [20] and mean potential richness of mammals and amphibians [44] in unlogged forests (z = 0) over all grid cells.
ΔTp,z is calculated as:

where vextz is the logging intensity associated to logging type z and Trecp,z is the timber recovery in grid cell p under logging type z, calculated with a previously developed volume recovery model calibrated at the Amazonian scale [34], with all parameters set to their maximum likelihood value.
ΔCp,z is calculated as:

where Cemip,z are the total carbon emissions caused by logging (yarding/skidding, road opening and incidental damage [45]; see supplementary section A) associated to logging type z in grid cell p and Crecp,z is the carbon recovery in grid cell p under logging type z (over one cutting cycle), calculated with a previously developed carbon recovery model calibrated at the Amazonian scale [46], with all parameters set to their maximum likelihood value.
ΔBp,z is calculated as:

where Rmp and Rap are the pre-logging potential richness of mammals and amphibians respectively [44], βm = −1.44 and βa = −1.53 are the estimated slopes of post-logging species loss in the Neotropics for mammals and amphibians respectively, according to Burivalova et al [17]. vextz is the logging intensity in logging type z.
Mammals and amphibians were chosen because of data availability (potential richness maps and effect of selective logging on each taxon); moreover, they both play key roles in ecosystem functioning [47–50], and thus on ES provision. We used global maps of mammals and amphibians potential richness derived from IUCN species range maps [44], which can fairly represent patterns of conservation priority [51].
We hypothesize that amphibians and mammals potential richness do not recover after logging (no effect of cutting cycle length), because logging roads make forests more accessible for other human activities (e.g. hunting [52]), thus having a long-term effect on sensitive taxa such as mammals and amphibians [53]. However, post-logging recovery has been observed in some cases, e.g. in bat communities [54]: we thus analyse the consequences of different biodiversity recovery rates on optimal logging configuration in the supplementary section B.
Results
Optimal logging configuration under a 30 Mm3 yr−1 timber extraction objective
Our predictions when timber recovery is optimised (i.e. Timber strategy) result in exploitation of 88% of all PPFs over one cutting cycle, of which 7% are under high-intensity short-cycle logging, 3% under low-intensity short-cycle logging and 78% under low-intensity long-cycle logging (figure 3(a)). In contrast, maximising carbon and biodiversity retention results in the preservation of 85% of PPFs, and logging 15% of PPFs under the highest intensity (30 m3 ha−1) and shortest cutting cycle (15 years) allowed (figures 3(b)–(c)). Logged areas are distributed around outer fringes of Amazonia: southeastern Amazonia for both carbon and biodiversity, northern Amazonia for carbon and the southwestern border for biodiversity. These areas correspond to the lowest values on above-ground carbon and potential richness maps, explaining why they are allocated to intensive logging when those ESs are optimised.
Balancing timber, carbon and biodiversity (i.e. Balanced strategy) results in preservation of 74% of PPFs, logging 13% of PPFs under high-intensity (30 m3 ha−1) short-cycle (15 years) logging and 13% under low-intensity (10 m3 ha−1) long-cycle (65 years) logging (figure 3(d)). Similar to the Carbon and Biodiversity strategies, heavily logged areas are concentrated on the peripheries of the Basin, especially on its southeastern border and low-intensity logging is concentrated in the south and northwest whereas central, western and northeastern Amazonia remain mostly unlogged. Allowing only 30 year cutting cycles (MCC strategy) results in the preservation of a smaller share of production forests (48%) while 16% are logged under high-intensity (30 m3 ha−1) and 36% under low intensity (10 m3 ha−1; figure 3(e)).
Adding a full-timber-recovery constraint (STY; figure 3(f)) results in allocating a higher proportion of forests to low-intensity long-cycle logging (29% versus 13% in the Balanced strategy) and preserving fewer areas (60% versus 70% in the Balanced strategy).
Increasing forest accessibility through road building (figure 3(g)) results in a spatial configuration similar to the Balanced strategy. The total area under high-intensity (30 m3 ha−1) short-cycle (15 years) logging is slightly lower than in the Balanced strategy (13 Mha instead of 14 Mha) and the total area under low-intensity (10 m3 ha−1) long-cycle (65 years) logging is higher (24 Mha instead of 14 Mha). Adding a STY constraint (STY + Increased accessibility strategy) increases the proportion of low-intensity long-cycle logging (15% versus 12% in the Increased accessibility strategy) and decreases the proportion of preserved areas (79% versus 82% in the Increased accessibility strategy) (figure 3(h)).
Effect of strategy choice on ES provision
The Timber strategy results in the best final timber stocks (+2.3% of initial timber stocks, figure 4(a)), the lowest carbon stocks (−4% of initial carbon stocks, figure 4(b)) and the least biodiversity retention (−6.4% of initial value, figure 4(c)). The Carbon, Biodiversity, Balanced and Increased accessibility strategies result in timber losses (−2.1%, −2.1%, −1.1% and −0.3%, respectively), but low carbon emissions (−1.4%, −1.6%, and −1.7%, and −1.3%, respectively) and low biodiversity losses (−2.3%, −1.9%, −2.5%, and −2.2%, respectively). The strategies with a STY constraint (STY and STY + Increased accessibility) result in no change in timber stocks (figure 4(a)), at the cost of higher carbon and biodiversity losses than the strategies without the STY constraint (the Balanced and Increased accessibility strategy, respectively; figures 4(b)–(c)). In contrast, the MCC strategy performs very poorly at provision of all three ESs. Indeed, this strategy results in the highest reduction of timber stocks (−2.1%) and the second highest reduction of carbon stocks (−3.3%) and biodiversity (−4.4%).
Changing the timber extraction objective
Our model framework allowed us to test the ability of the eight forest management strategies to satisfy timber demands that range from 10 to 80 Mm3 yr−1. Increasing timber extraction results in an increase of area harvested (except for the Timber strategy; figure 5(a)), and a reduction of ES provision (figures 5(d)–(f)). For the Timber strategy, the total area logged is already at its maximum value (around 80 Mha) even with low timber extraction objectives (figure 5(a)). For this strategy, increasing timber extraction from 20 to 80 Mm3 yr−1 would result in increasing mean logging intensity by 60% (from 10 to 16 m3 ha−1) and decreasing mean cutting cycle length by 15 years (from 60 to 45 years) (figures 5(b)–(c)).
The Carbon and Biodiversity strategies show similar patterns: both rely upon high-intensity (30 m3 ha−1) short-cycle (15 years) logging, independently from the timber extraction objective (figures 5(b)–(c)). Increasing timber extraction in both strategies results in a linear increase in logged areas (figure 5(a)).
When ES prioritisation is balanced (Balanced and Increased accessibility strategies), timber extraction is mostly achieved through low-intensity long-cycle logging when the timber extraction objective is low (figures 5(b)–(c)). However, increasing timber extraction under both strategies generates a shift from low-intensity long-cycle logging to high-intensity short-cycle logging (figures 5(b)–(c); figure S5), and extended total area logged.
Adding the STY constraint to the Balanced and Increased accessibility strategies (respectively the STY and STY + Increased accessibility strategies) does not drastically change simulations when extraction objectives are low (<20 Mm3 yr−1). At higher extraction objectives, mean logging intensity plateaus at approximately 15 m3 ha−1 and the mean cutting cycle stabilises at 50 years, resulting in a sharp increase in the total area logged (figure 5(a)). The STY constraint can only meet 50 Mm3 yr−1 in AUFs (i.e. in the STY strategy) and 60 Mm3 yr−1 when including RUFs (i.e. in the STY + Increased accessibility strategy).
Finally, the MCC strategy (i.e. balanced ES prioritisation with cutting cycles of 30 years) results in low-intensity logging when the total extraction remains lower than 20 Mm3 yr−1 (figure 5(b)). Increasing timber extraction results in a sharp increase in both the total area logged and the logging intensity (figures 5(a)–(b)). When the timber extraction objective reaches 80 Mm3 yr−1, the total area logged is close to its maximum value (around 80 Mha; figure 5(a)) and all areas logged are under high-intensity logging (30 Mm3 yr−1; figure 5(b)). In terms of ES provision, the MCC strategy performs poorly compared to others, especially at high timber extraction objective (figures 5(d)–(f)).
Discussion
Our results show that regional optimisation of ES provision results in a strong spatial structuring of logging. Intermediate logging cycles (30 years) and intensities (20 m3 ha−1) are virtually never chosen, and imposing some standardisation (e.g. 30 year cutting cycles in the MCC strategy) results in sub-optimal ES provision. This spatial heterogeneity in our results highlights the need to account for regional variations in ES provision when designing forest management, instead of applying uniform logging regulations.
The joint optimisation of three ESs in our framework revealed the inability to find an ideal solution that would optimise both timber stocks recovery and forest conservation (carbon and biodiversity). It therefore seems crucial to reassess either the objectives (i.e. combining a sustainable production with forest conservation) or the strategy (i.e. conventional selective logging) of timber production in Amazonian forests.
Regional differences in Amazonian forests and consequences for ES provision
The spatial configuration of optimal logging (figure 3) is closely linked to major regional differences in the functioning of Amazonian forests. Forests of the Guiana Shield (northeastern Amazonia) grow on nutrient-poor soils and suffer few natural disturbances [55], which selected for low turnover rates and slow-growing species [56]. Guiana shield forests thus harbour large amounts of carbon [20] and support rich vertebrate communities [57] due to their long-term persistence [58] and are therefore not selected for logging when biodiversity and carbon are optimised (figures 3(a)–(b)). Forests of the Guiana Shield have also been shown to play a crucial role in the Amazonian hydrological cycle [59, 60], enhancing the importance of their conservation in future management strategies. Similarly, northern and central Amazonian forests encompass high diversity of vertebrates [44] and carbon [20], and are thus rarely selected for logging when biodiversity and carbon storage are prioritised (figures 3(a)–(b)). If conservation is the main objective of Amazonian forest management, the consolidation of the protected area network in central and northeastern Amazonian forests will provide high benefits for conservation and climate change mitigation, especially if this promotes higher connectivity between existing protected areas [61].
Southeastern forests have, in turn, relatively lower biodiversity and carbon stocks. They are thus often allocated to high-intensity short-cycle logging when carbon and biodiversity are optimised (figures 3(a)–(b)). However, due to the region's dense road network that increased forest degradation through logging, fragmentation and/or wildfire [62, 63], timber extraction potential in southeastern forests may have been overestimated, even in closed-canopy forests [64]. Southeastern forests are also predicted to experience longer and more severe droughts shortly [65]. These droughts, in combination with fires induced by increased temperatures and decreased humidity in logged forests [66], can have negative impacts on future timber provision [13], carbon stocks and biodiversity [62].
Land-use strategies, trade-offs and implications for policy-making
Current logging regulations (e.g. 35 year maximum cutting cycle in the Brazilian Amazon) were thought to be a compromise between producing enough timber to make financial benefits and letting the forest recover long enough to make logging sustainable [67]. Several studies have shown that these logging rules are not sufficient to recover pre-logging forest characteristics [13, 68, 69]. Moreover, our results show that current regulations (e.g. imposing fixed and nation-wide cutting cycles, similar to the MCC strategy) increase the loss of all ESs and lead to sub-optimal management (figure 4). The standard strategy often promoted for the maintenance of timber stocks in tropical forests is to change national regulations so that cutting cycles are longer and logging intensities are lighter, but these recommendations may result in a significant increase in total harvested forest areas to compensate for the reduction in timber extracted per ha and per year.
Our results reveal that the main trade-off among ESs considered in this study is between a long-term provision of timber, and the conservation of carbon stocks and biodiversity (figure S4). These results fit into the broader 'land sharing versus land sparing' debate, and whether timber extraction should concentrate on a few intensely-logged areas (land sparing), or be carried at low intensity over the entire landscape (land sharing). Land-sparing logging was shown to create heterogeneous landscapes that favour higher levels of beta-diversity and maintenance of biodiversity at landscape scale [6, 70]. It has been argued that under strong forest governance, land-sharing logging could optimise both carbon and biodiversity retention [71]. More recently, a simulation exploring different management strategies in East Kalimantan forests found that the optimal forest conservation strategy consisted in mixing both approaches: intensifying timber production through the conversion of degraded forests into plantations, and implementing reduced-impact logging (RIL) in current logging concessions and some natural forests [72]. Our findings also show that a land-sparing approach (e.g. the Carbon and Biodiversity strategies) not only minimises biodiversity loss (figures 3(b), 5(f)), but also reduces carbon emissions (figures 3(a), 5(e)). However, these land-sparing strategies result in low timber recovery compared to a land-sharing strategy (e.g. the Timber strategy, figure 4(a)).
There is therefore no win-win strategy to sustain current timber demand and ESs provision in production forests. Further, the current application of intermediate logging rules increases ESs losses (figures 5(d)–(f)). The fate of Amazonian production forests hence depends on political choices and future societal demand for ESs. If maintaining long-term timber supplies from natural production forests is the goal [73], then low-intensity logging should be preferred and applied across most of the Amazon, notably in the western part of the Basin (figure 3(a)). It is important to note, however, that we did not analyse the net profitability, which could disadvantage a land-sharing approach because of high transport and road-building costs. This strategy might thus not be adopted by forest owners that generally manage forests to maximise financial benefits.
In contrast, if society demands the preservation of carbon and biodiversity (e.g. carbon-based policies like REDD+ [74]), policies should focus on conserving intact inland forests while allowing high-intensity logging on the fringes of the Amazon Basin. High-intensity logging will probably result in a sharp decrease in timber resources in over-harvested areas. If no action is taken to improve post-logging timber recovery, loggers might resort to harvesting new forest areas after the first cutting cycle, thus increasing carbon and biodiversity costs. Alternative pathways include active forest restoration with intensive silviculture and mixed-species timber plantations [75] to stimulate recovery in over-harvested forests. However, the additional costs associated with such operations can be discouraging, especially in a context of land tenure insecurity [76]. Enhancing timber recovery might, therefore, require adapted policies and financial incentives, e.g. through payments for ES [77].
Increasing the PPF area (in the Increased accessibility strategies, table 1) provides more options for optimising logging spatial configuration, and hence tends to increase ES provision overall: the Increased accessibility and STY + Increased accessibility strategies have higher ES values than the Balanced and STY strategies, respectively (figures 5(d)–(f)). Nevertheless, insofar as logging roads render forests vulnerable to fire [66], hunting, wood-fuel harvesting and illegal logging [78], uncontrolled forest degradation in new production forests could increase the environmental costs of the Increased accessibility strategy.
How to further improve ES provision in production forests?
Timber production, carbon sequestration and biodiversity are not the only ESs provided by Amazonian production forests. Other key ESs include water cycling [79] and limiting soil erosion [80]. The spatial and temporal variation of these ESs in Amazonian logged forests has, to our knowledge, not yet been studied, and we have therefore not included them in our optimisation framework.
Standardising logging rules (e.g. applying a unique 30 year cutting cycle in the MCC strategy) resulted in the lowest ES provision in our results: improving forest management will thus require some adaptation to local ecological specificities, e.g. forest types, recovery rates or local patterns of biodiversity. Because of the coarse resolution of our analysis, results might not be adapted to the definition of selective logging rules at the concession level. The overall patterns observed in figure 3 should be conserved at finer scales, but there might be some intra-cell heterogeneity of optimal logging distribution. Applying such detailed regulations will require highly-trained technicians to define, licence and implement forest management plans.
We did not explore the potential of improved logging techniques, generally known as RIL, to enhance simultaneously conservation values and timber recovery. A compelling body of evidence shows that RIL practices could provide large improvements in terms of timber recovery, carbon emissions and biodiversity protection [81–84], and many authors thus argue that they should be an essential point in forest management strategies [71, 72]. Additionally, silvicultural treatments such as liana-cutting, thinning and girdling, or enrichment planting, can also significantly increase timber recovery with reasonable financial costs [85]. Despite this evidence, RIL techniques and other silvicultural treatments remained poorly implemented in the field [86]. We thus decided to base our study on currently dominant logging practices, keeping in mind that ES provision would be improved if RIL was more widely implemented.
One key point to bear in mind is that our simulations are restricted to the first cutting cycle. This is particularly important for STY strategy, as even if our predictions ensure a sustainable timber production over the first cutting cycle, we cannot rule out decreases afterwards. There is almost no data on multi-cycle logging in Amazonia, and most permanent forest plots have only been logged once [87], although most production forests may have undergone multiple illegal re-entries [88]. Gathering more information on the effect of multiple cutting cycles on forest dynamics is of utmost importance to glimpse at the future of production forests.
Another limitation is the small number of existing studies on the effect of selective logging on biodiversity, resulting in a high uncertainty on actual species richness loss rates [17]. Moreover, the use of species richness as a proxy of biodiversity overlooks species characteristics and spatial species turnover [89]. Accounting for range size [90], IUCN conservation status [91], or habitat specialisation [92], could help better depict the biodiversity cost of logging. However, to our knowledge, no studies have quantified the effect of logging on such biodiversity measures. More studies on the biodiversity impact of logging would thus be key to optimise conservation in Amazonian production forests. Nevertheless, in the case of habitat specialisation, the focus on forest specialists is expected to increase the effect of logging in the densely forested central Amazon and decrease its effect on the basin margins where landscapes are more open and forest specialist species are less common [93]. Thus, an analysis focused on forest specialists should accentuate the pattern observed in figure 3(c).
Finally, even though our findings provide an interesting insight on potential trade-offs that future forest managers and decision-makers will face, a large part (20%–60%) of logging is illegal in the Amazon [94, 95]. Changing logging rules to maintain the environmental value of production forests can be jeopardised by a lack of control over their application. Improving Amazonian forests' governance will be key to maintain ES through informed management.
Acknowledgments
We thank all TmFOmembers who contributed data and participated in the discussions related to this paper, and especially the Instituto Boliviano de Investigación Forestal, as well as David P Edwards and two anonymous reviewers for suggestions that improved the manuscript. This study was partially funded by the GFclim project (FEDER 20142020, Project GY0006894), two Investissement d'Avenir grants of the ANR: CEBA (ANR-10-LABEX-0025), the REsilience of Managed Amazonian FORests project funded by LabEx Agropolis (ANR-10-LABX-0001), and Embrapa, by Brazilian National Council of Science and Technology-CNPq (Processes 309319/2018-8) and the Foundation for Research Support of the State of Sao Paulo-FAPESP (Processes 2013/16262-4, 2013/50718-5). The study was carried out in the framework of the Tropical managed Forests Observatory (TmFO), supported by the Sentinel Landscape program of CGIAR (Consultative Group on International Agricultural Research) Forest Tree and Agroforestry Research Program.
Data availability
The data that support the findings of this study are openly available at https://doi.org/10.6084/m9.figshare.8153777.
Author contributions
CP and BH designed the study, CP performed simulations and wrote the first draft, CP, ER, FEP, TAPW and BH wrote the paper, all other authors contributed data, commented on and approved the manuscript.