

Abstract
Steam-electric power dominates global electricity production. Mitigating its environmental burdens relies on quantifying them globally, on a high resolution. Here, with an unprecedented combination of detail and coverage, the Rankine cycle was individually modelled for >21 000 geocoded steam-electric generating units globally. Accounting for different cooling systems and fuels enabled the calculation of three major environmental stressors on a generating unit level. Geographical, chronological, and technological patterns are examined, as are trade-offs and improvement scenarios. Greenhouse gases (GHG) emissions from young (>2000) Chinese coal-fuelled generating units are equal to the sum of GHG emissions from all steam-electric power plants of all ages in the U.S. and Europe, and occupy 5% of all GHG emissions from the entire global economy. Twenty-four per cent of freshwater consumed from steam-electric power originates from nuclear power units from the 1970s/1980s, mainly in the U.S. and Europe. One per cent of steam-electric generating units is responsible for 50% of global heat emissions to freshwater. The median carbon intensity of Indian coal-fired units (≥50 MW) is 7%–16% higher than that in any other region globally. As concerns GHGs, technology-related efficiency differences (Rankine cycle, cooling system) play a small role compared to the fuel, which dominates the carbon intensity (GHGs/GJ el.). With the highest shares of cogeneration, 1 GJ electricity from tower-cooled coal units in Russia consumes on average 8%–49% less freshwater compared to respective units globally. There is a small margin for improvement based on alternative steam-electric technologies: retiring inefficient units and replacing their demand by ramping up more efficient ones with the same fuel, within the same country results in, respectively, ∼1%, 6%, and 11% fewer GHG emissions, freshwater consumption, and heat emissions globally. The full environmental benefits of completely retiring old units (<1970) consist of 9% fewer GHG emissions, 7% less freshwater consumed, and 18% fewer thermal emissions globally.
Export citation and abstract BibTeX RIS

Original content from this work may be used under the terms of the Creative Commons Attribution 4.0 license. Any further distribution of this work must maintain attribution to the author(s) and the title of the work, journal citation and DOI.
1. Introduction
Modern lifestyles are inextricably dependent on the use of electricity. A growing population equates to a growing electricity demand, with projections of electricity generation expected to increase by approximately 68% by 2040 compared to 2010 levels [1]. Historic trends in the shares of global gross installed electricity generation capacity (figure S1), as well as predictions of future electricity production [1] point towards a heightened effort to invest in renewable sources of electricity production. Nevertheless, the steam-electric power sector still dominates the worldwide picture, with ∼60% of the global gross installed generation capacity (figure S1, supporting information (SI) available online at stacks.iop.org/ERL/15/104029/mmedia).
Steam-electric power production occupies the unique and unfavourable spot of ticking one, two, or all three of the following triad of environmental stressors: emissions to air, thermal emissions to water, and water consumption, depending on the combination of fuel and cooling system used (table 1), all of which have environmental impacts with local or global outreach. The combustion products from fossil-fuelled electricity generation (including greenhouse gases (GHG), particulate matter, NOx and SO2) are linked to impacts on ecosystem quality (such as global warming and acidification [2]), as well as on human health [3]. The freshwater consumed in wet cooling systems of steam-electric generating units leads to areas of water stress, which put pressure on ecosystem and human health [4]. Finally, the heat contained in once-through cooling effluents can lead to extended stretches of thermally polluted rivers and lakes, compromising the habitats of aquatic organisms [5–10]. To put these impacts into context, the WEF Global Risks Report 2020 [11], a result of a multistakeholder process, lists climate action failure, biodiversity loss and water crises among the top five most impactful global risks. Freshwater consumption and heat emissions contribute to water crises and biodiversity loss, while carbon footprints constitute an indicator for assessing the climate crisis.
Table 1. Overview of the main environmental stressors associated with steam-electric power generation as a function of the group of cooling systems and the type of fuel used.
| Cooling system group | Fuel type | Environmental stressor | ||
|---|---|---|---|---|
| Emissions to air | Thermal emissions to water | Water consumption | ||
| Once-through cooling (OTF, OTS/B)a | Combustibles | √ | √ | √ |
| Nuclear | √ | √ | ||
| Wet recirculating tower cooling (TC) | Combustibles | √ | √ | |
| Nuclear | √ | |||
| Dry (air) cooling (DC) | Combustibles | √ | ||
aOTF/S/B: once-through freshwater/seawater/brackish water cooling
The assessment of the environmental impacts associated with power production on a global level has been the focus of numerous studies e.g. [12–15], and, recently, the attention of researchers has turned towards the estimation of the relevant impacts on a high spatial resolution e.g. [16–19]. In collaboration with several partners, the World Resources Institute has made a concerted effort of producing an open-access geolocalised global database of power plants based on government data and other independent sources [20, 21]. Information is aggregated on a power plant level and includes plant name, owner, installed capacity, fuel groups, coordinates, country, commissioning year and in some cases annual power generation. Nevertheless, while part of its future endeavours, the WRI database does not provide unit level information and does not yet quantify environmental emissions. In addition, most other currently available databases do not provide environmental emissions on a generating unit level. A recent study on the climate and human health impacts of global coal power generation quantified on a generating unit level presents a notable exception [19]. Spatial detail is paramount for the assessment of water scarcity and thermal pollution impacts, and a generating unit level analysis of impacts the steam-electric power sector is vital for comprehensive scenario assessment studies. Other studies e.g. [18, 22]. have resorted to empirical instead of mechanistic modelling for the estimation of quantities such as CO2 emissions or the efficiency of a power plant. The use of regression models is often warranted when the modelled system is complex and there is little knowledge concerning its structure and mechanism; in the case of steam-electric power plants, however, the thermodynamic cycles underpinning their operation and associated emissions, are if not simple, certainly well understood.
In view of the global risks posed by climate action failure, biodiversity loss, and water crises, the importance of establishing both a global and a local view of the environmental burden of steam-electric power production, and the lack, to date, of a highly detailed analysis of the latter with worldwide coverage, the goal of this work is to quantify and publish in an associated dataset the GHG emissions (carbon footprint [23]), freshwater consumption, and heat emissions to freshwater of steam-electric power production on a generating unit level based on explicit thermodynamic modelling, in order to a) get a complete geographical/chronological/technological picture of the current global and local environmental stressors caused by steam-electric power generation; b) examine the trade-offs between the three identified environmental stressors; and c) assess the improvement potentials through scenario modelling.
2. Methodology
2.1. Expanding the analysis
This work builds upon the analysis carried out by [24], which is based on the Platts UDI WEPP (World Electric Power Plants) database [25]. The SI presents a discussion of the coverage of the WEPP database, as well as of the data gap filling work carried out by [24] and completed in this work. The goal of [24] was to quantify the rate of heat rejection into freshwater bodies, a direct output of the Rankine cycles; they therefore focused their attention on generating units with once-through freshwater cooling systems (OTF). Here, the thermodynamic analysis was expanded to include all steam-electric generating units (>21 000 units pertaining to ∼10 000 plants and 3.1 TW or ∼60% of the global gross installed electricity generation capacity) including those with other types of cooling systems, including ones categorized in the following groups: wet recirculating tower cooling (TC), dry (air) cooling (DC), and once-through sea- or brackish water cooling (OTS/B) (see table S2 for a breakdown of cooling systems analysed). This broadened analysis enabled the calculation of two more environmentally significant stressors: the rate of GHG emissions, which is relevant for units running on combustible fuels; and the rate of water consumption, which is especially important in the case of generating units employing freshwater cooling systems (OTF, TC).
Figure S4 shows the five different types of Rankine cycles, the thermodynamic representation of the power cycle employed by steam-electric generating units, identified from the technical specifications provided in the WEPP database, and their temperature-specific entropy diagrams. Solving the thermodynamic cycle in each case involves calculating the enthalpies,  , at each state
  (1–12 depending on the cycle). In the simplest case of the non-ideal Rankine cycle (figure S4), the pump compresses the liquid water from pressure
  to
to  and feeds it to the boiler. Here heat is added to the system and, at a constant pressure
  , the water is converted into steam (state 3). The high pressure steam is then expanded through the turbine, producing power. Upon exiting the turbine (state 4), the steam is directed to the condenser where heat is rejected from the system, converting the steam into a saturated liquid (state 1), at which point it can re-enter the pump [26, 27].
The steps and equations required to solve each Rankine cycle with the available data, for generating units employing OTF cooling are described in [24]. The type of cooling system dictates the type of environmental data, and requires in each case a modification of the heat exchanger approach temperature difference for the calculation of the enthalpy (and other properties of the working fluid, in all cases here water) at state 1 of the thermodynamic cycle. Details are provided in the SI.
The following equations exemplify the steps taken for the calculation of the environmental performance of each generating unit for the case of the simple Rankine cycle, carried out on a monthly basis in each case to account for differences in environmental conditions and capacity factors. The equations become more complicated as the Rankine cycle is modified so as to increase the overall electrical efficiency or heat utilization, with reheat, regeneration and cogeneration. All variables and constants used in the thermodynamic analysis and further calculations are presented in table S3, fuel-specific constants are provided in the separate supplementary table, and all the equations relating to the electrical efficiency and the environmental performance of each generating unit are presented in full for the each type of Rankine in table S4.
2.1.1. Greenhouse gas emission rate
The emission rate of GHG resulting from the use of combustible fuels can be calculated separately for CO2, CH4, and N2O, or in aggregate, in terms of CO2 equivalents (CO2 eq.), as per equation (1):
where  has units of kg s−1 CO2 eq.;
  ,
,  , and
, and  (kg TJ−1) are the fuel-specific emission factors for CO2, CH4, and N2O, respectively, retrieved from IPCC guidelines [28];
  ,
,  , and
, and  are the 100-year global warming potentials relative to CO2 [29] of, respectively, CO2, CH4, and N2O;
  (-) is the monthly gross capacity factor for the generating unit in question, as described and calculated in [17];
  , collectively, is the unit-specific rate of energy absorption by water to form steam in the boiler, with
  (kg s−1), the steam flow rate, being generating unit-specific and either retrieved from WEPP database or from the gap-filling work of [24], and
  ,
,  (kJ kg−1) being the enthalpies at states 3 and 2, respectively, calculated as described in [24]; and
  (-) is the fuel-specific boiler efficiency retrieved from [30]. Biogenic CO2 emissions are considered to be carbon neutral. Therefore in the calculation of GHG emissions of biofuels only the contributions from CH4, and N2O emissions are included.
2.1.2. Heat rejection rate (or heat load on cooling system)
The heat rejection rate was calculated according to equation (2):

where  has units of MW;
  and
and  are, respectively, the monthly gross capacity factor and the steam flow rate for the generating unit in question (described above); and
  ,
,  (kJ kg−1) are the unit-specific enthalpies of states 4 and 1 on either sides of the heat exchanger, calculated as described in [24].
2.1.3. Water consumption rate
The water consumption rate for generating systems with wet cooling towers was calculated based on the equation for water consumption by [31] (equation (3i)). Whereas water withdrawal is defined as the total water taken up from a waterbody and includes the portion that is released to the same waterbody after its use, water consumption refers to the water not returned to its original water source after being withdrawn [32], which here includes that lost due to evaporation and due to blowdown. Water consumption due to drift was considered negligible and the entire heat load is assumed to be directed to the cooling system (and not lost to any other sinks, a conservative approach).
where  has units of m3 s−1;
  (MW) is the unit-specific heat load on the cooling system calculated according to equation (2);
  (kg m−3) is the density of water;
  (MJ kg−1) is the enthalpy of vaporization of water;
  (-) is the number of cycles of concentration, defined as the ratio of the concentration of dissolved solids in the circulating water relative to that in the make-up water, and determines the amount of blowdown;
  is the fraction (%) of blowdown treated and discharged, here taken to be zero, a conservative approach, because it is unknown what type of treatment, if any, each plant provides; and
  (%) is the share of heat load rejected through sensible heat transfer, calculated according to the following empirical equation [31]:
where  (°C) is the mean monthly ambient dry bulb temperature, averaged over the period 1971–2000, extracted at the location of each unit from gridded (0.5° × 0.5° resolution) daily estimates obtained from [33]. A discussion of the implications on the water consumption rate of the assumptions made, including regarding
  and
and  , is provided in the validation section of the SI.
Unlike the calculation of freshwater consumption occurring from the operation of generating units with TC, the estimation of freshwater consumption from OTF cooling system operation is not predominantly technology-based, in that there are many environmental parameters that influence the rate of evaporation of the cooling water effluent that is rejected directly into the adjacent natural or artificial waterbody, including the volume and surface area of the waterbody in question, its runoff, the wind speed, and the solar radiation. This makes the calculation of the water consumption on a generating unit basis extremely complicated and cumbersome for a global scale analysis. For this reason, the freshwater consumption resulting from the use of OTF cooling systems was calculated using literature estimates. Specifically the following equation was applied:

where  has units of m3 s−1;
  is the monthly gross capacity factor (described above);
  (m3 GJ−1) is the technology- and fuel-specific estimate of water consumption per GJ electricity produced retrieved from [34, 35] (see table S5); and
  (MW) is each unit's gross installed electric capacity as reported in the WEPP database.
Table S4 outlines the equations used to calculate the total annual environmental stressors, and the mean annual environmental stressors per unit gross electricity produced (stressor intensities).
2.2. Allocation in cogeneration and combined cycle setups
In the case of cogenerative Rankine cycles, GHG emissions were allocated to electricity and useful heat by exergy content according to the methodology presented in [36]. The relevant equations can be found in table S4. No allocation was performed for the other two stressors examined here, since cogenerative cycles reduce the heat load on the cooling system, resulting in both diminished thermal emission rates to freshwater and freshwater consumption rates. The reduced thermal load is not captured in the calculation of water consumption when OTF cooling is employed, since the latter is calculated independently (see equation 3iii), meaning that for this cooling system-stressor combination, results are overestimated.
In a combined cycle setup, the exhaust gas from the gas turbine unit (Brayton cycle) is subsequently used to power a steam turbine (Rankine cycle). In this work, except in the case of combined cycle single shaft setups (table S1), no GHG emissions were calculated for the electricity and heat produced by the steam-electric units of combined cycle setups, since the exhaust gas from the gas turbine (abbreviated 'Wsth' for waste heat) powering the steam turbine is taken to be burden-free. It follows that on a power plant level, the GHG emissions per GJ electricity would be considerably lower for combined cycle setups compared to that where only steam turbines are employed. However, the thermodynamic analysis and GHG emission calculation for gas turbine units (whether part of a combined cycle or not, a fact that is specified in the WEPP database) were beyond the scope of this analysis, which exclusively focuses on steam-electric power and reports results on a generating unit level. Figures S32 and S33 respectively present the absolute and percentage shares of gross installed electricity generation capacity per country for natural gas- and oil-fuelled power (the main fuels used to power gas turbines), separated by turbine type, and give an idea of the countries where the total GHG are actually considerably higher than those reported in this work, due to the operation of gas turbine units. As concerns water consumption or heat emissions, there is no underestimation caused by the exclusion of units running on Brayton cycles, since the working fluid of gas turbines is gas (usually air).
2.3. Validation of outcomes
Data from the eGRID database [37] and Schedule 8 of form EIA-923 of the US-EIA [38] were retrieved to compare with, respectively, the CO2 emissions and the freshwater consumption calculated in this work. Details of the methodology as well as full results are presented in the SI.
2.4. Replacement scenarios
Two different improvement scenarios were hypothesised and tested for their effect on the resulting environmental stressors. The annual GHG emissions, freshwater consumption, and heat emissions to freshwater were then calculated under the different scenarios, and the total environmental benefits were summed up per country.
In the first scenario, generating units were split into groups according to their country, fuel group, and thermodynamic cycle efficiency category (<0.35, [0.35, 0.40), [0.40, 0.45), ≥0.45), and the production-weighted mean stressor intensity was subsequently calculated for each group. On the basis that higher efficiencies mean lower stressor intensities (figures S24 also S18–S20), each power generating unit with a thermodynamic cycle efficiency <0.35 is retired, and the electricity it produces is covered by ramping up a steam-electric generating unit with the production-weighted mean stressor intensity in the highest efficiency category in the same country and using the same fuel. Note that a thermodynamic cycle efficiency of 0.35 corresponds to an overall generating unit efficiency of 0.27–0.33, due to the additional losses incurred in the boiler (where applicable), the turbine, and the generator (equation (2), table S4).
In the second scenario, generating units were split into groups according to their country, fuel group, and the decade during which they entered commercial operation (<1970, [1970, 1980), [1980, 1990), [1990, 2000), ≥2000). The production-weighted mean stressor intensity was calculated per country and fuel group for the most modern generating units, i.e. in the ≥2000 category, with a gross installed electricity generation capacity ≥50 MW. On the basis that modern power plants, with modern technologies, tend to be more efficient and have lower stressor intensities (figures S18 and S19–S20 excluding units running on nuclear power), each generating unit entering commercial operation before 1970 is retired, and the electricity it produces is covered by ramping up a modern steam-electric unit with the production-weighted mean stressor intensity from a construction year ≥2000 and with ≥50 MW in the same country and using the same fuel—whenever such a replacement match exists (otherwise no replacement is made).
Units running on cogeneration cycles (14% of the global gross installed electricity generation capacity of steam-electric power) were excluded from this analysis, to avoid assumptions about the share of useful heat produced. Following this exclusion, the shares of generating units destined to be replaced in the aforementioned scenarios amount to 14% and 9% of the global gross installed electricity generation capacity of steam-electric power respectively for the efficiency- and age-related scenarios. It should be noted that not all units are replaceable under the two options, namely there are not always generating units in the same country and fuel category built from 2000 onwards or with a higher thermodynamic cycle efficiency. Moreover, there is some overlap in the generating units destined to be replaced in each scenario. Specifically, there are ∼4200 and ∼2500 units up for retirement and replacement in the efficiency-related and age-related scenarios, respectively, with 900 appearing in both, amounting to 0.5% of the global gross installed electricity generation capacity of steam-electric power. In both scenarios the production-weighted mean was calculated instead of the arithmetic mean, because the former better reflects the large generating units that would, in theory, have the capacity to take on some of the electricity demand from the relatively inefficient or older generating units that would be retired.
3. Results and discussion
3.1. Geographical, chronological, and fuel-specific analysis of stressors
A striking observation involves the magnitude of GHG emissions from coal-fuelled Chinese generating units entering commercial operation from 2000 onwards (figures 1(a) and S15): the GHG emissions occurring in 2012 from these young Chinese coal-fuelled units alone are equal to the GHG emissions from the entire cohort of steam-electric power plants of all ages in the U.S. and Europe together (figures S14 and S15), occupying a share of 26% of the global GHG emissions from the steam-electric power sector, and 5% of all GHG emissions from the entire global economy (figures 3 and S17), as estimated by the EDGAR database [39, 40]. The main reason for this is the sheer number of new coal-fired units: between 2000 and early 2012, China dramatically increased its coal sector (figure 1(b)) with ∼1600 generating units pertaining to 650 power plants, with a median gross installed electricity generation capacity of 300 MW, contributing 18% of the global steam-electric power generated in 2012. In contrast, all new fossil-fuelled units commencing operation in the U.S. and Europe in the same period (126 units belonging to ∼102 plants) contribute 2% of the global steam-electric power generated. The steam-electric fossil fuel power sector in the U.S. and Europe is old (figure 1(b)), with 92% of its GHG emissions in 2012 originating from units entering commercial operation before 2000 (figures 1(a) and S15).
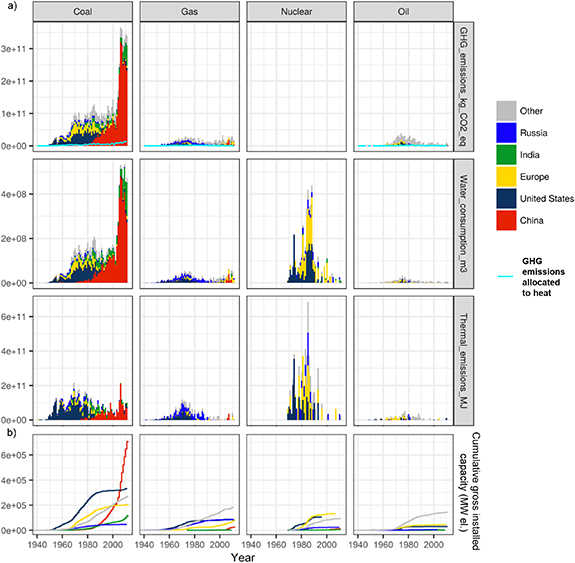
Figure 1. For the major fuel groups (accounting for 91% of the global steam-electric power generation) the per region: (a) distribution of total annual environmental stressors from electricity and heat generation, as a function of the year during which the responsible steam-electric power generating unit commenced operation. The turquoise line traces the contribution of GHG emissions allocated to heat production from cogenerative units. Aggregated and further disaggregated versions of this figure can be found in the SI (S12–S15). (b) The cumulative gross installed electricity generation capacity.
Download figure:
Standard image High-resolution image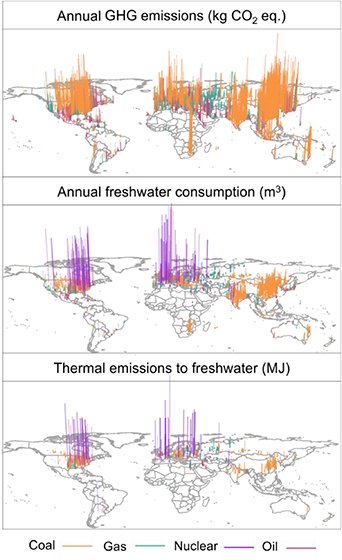
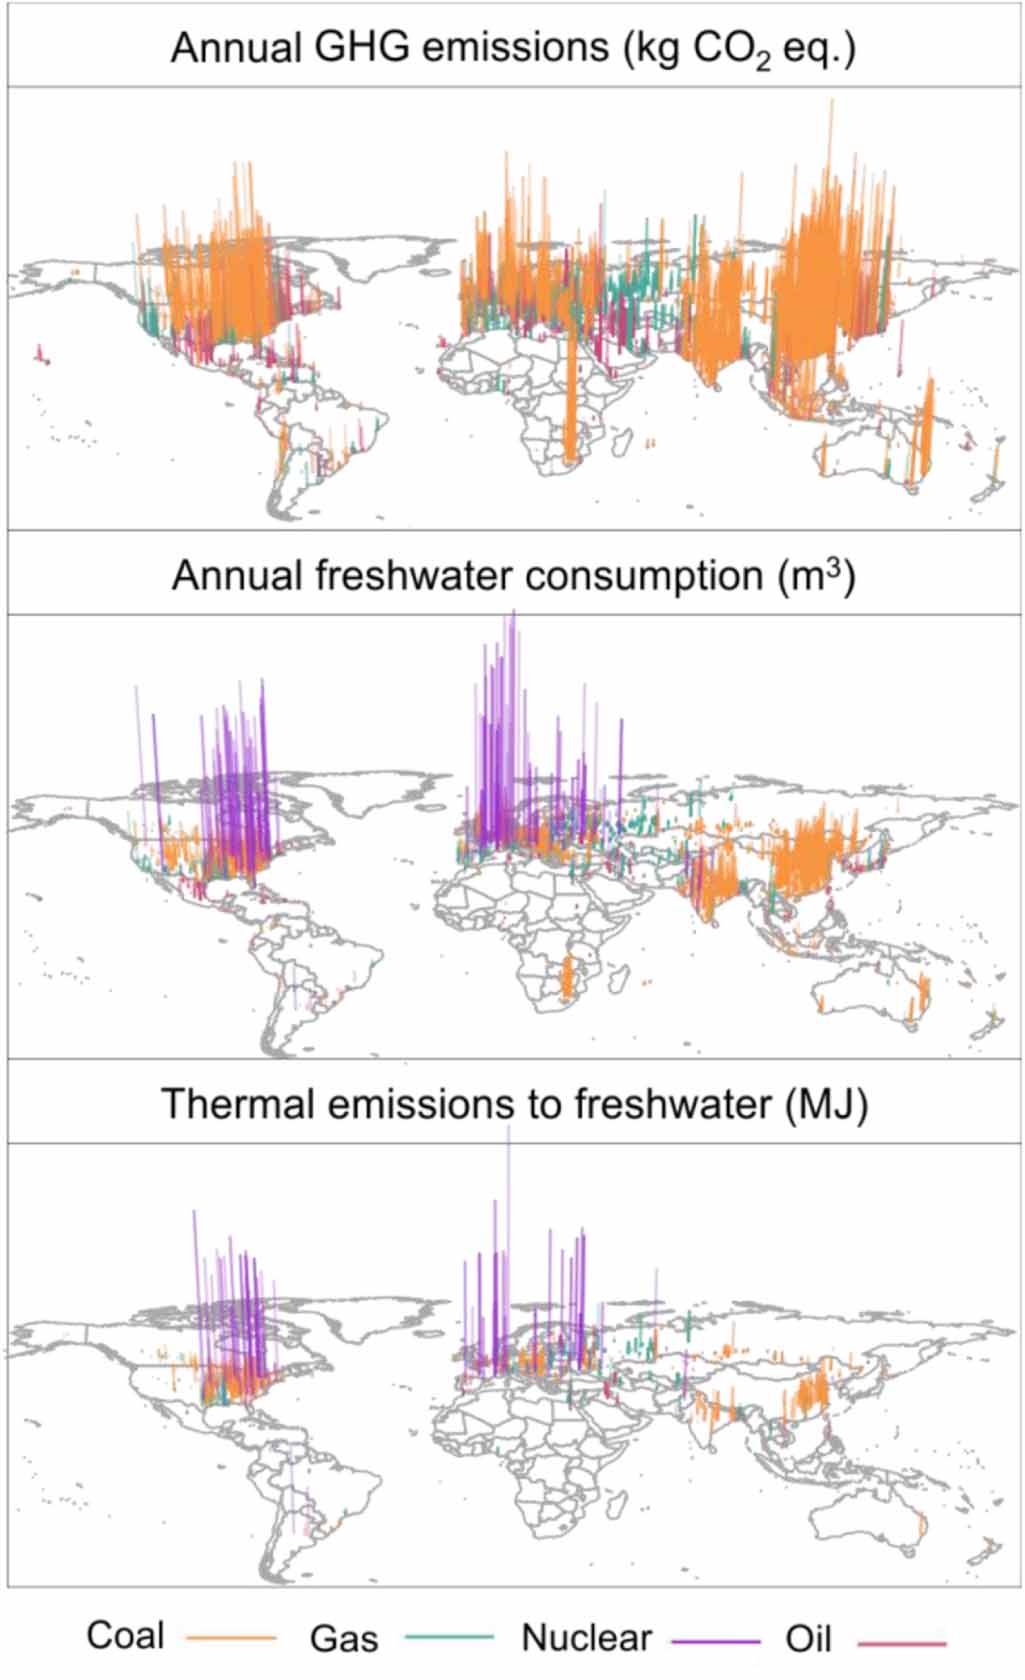
Figure 2. For the four major fuel groups (accounting for 91% of the global steam-electric power generation), the global distribution of steam-electric power generating units and the annual environmental stressors associated with their operation (electricity and heat generation). Figure S16 contains larger versions of these plots with all fuels included.
Download figure:
Standard image High-resolution image
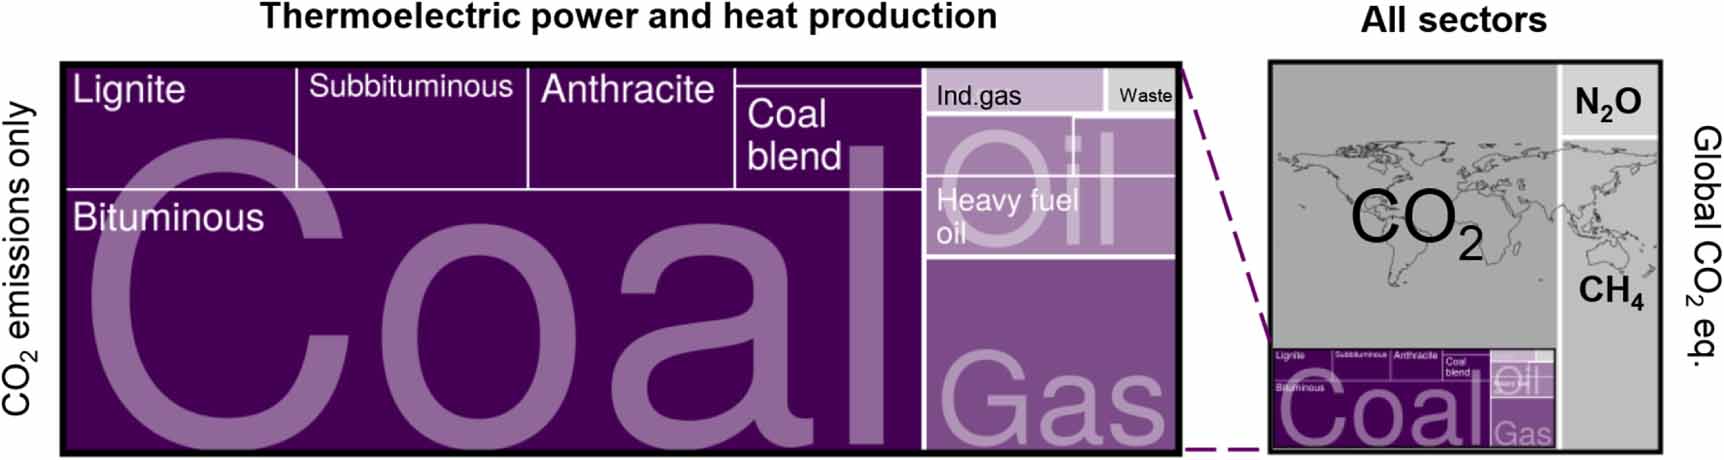
Figure 3. The global annual CO2 emissions from steam-electric power and heat production, as calculated in this work, put into perspective with the annual GHG emissions from the entire global economy, as estimated by the EDGAR database (19% of total) [39, 40]. The area of each tile is proportional to its value. The shares of CO2, N2O, and CH4 emissions from the entire public electricity and heat production sector in CO2 eq. (respectively 29%, 0.16%, and 0.02%) are visible in figure S17, a more detailed version of this figure.
Download figure:
Standard image High-resolution imageThe Chinese and U.S. coal power sectors occupy the top spots for total GHG emissions from the steam-electric sector (6.5%, and 2% of all GHG from the entire global economy). The Chinese coal power sector (units ≥50 MW, mean and median 298 and 300 MW, respectively) is 120% larger in terms of total gross installed electricity generation capacity, produces 184% more electricity, and 206% more GHG emissions compared to the respective U.S. coal power sector (units ≥50 MW, mean and median 353 and 255 MW, respectively). Evidently, the Chinese coal power sector is bigger, produces a larger amount of electricity, but produces an even larger amount of total GHG emissions compared to the respective U.S. coal power sector. Figure 4 and the related discussion provide some insight into this difference, which is driven by the fact that Chinese coal-fuelled units (≥50 MW) tend to operate with significantly lower overall (electrical) efficiencies, despite being much younger than respective U.S. units (medians 8 vs 43 years).
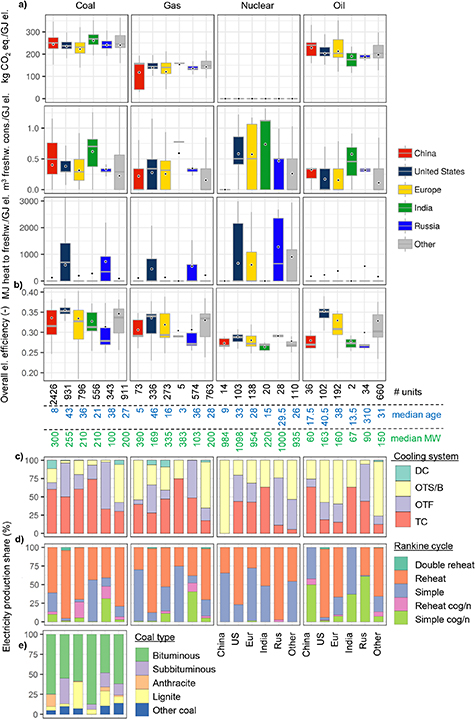
Figure 4. For steam-electric generating units (≥50 MW) and coal, natural gas, nuclear, and oil fuel groups (together accounting for 89% of the global steam-electric power generation): (a) per region and fuel group Tukey boxplots [41] of the mean annual stressor intensity (per GJ electricity produced) and (b) the overall generating unit electrical efficiency,  , (equation (2) in table S4); in both (a) and (b) outliers are not shown and the black points correspond to electricity production-weighted means. The numbers in between figure (b) and (c) represent the number, median age, and median gross installed electricity generation capacity of the units in each category. In terms of annual steam-electric power generation, the per region and fuel group shares of (c) cooling systems (DC: dry (air) cooling; OTS/B: once-through saline/brackish water cooling; OTF: once-through freshwater cooling; TC: wet tower cooling) and (d) Rankine cycles, from bottom to top in order of increasing average efficiency. (e) For coal, in terms of annual electricity production, the per region share of coal type, from top to bottom in order of increasing emission factors. Parts (a) and (d) are further disaggregated in terms of cooling system in figure S35.
Download figure:
Standard image High-resolution imageThe turquoise line in figure 1 represents the contribution to the total GHG emissions allocated to the useful heat generated by cogenerative units. This contribution is small, because most GHG emissions are allocated to electricity by exergy content (average allocation factors for electricity and useful heat: 0.7 and 0.3, respectively) and because cogenerative units occupy only 12% of the global steam-electric power produced (14% of the global gross installed electricity generation capacity from steam-electric power).
The steam-electric sector in the WEPP database is heavily populated by small and very small generating units (indicatively, 20% of the units have a gross installed electricity generation capacity <10 MW). It is unsurprising then that the bottom 59% and the top 4% of generating units are each responsible for 25% of the global GHG emissions (figure S18). The units in the former group tend to be significantly older, smaller and more inefficient than those in the latter group (figure S18). Half of the top 100 GHG emitting units are located in China, and several high GHG emitting units are observed in Japan, South Africa, the U.S., and Europe (figures 2 and S18), however, all except 11 of these top 100 GHG emitting units have a GHG emission intensity lower than 50% of the rest of the units globally. Coal leads the global GHG emissions, with bituminous coal dominating the fuel type and alone being responsible for ∼8% of the GHG emissions from the entire global economy (figures 2, 3, S17 and S18).
Globally, the chronological pattern of the current freshwater consumption from the steam-electric power sector follows a similar pattern of global GHG emissions from the same sector with an additional, large contribution from nuclear power generating units (figures 1 and S13–S15). Specifically, 24% of the global freshwater consumed in 2012 from the steam-electric power sector originates from nuclear power generating units, the majority of which are incorporated in U.S. and European power plants that entered commercial operation in the 1970s and 1980s. The absolute freshwater consumption from individual nuclear power generating units tends to be so much higher than that of fossil-fuelled units (figure 2) due to the following reasons: much larger units (figure 4), higher capacity factors, and lower thermodynamic cycle efficiencies (figure S35). A nuclear power generating unit typically operates with saturated steam conditions at turbine entry, which leads to a lower enthalpy change as steam expands through turbine and a lower thermodynamic cycle efficiency/higher steam flow rate, which, in turn, means a higher heat load on the cooling system and higher freshwater consumption per unit of electricity produced (equations (2) and (3i), figure S35).
Six per cent of units, pertaining to 5% of steam-electric power plants, are responsible for 50% of the global freshwater consumption from the same sector (figure S19). The generating units responsible for the top 25% of freshwater consumption tend to be larger, but at the same time have lower thermodynamic cycle efficiencies, as they are predominantly nuclear power generating units (figure S19). The top 100 freshwater consuming units are mainly located either in the U.S. or in Europe, with almost a third being in France (figures 2 and S19).
The overwhelming majority of freshwater thermal emissions occurring in 2012 come from coal and nuclear generating units (with global shares of 41% and 38%, respectively; figures 1 and S13–S15). The shares of thermal emissions from U.S., European, and Russian power generation are mainly due to relatively old generating units that commenced operating during the 1980s or earlier (figures 1, S12, S14 and S15), reflecting the fact that OTF cooling systems have been progressively used less and less due to concerns about the impact of thermal pollution on freshwater bodies, and related legal restrictions [24, 42].
One per cent of steam-electric power generating units is responsible for 50% of the global heat emissions to freshwater bodies (figure S20). The units responsible for the top 25% of thermal emissions to freshwater pertain exclusively to nuclear power plants for reasons explained above (larger units, higher capacity factors, lower thermodynamic cycle efficiencies), and the top 100 most thermally polluting generating units are located predominantly in the United States, Western Europe, Russia and Ukraine (figures 2 and S20).
3.2. Stressor intensities and trade-offs
The median carbon intensity of Indian coal-fired units ≥50 MW is significantly higher than that of any other region in the world (one-sided Brown-Mood median tests, p ≪ 0.001 in all cases; figure 4(a), table S6). Per the medians calculated, 1 GJ of electricity from Indian and Chinese coal-fuelled steam-electric units ≥50 MW result in, respectively, 11%–16% and 4%–8% more GHG emissions compared to that in Russia, the U.S., and Europe. Reasons for this can be found in the technologies used. India and China have the highest shares of electricity from coal by the lowest efficiency power cycle (figure 4(d); 56% and 25% from simple Rankine cycles, respectively, compared to 3%–12% in the U.S., Europe, and Russia), a fact that is captured in the distribution of the overall electrical efficiencies of the units (which includes the efficiencies of the boiler and of the thermodynamic cycle; figure 4(b), equation (2) in table S4), the Indian and Chinese medians of which are 1%–4% lower than the respective U.S. and European median efficiencies (absolute efficiency difference; figure 4(b)). In the case of China, this efficiency difference has also been observed by [43] who reports that Chinese coal power plants were constructed with less favourable steam conditions than U.S. and European counterparts for a long time until recent years, when more advanced steam conditions have been employed. Evidently, the lower overall electrical efficiencies of Indian and Chinese coal-fuelled units are enough to counterbalance the relatively higher share of cleaner coal types compared to the U.S. and Europe (figure 4(e)).
The high shares of electricity by cogeneration in Russian fossil-fuelled steam-electric sector (48%–61%, figure 4(d)), leads to lower thermodynamic cycle efficiencies, since part of the steam is extracted for purposes other than electricity generation (equations (1d)–(1e) in table S4). This does not translate to higher carbon intensities (figure 4(a)), because part of the GHG emission burden was allocated by exergy content to the useful heat output. The production of 1 GJ electricity from natural gas-fuelled steam-electric units MW ≥ 50 MW is on average (production-weighted) 40%–50% less carbon intensive than the respective unit of electricity produced by coal in all regions examined (figure 4(a)), an unsurprising result per se, but one that also shows that when it comes to GHG emissions, the chosen fuel dominates any potential electrical efficiency differences arising from the various types of cooling systems (see also figures S34 and S31).
This is not the case for the other two stressors examined. The trends for the production-weighted mean freshwater consumption intensities closely follow the trends in the per region and fuel group shares of TC (figure 4), which is the most water consuming means of cooling, since the dominant means of heat removal is evaporation [35, 44, 45]. One GJ of electricity from coal-generated in India consumes, on average (production-weighted), between 10% and 100% more freshwater than the respective electricity produced in all other regions examined, in no small part due to its high shares of TC (figure 4 and table S6). Disaggregating figure 4 by cooling system, reveals the effect of technological differences on the TC freshwater consumption intensity (figure S35). Low thermodynamic cycle efficiencies lead to increased heat loads on cooling towers (equation (2)), which in turn lead to higher freshwater consumption intensities (equation (3i)), most notable in the case of nuclear power generating units. With part of the steam extracted for purposes other than electricity generation, and therefore a reduced thermal load on the cooling system, cogeneration results in lower freshwater consumption intensities, as is evident by the case of Russian fossil-fuelled units with TC, all of which have both the highest share of electricity by cogeneration and the lowest median freshwater consumption intensity compared to those in any other region (8%–60% lower depending on fuel and region, figure, S35).
Unlike many of the differences in freshwater consumption intensity between generating units with TC that can be attributed to differences in the types of Rankine cycles, differences in freshwater consumption intensity between units with OTF cooling cannot be distinguished in this analysis, which relied on literature estimates. In OTF cooling, the heated cooling water is discharged directly into a neighbouring waterbody, and this work confirms that TC is therefore consistently more water intense (figure S35). As discussed in the methods section, there are many environmental parameters that influence the rate of evaporation of the cooling water effluent once it is discharged into a waterbody, and such an analysis (with global coverage, on a generating unit level) was beyond the scope of this study.
The region-specific production-weighted mean heat emissions to freshwater are, unsurprisingly, in line with the shares of OTF in each region-fuel group combination (figure 4). When disaggregating figure 4 further per cooling system (figure S35), the benefits of cogeneration are again evident, with Russian fossil-fuelled OTF-cooled units presenting higher shares of cogeneration and lower thermal emission intensities compared to other regions. Interestingly, nuclear power plants in China appear to get a free pass according to this analysis (figures 4 and S35), owing to the fact that they are all coastal and employ OTS/B, so none of the two freshwater-related stressors are relevant in this case (see also figure S31). Clearly it would not be wise to consider such cases as completely impact-free, as this might offer motivation to shift towards coastal nuclear power production, and. Thermal emissions to coastal or estuarine waters are not impact-free [46–49]. Moreover, there are other environmental problems associated with nuclear power generation, not least relating to accidents, both inland and coastal ones, as well as issues arising with long-term storage of nuclear waste. Metrics that include such impacts are beyond the scope of this study.
The trends and trade-offs noted above in the six different regions are also evident in figures S21–S23 in the successive scatterplots of per generating unit annual GHG emissions, freshwater consumption, and heat emissions.
3.3. Replacement scenarios
The two devised scenarios, consistently applied across the different environmental stressors, provide some interesting insights (figures 5 and S25–S30). On a global level, retiring relatively inefficient steam-electric generating units and ramping up more efficient steam-electric ones from the same country and with no different fuel to cover the demand of the former, would result in over 65 million tonnes fewer CO2 eq. being released into the atmosphere, over 1000 million m3 less freshwater consumed, and 1.6 million TJ less heat rejected into freshwater bodies, corresponding to relative global improvements of ∼1%, 6%, and 11%, for the aforementioned stressors, respectively. With the exception of freshwater consumption, the resulting benefits are not very far off with the second scenario: retiring old generating units and compensating for their electricity demand with modern steam-electric units of the same fuel and in the same country would spare the environment almost 90 million tonnes fewer CO2 eq., 150 million m3 freshwater consumed, and 1.9 million TJ heat released into freshwater, corresponding to respective relative global improvements of 1%, ∼1%, and 13% for the three stressors. It makes sense that the age-related scenario would not be as beneficial as the efficiency-related one in the case of freshwater consumption, since, globally, among the generating units entering commercial operation <1970, 51% employ OTF cooling and 28% TC, whereas among the modern ones (>2000), the shares for OTF and TC are 7% and 54%, respectively. In fact, this trend is observed in almost all countries individually too (figures 5(b), S27 and S28). On the other hand, retiring inefficient or old plants has a much lower relative effect on the GHG emissions than on freshwater consumption or thermal emissions, indicating that the GHG problem is more difficult to address.
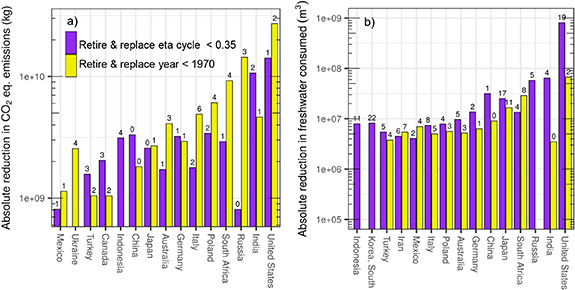
Figure 5. The total, absolute, per country environmental benefits of retiring old or relatively inefficient generating units and covering their electricity demand with, respectively, modern or more efficient steam-electric units using fuels of the same group. 'Eta cycle' in the legend refers to the efficiency of the thermodynamic cycle,  . The numbers on top of the bar charts represent the per country % relative decrease in (a) GHG emissions or (b) freshwater consumption in terms of the total country values from the steam-electric power sector for each scenario, rounded to one figure. Shown here are the countries with the top 15 highest absolute reductions in GHG emissions and freshwater consumption—for a complete picture of the results of replacement scenarios refer to figures S25–S30.
Download figure:
Standard image High-resolution image
The U.S. leads the tables for the country standing to benefit the most in absolute terms from both scenarios across all environmental stressors, with India, Russia, and Germany all appearing consistently in the top 10. In terms of relative country-level benefits, the scenarios deliver <5% improvement for all aforementioned countries in the case of GHG emissions, and a maximum of 19%, 4%, 5%, and 2% reduction in freshwater consumed and 33%, 9%, 13%, and 8% reduction in heat dumps to freshwater for the U.S., India, Russia, and Germany, respectively (figures 5 and S25–S30).
4. Conclusions
This work presents a comprehensive environmental burden analysis with an unprecedented combination of the highest level of detail and coverage of the global steam-electric power sector, offering the most detailed dataset to date relating to three important environmental stressors, GHG emissions, freshwater consumption, and thermal emissions to freshwater. According to the validation carried out (see SI), there is confidence in the stressor intensities, and accurate unit/power plant level absolute emission and consumption data can be calculated based on the former by acquiring generating unit/power plant level capacity factors—one of the easiest pieces of information to obtain from plant operators.
When it comes to the trade-offs presented by the use of different types of cooling systems, this work confirms the well-established fact that 1 unit of electricity produced by units employing TC consume significantly more freshwater than OTF cooling, with medians calculated here to be 60%–150% higher across the major fuel groups. At the same time though, the use OTF cooling also leads to heat emitted to freshwater bodies. As concerns GHG emissions, however, any thermodynamic cycle efficiency-related difference due to the cooling system in use is small compared to that caused by the type of fuel used. An interesting conclusion that can be drawn from the above is that dry cooling could be an environmentally attractive option for steam-electric power generation, in that, as the technology improves and any efficiency-driven difference in GHG emission intensity decreases, the two freshwater-related stressors could be avoided by switching from TC or OTF to DC. Nevertheless, this trade-off and other trade-offs presented here need to be carefully assessed in future research to derive recommendations as a function of location. The reason for this is that, while the impacts of GHG emissions have a global outreach, freshwater scarcity and freshwater thermal pollution (the environmental impacts associated with freshwater consumption and thermal emissions) are highly location-specific [17, 50]. Sea and brackish water cooled units come off as relatively or completely burden-free in the case of nuclear power, but this is only because the effects of coastal thermal emissions are not considered in this work.
The two scenarios set up present realistic situations, insofar as the lost power is covered by ramping up other, existing (younger or more efficient) steam-electric units. They present some interesting results, including the fact that when it comes to freshwater consumption there appears to be more motivation to retire inefficient generating units and replace them with more efficient ones using the same fuel within the same country, than there is to retire old generating units and replace them with modern ones. This though, would overall imply keeping old units with OTF cooling in operation, which is already a problem in places like the U.S. (grandfathering), meaning that the problem of thermal emissions would persist.
The devised scenarios have some limitations. The geographical resolution of the scenarios assumes that each country has a single electricity grid, which is a poor assumption for countries such as the United States and China that have sub-grids, or Western Europe that has international grids. To optimize the results across all three environmental stressors examined, improved scenarios would include ones that would include replacing the lost capacity from the retired units with that from technologies not considered in this work, importantly, hydropower and power from gas turbines, as well as wind and other renewable sources of energy. A more inclusive scenario assessment would also factor in policy-driven changes and power plant phase-outs in addition to emerging technologies, such as carbon capture and storage.
The full potential margin of improvement by removing the identified old and inefficient generating units is significant. The full environmental benefits of completely retiring current inefficient steam-electric power consist of 2.4%, 28%, and 40% reductions in GHG emissions, freshwater consumption, and heat emissions to freshwater, compared to the 1%, 6%, and 11% reductions for the same stressors under the scenarios examined here. In the scenario involving old units, global reductions of up to 9.3% in GHG emissions, as well as 6.9% and 18% less freshwater consumed and thermal emissions, respectively are possible. Replacing these identified old and inefficient steam-electric units with renewable technologies whose emissions are orders of magnitude lower (such as PV or wind-power, where possible) would mean coming much closer to the full realization of these identified environmental benefit margins. Future work should focus on the possibility of such replacements, so as to quantify potential pathways of governments to achieve the goals of the Paris agreement, as well as the Sustainable Development Goal for Affordable and Clean Energy. This work provides the foundation of such work by quantifying (and providing in the associated dataset) on the highest possible resolution a triad of major environmental stressors produced by current steam-electric power that should be prioritised for replacement in the future.
Acknowledgments
We would like to thank Stefanie Hellweg for her valuable comments.
Data availability
The data that support the findings of this study are openly available at the following URL: http://dx.doi.org/10.17632/23bndmtc3s.2
[The link includes the complete, geolocalised dataset of steam-electric power generating units with data derived from this work (technical information, efficiencies, associated environmental stressors, stressor intensities etc.)].