

Abstract
The surfaces of laser-sintered and laser beam melted parts are characterized by typical surface effects and thus cause difficulties when using the popular tactile profilometry method and conventional two-dimensional surface parameters for analysis. Therefore, this study shows the potential of a new measurement approach by a confocal microscope and three-dimensional surface parameters. Within this study, a special focus is laid on the classification of different surface orientations and on a special issue in laser sintering: orange peel severity.
Export citation and abstract BibTeX RIS
1. Introduction
Additive Manufacturing (AM) shows high potential to meet the demands of the increasing time- and cost-dominated product development process ('lean development'). Furthermore, new industrial trends like bionics, light-weight construction or 'mass customization' are potential fields of application for AM (Breuninger et al 2013). Due to strongly increasing markets—Roland Berger expects an AM market of 7.7 bn EUR in the year 2023 (Eisenhut and Langefeld 2013)—it is more and more important that the parts' quality meets the customer needs. Concerning the functionality of a component, surface texture plays a significant role, because surface effects in general cause up to 10% of the failing rate for manufactured parts (Leach 2011). With respect to AM, this value is estimated to be even higher. Consequently a poor surface quality is one of the main constraints concerning this technology (Schmachtenberg et al 2006).
Compared to traditional manufacturing techniques, such as milling or drilling, AM is characterized by a layer-wise part production without any tools. Two AM technologies with a high potential for widespread industrial use are the laser sintering process and the laser beam melting process (Wegner and Witt 2012a). Therefore, this study analyses the typical surface characteristics of these two AM techniques. An entire description of alternative AM processes involved in commercially available systems is given in (VDI-Standard 3405 2014).
Laser sintering and laser beam melting are both powder-based processes which follow almost the same procedure, but differ in the raw materials which are used: plastic powder in laser sintering and metal powder in laser beam melting. These powders are, in the first step, randomly distributed on a building platform. For the laser sintering process, pre-heating is necessary while the laser beam melting process runs at ambient air temperature. In a second step, a laser beam melts selective areas of the CAD models of the parts which have been sliced into many single layers before the process. When one of these layers has been sintered, the building platform is lowered by one layer of thickness and new powder is disposed. By repeating these steps solid parts are manufactured layer by layer (figure 1).

Figure 1. Schematic illustration of the laser sintering process.
Download figure:
Standard image High-resolution imageAs a consequence of the above-mentioned production sequence, the surfaces of AM parts are characterized by an aperiodic profile, caused by the random powder distribution. In addition, the layer-wise production process leads to a high dependence between the surface characteristic and the inclination angles, which describe the orientation of the manufactured parts within the powder bed of the machine (figure 2). Knowledge of the angle-dependent surface characteristics could help to estimate the specific surface quality at each area of the AM part and take this into account when preparing the processes.
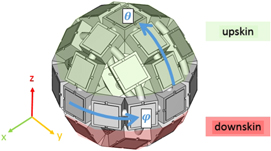
Figure 2. Schematic illustration of azimuth angle φ and polar/inclination angle θ as well as the upskin and downskin areas within the test specimens used for this study.
Download figure:
Standard image High-resolution imageLoose powder, not melted by the laser beam during a process, can be reused. Due to the fact that the laser beam melting process runs at ambient air temperature, the material only requires a slight recycling effort, e.g. the removal of agglomerates. In contrast to that, the plastic powder used in the laser sintering process shows aging effects caused by the preheating sequences. Therefore it needs to be refreshed with a certain percentage of new material after each build. When the refreshing rate chosen is too low, it can result in bad surface quality. This laser sintering specific effect is called 'orange peel'. In contrast to the common use of this terminology, it is not caused by a mechanical deformation of the surface, but a bad powder quality ((Gornet et al 2002), (Grießbach et al 2006), (Kruth et al 2008), (Fulcher and Leigh 2012) and (Wegner and Witt 2012a)).
Due to high material costs, it is the aim of AM users to find a compromise between low refreshing rates and costs and also achieve a high surface quality.
2. State of the art
Technical literature contains several analyses concerning the surface structure of laser-sintered parts and how it is affected by the process. Due to the layer wise production sequence, Ghanekar (Ghanekar and Crawford 2003) showed that a reduced layer thickness reduces the so-called staircase effect and therefore the surface roughness. Bacchewar (Bacchewar et al 2007) found the build orientation to be the dominant parameter affecting the surface quality. Furthermore they identified and differentiated between the layer thickness as a parameter influencing up- and downskin areas while the laser powder, as a third parameter, only influences downskin surfaces. Kaddar (Kaddar 2010) measured the surface roughness of different orientations and showed that inclination angles between 5° and 30° are more prone to poor surface quality. Besides, Wegner (Wegner and Witt 2012b) found the hatch distance and the density of energy for the outline laser as additional influencing factors, as the latter smoothes the surface and fills the steps of the staircase effect.
With a focus on the orange peel effect, several studies identified the powder age as the main influencing factor, which can be characterized by the molecular weight and the polymer chain length (Kruth et al 2008), the particle size (Fulcher and Leigh 2012) and the melt viscosity rate (Wegner and Witt 2012a). Pham (Pham et al 2008) also identified an influence of the part orientation on the orange peel effect and Gornet (Gornet et al 2002) pointed out that the determination of an acceptable surface finish always varies from user to user and is therefore critical to define.
Further surface analyses resulted in mathematical models to predict the surface roughness of AM parts((Campbell et al 2002) and (Ahn et al 2009)) and the possibilities of a surface structure optimization by post-processing have been investigated (Reinhardt et al 2013).
Compared to the laser sintering process, the inclination angle is an influencing factor in the laser beam melting processes too (Strano et al 2013). Regarding the process parameters, Rombouts (Rombouts et al 2005) identified the scan speed and the hatch distance as main influencing factors. Yadroitsev (Yadroitsev and Smurov 2011) confirmed the influence of the latter on the surface morphology. A laser spot diameter of 70 μm and a hatch distance of 120 μm lead to surface tracks with almost identical geometric characteristics, while a decrease of the hatch distance leads to changes in the thermo-physical conditions. As a consequence the surface characteristic changes as well. Mumtaz (Mumtaz and Hopkinson 2009) found out that a repetition of the scan lines also influences the surface structure. All the parameters mentioned before influence the melt pool and its wettability. Once the melt pool has a large thermal variation, the surface tension between its centre and edges is quite high and therefore the melt pool becomes unstable and breaks off into small entities to reduce its inner tensions. The result of a broken melt pool are small bonded particles on the surface, the so-called balling effect.
Strano (Strano et al 2013) investigated the effect of bonded powder particles on the surface characteristic of a laser beam melted test specimen at different inclination angles and developed a mathematical model for the prediction of surface roughness at different slopes. He found that the heat on the edge borders is not sufficient to fully sinter the particles. Therefore the particles do not merge completely with the layer and are stuck at step edges. As the inclination angle increases, the step edges are located closer to each other and so the concentration of bonded particles also increases. Mumtaz (Mumtaz and Hopkinson 2009) analyzed the correlation between the top and side surface roughness of the laser beam melted parts and found out that there is always a compromise between these two parameters: As the arithmetic mean surface roughness (Ra) on the top improves, the side Ra deteriorates and vice versa. They explained this phenomenon by different surface tension forces as a result of thermal variations within the melt pool.
The common factor in all of the analyses and models mentioned above is that the surface structure is analyzed by visual inspection or tactile profilometry in combination with conventional two-dimensional surface parameters. Analyzing an external surface with this approach results in a single surface profile which allows the calculation of surface parameters concerning this line. Due to the surface characteristics of AM parts, each variation of the measurement position is equal to a significant variation of the parameter values. Even though the German VDI-Standard 3405 (2013) describes tactile profilometry as a measurement technique, Wegner (Wegner and Witt 2012a) deduced that it is of limited suitability to describe surface structure effects, like the orange peel, of AM parts. A general statement is given by Seewig (Seewig 2011) who pointed out that a reasonable analysis of aperiodic surface structures with only one single profile line is not possible. Furthermore, Leach (Leach 2013) pointed out that an areal measurement has a higher statistical significance than an equivalent profile measurement and is also a closer representation of the 'real surface'. The same conclusion, with regard to laser sintering as special manufacturing technique, is reported by Lonardo (Lonardo and Bruzzone 2000), who used an optical conoscopic holography, because a stylus instrument is not suitable for the AM parts' surface characteristics. Their conoscopic holography instrument had a z-accuracy of 6 μm. Even though they managed to avoid the disadvantages of a stylus instrument, their measurement technique was relatively imprecise. Furthermore they concluded that the reliability of the measures depends on the optical properties of the surface and its slope.
Only a few other known studies used an areal measurement technique to describe AM surfaces: Hornfleck (Hornfleck 2012) used a confocal microscope to measure the conventional surface roughness depth (Rz) of parts which were produced by fused deposition modelling, another AM technique with periodic surface profiles in contrast to the powder-based processes. Kühnlein (Kühnlein et al 2012) used a confocal laser scanning microscope to analyze Rz values as well. He focused on the mask-sintering process which is another powder-based AM technique. He compared the measured values to a tactile profilometry and reported a huge difference between Rz Laserscan = 200 μm and Rz Profilometry = 30 μm, and explained this with a higher resolution of the confocal laser scanning microscope. Stelzer (Stelzer and Gumpinger 2014) analyzed the surface roughness of laser beam melted parts in different orientations in order to show the possibilities of improvement by electrochemical polishing. By analyzing the surface structure with scanning electron microscopy (SEM) images, he illustrated the significant difference between the vertical and horizontal surface characteristics.
The aforementioned studies concerning orange peel severity are one step behind, because the effect is described by a subjective optical inspection and a classification in groups or a scoring system without numerical parameters. Only one known study quantifies the orange peel effect by measured values: Yusoff (Yusoff and Thomas 2008) constituted certain values of surface roughness (Ra/Rz) to certain degrees of orange peel severity. He determined a degree of a 'good' orange peel effect for Ra values lower than 10 μm, a 'mild orange peel' for Ra values between 10 and 14 μm, and 'orange peel' for Ra values higher than 14 μm. However, he too measured the surface parameter values by tactile profilometry, and used a scan length of only 3 mm.
Drawing on the conclusions of known studies and the problems caused by the used measurement techniques concerning the surface characteristics of AM parts, the goal of this study was to evaluate the different possibilities of confocal microscopy for surface quality control in AM, with a special focus on the different surface orientations and orange peel severity.
3. Experimental setup
The core of a NanoFocus μsurf confocal microscope used in this study is an integrated confocal-optical filter unit, the multi-pinhole-disc (MPD). It is combined with a high-precision focusing module (Wilson 2010). The light of an LED source is focused through the MPD and the objective lens onto the sample surface, which reflects the light (figure 3).

Figure 3. Schematic illustration of a confocal microscope using MPD technology. For an explanatory video of confocal technology, scan OR-code or see link (https://www.nanofocus.de/technologie/messprinzipien/usurf-technologie/video-konfokaltechnik/).
Download figure:
Standard image High-resolution imageReflected light from the focus areas is filtered by the pinholes of the MPD. Thus, only in-focus light reaches the camera. This enables the confocal microscope to reach a high vertical resolution in the nanometre range (Sirichanok et al 2008). Each confocal image is a horizontal slice through the topography of the sample. Capturing the images at different focal heights produces a stack of such images, achieved through precise vertical displacement of the objective lens. In contrast to SEM, for example, confocal surface measurement produces data as real height coordinates (x, y, z). Only with this quantitative information is it possible to achieve an exact evaluation of the three-dimensional parameters which make it possible to obtain more meaningful results. In addition, there is no need to prepare the samples. An optical system also offers advantages compared to atomic force microscopes, such as large measurement areas, high speed and non-contact operation.
By using an optical, areal surface measurement technique, it is possible to analyze a large number of profile lines within the scanned area to determine the traditional profile parameters which are defined in ISO 4287. Furthermore, the surface can be characterized in accordance to new areal parameters which are defined in ISO 25178-2 and -3. These three-dimensional parameters are not only usable as a benchmark for manufacture and surface tolerance, but also to predict functional properties (Blunt and Jiang 2003).
As reported in former analyses, the surface characteristics in AM depend on the surface orientation during the manufacturing process. Therefore, test specimens were developed to cover a wide range of surface orientations within one part (figures 4(a) and (b)). The test specimen for the laser sintering process was designed with 38 test areas in total, classified in six groups of inclinations angles θ. Due to the necessity of support structures for downskin surfaces in laser beam melting, only surfaces with an inclination angle ≥90° were feasible with regard to the metal-based process and an identical test specimen design. Therefore the laser beam melting test specimen consists of 25 test areas and four groups of inclination angles. The different specimens were built from polyamide and polypropylene powder on different laser sintering machines (EOS Formiga P100 and DTM Sinterstation 2500 HS) and from Hastelloy X (2.4665) using an EOSINT M270 for the laser beam melting process.

Figure 4. (a) Laser-sintered test specimen during confocal microscopy with a 10 × 0.3 NA objective; (b) Laser beam melted test specimen during confocal microscopy with a 20 × 0.6 NA objective.
Download figure:
Standard image High-resolution imageFor this study, 52 laser sintering and 25 laser beam melting test areas were analyzed using a μsurf confocal microscope from NanoFocus (figures 4(a) and (b)). Due to the different layer thicknesses between laser sintering (100–120 μm) and laser beam melting (20–60 μm), a distinction in the optical resolution was necessary. Therefore, the plastic specimens were measured with a 10 × 0.3 NA objective and an areal test field of 10 × 10 mm2, in contrast to a 20 × 0.6 NA objective and an areal test field of 5.4 × 5.4 mm2 for the test specimen produced of metal powder.
The three-dimensional data capture offers the possibility to evaluate more surface parameters compared to the measurement of single profile lines (Valentin et al 2005). Hence, a correlation analysis regarding the surface characteristics was performed, including classical parameters according to ISO 4287, as well as areal parameters defined by ISO 12781 and ISO 25178. Furthermore, the analysis Software Mountains Map 7 offers a variety of surface analysis methods which were evaluated as well as special waviness parameters according to (SEP 1941 2012). In total, more than 250 different parameters in combination with various filters have been considered. Before calculating the surface parameters and studies with Mountains Map, a form removal of polynomial degree one was applied. Furthermore, a spatial filter (median denoising 5 × 5) was used to remove spurious points. The waviness parameters were derived from the primary surface profile by supressing the long-wave form components above the cut-off λf = 5 mm and the short-wave components below the cut-off λc = 1 mm. In addition, the mean line of the waviness separated the enclosed area of the waviness profile into two equal areas below and above this mean line (SEP 1941 2012).
Another method was a subjective evaluation of each single laser-sintered surface with a special focus on the orange peel severity, which was done by six laser sintering experts. This evaluation was based on grades from 1 (no orange peel effect) to 6 (extreme orange peel effect). For each surface, the mean value of the six expert's grades was the basis for the following correlation analysis. The standard deviation between the different expert evaluations was always within one grade.
Eventually, a physical measurement of laser-sintered cuboids (see inset in figure 5) with 20 profiles per single surface was realized using a stylus profilometer in order to evaluate the common state-of-the-art method as well. A Mitutoyo Surftest SJ-400 was used for these measurements and a lateral displacement of 0.1 mm between the measurement positions was chosen (tip radius 5 μm, sampling length 2.5 mm, cut off length 2.5 mm, scan length 12.5 mm).
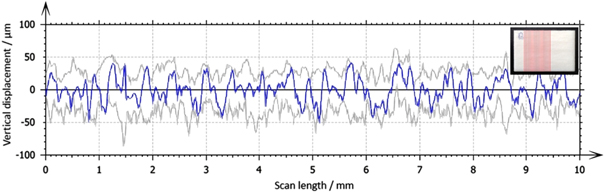
Figure 5. One highlighted single profile of the tactile profilometry (blue line) within the upper and lower envelopes (grey lines) of the profile series. It shows the wide range caused by the variation of the measurement positions. Inset: Variation of profile lines (red) within the surface of the test specimen.
Download figure:
Standard image High-resolution image4. Results and discussion
On account of the unique characteristics of each single measurement of the tactile profilometry, it is obvious that the more profiles are analyzed, the wider the range of each surface parameter value becomes. The analysis with 20 profiles (figure 5) showed, in comparison to just a few profile measurements—as often described in the state-of-the-art—a significant increase of parameter range and also an increase of the relative standard deviation, for example up to 43% relating to the maximum height of the waviness profile (Wz).
Therefore it is absolutely necessary to measure an adequate surface area to achieve a reliable analysis of an AM surface. Such an areal surface topography measured by the confocal microscopy is shown in figure 6.
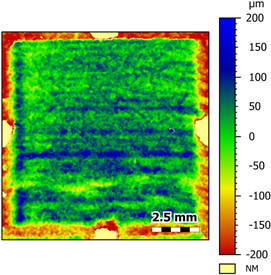
Figure 6. Laser-sintered topography measured with a confocal microscope. The topography is based on ∼11 million pixels. The brighter marks in the middle of each side of the test area are used for positioning.
Download figure:
Standard image High-resolution imageThe analyses concerning a correlation between the inclination angle and the typical surface parameters showed that the developed area ratio (Sdr) and the root mean square gradient (Sdq) are both appropriate for a classification of laser sintered and laser beam melted surfaces. Sdr and Sdq are hybrid parameters defined in ISO 25178 and quantify the information present on all three axes of the surface. Therefore those criteria that especially depend both on the amplitude and the spacing can be classified by those parameters. Due to the isotropic surface characteristic caused by the random powder distribution, this is an important attribute for suitable parameters. Figure 7 shows the two hybrid parameters Sdr/Sdq at different inclination angles of laser beam melted surfaces. For increasing angles the values of these parameters decrease.
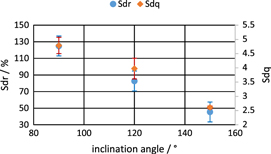
Figure 7. Mean values and error bars of the parameters Sdr and Sdq at different inclination angles of laser beam melted surfaces.
Download figure:
Standard image High-resolution imageSdr shows a correlation coefficient R2 of 0.931 and represents the ratio of the interfacial area increment of the scale limited surface within the definition area. The closed form is defined in (ISO 25178-2 2012).
Within this study, a discrete conversion was realized by the Mountains Map software, when calculating the surface parameters on the basis of the discrete measurement data. Sdr describes the complexity of the surface due to a comparison of the curvilinear surface and the support surface. Surfaces with a rough characteristic show a larger curvilinear area than a smooth one. In figure 8(a), the topography of a laser beam melted surface shows a certain roughness in all spatial directions. This is an explanation for the good correlation between this typical surface characteristic and Sdr. But due to the differentiation in the definition of Sdr (equation (1)), this parameter is quite sensitive to drop in or noise effects. In combination with the typical random surface characteristic of AM parts, the relative standard deviation of Sdr in this study was 17% concerning one surface orientation, which is still quite high.
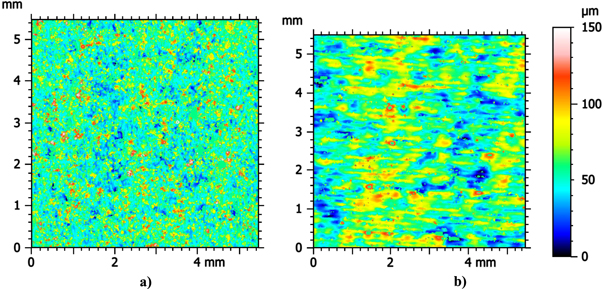
Figure 8. (a) Topography of a laser beam melted surface with values of 14.1 μm for Sa and 5.2 for Sdq. This surface was built with an inclination angel of 90°. (b) Topography of a laser beam melted surface with values of 14.6 μm for Sa and 2.7 for Sdq. This surface was built with an inclination angel of 150°.
Download figure:
Standard image High-resolution imageSdq shows a good correlation (R2 = 0.915) to the surface angle as well and describes the slope of the surface characteristic (ISO 25178-2 2012). An interesting point, when regarding Sdq, is that this parameter enables a consolidated analysis and classification of surfaces even when other parameters are not able to separate different surfaces from each other. Figures 8(a) and (b) shows two laser beam melted surfaces with almost identical values of the arithmetical mean height (Sa), but significant differences at Sdq. Like Sdr, Sdq also shows high relative standard deviations (up to 9%). Furthermore, Seewig (Seewig 2011) mentioned that the hybrid parameters are substantially influenced by the measurement instruments and a comparison of these parameters measured by several different sets is critical.
As a consequence, further analysis with a comparable approach as the parameter Sdr was performed to establish a more robust parameter set. The analysis is based on the fractal geometry; a term coined by Mandelbrot (Mandelbrot 1977) and which allows one to describe the complexity of a surface by the so-called fractal dimension. For the determination of the fractal dimension, first, each section of a surface area is enclosed by a box of a specific size. Next, the number of all of the boxes enclosing the whole surface area is calculated and plotted in correlation to the size of the boxes. This step is iterated with boxes of different sizes to draw a graph shown in figure 9(a).
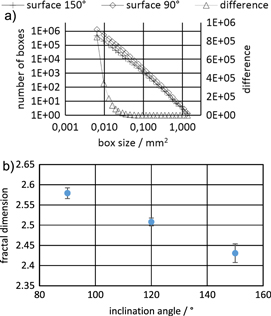
Figure 9. (a). Fractal analysis of 90° and 150° oriented laser beam melted surfaces. The subtraction curve illustrates the differences especially at small scales. (b) Fractal dimension (mean values and error bars) at different inclination angles of laser beam melted surfaces.
Download figure:
Standard image High-resolution imageThe fractal dimension derives from the slope of the regression line of the graphs in figure 9(a). Its mean values at different inclination angles of the laser melted parts are shown in figure 9(b). They show a correlation coefficient of 0.97 and a relative standard deviation of less than one percent. So the fractal dimension is a strong correlation parameter for the analysis of the inclination angle-dependent surface characteristic of laser beam melted parts.
Figure 10 shows another difference in the angle-dependent surface characteristics. The surface shown in figure 10(a) was produced with a build angle of 90°, the one in figure 10(b) with 150°. The isotropic surface character as a result of the powder-based production process can be seen in both pictures. But a closer look at the 150° surface reveals a periodic structure behind the isotropic surface layers. The classification of this specific structure was realized by the autocorrelation length Sal and the texture-aspect ratio Str.

Figure 10. (a) Close-up photograph of a laser beam melted surface, built with inclination angles of 90°. (b) Close-up photograph of a laser beam melted surface, built with inclination angles of 150°.
Download figure:
Standard image High-resolution imageThe calculation of these two parameters is based on the autocorrelation function (ACF). The ACF evaluates the correlation of a part of a surface with respect to the whole surface (Leach 2013) and is defined in ISO 25178-2:
Therefore it produces values between −1 and +1, whereas an ACF of +1 indicates a perfect correlation and zero indicates no correlation (Leach 2013). The general procedure concerning the calculation of the ACF is shown in figure 11. According to ISO 25178-3, a threshold of 0.2 was applied to the ACF to calculate Sal (Rmin in figure 11(d)) and Str (ratio of Rmin/Rmax in figure 11(d)).
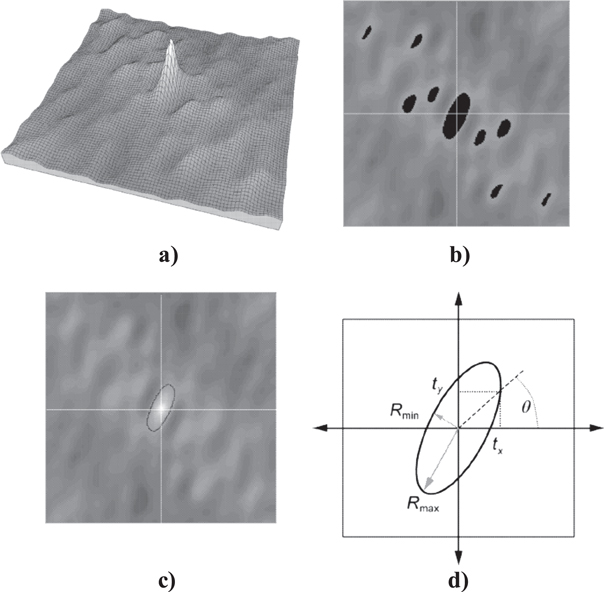
Figure 11. (a) ACF of the surface. (b) Thresholding of the ACF at a height s (the black spots are above the threshold). (c) Threshold boundary of the central threshold portion. (d) Polar coordinates leading to the Sal and Str in different directions. (ISO 25178-2 2012).
Download figure:
Standard image High-resolution imageThe surfaces of the laser beam melting test specimen, which were built with an inclination angle of 150° and are therefore characterized by a distinctive layer structure, have a Sal of 0.30 mm (s = 0.2, standard deviation 0.07 mm). The surfaces, which were built with an inclination angle of 90° and which don't show such a distinctive layer structure, have a Sal of only 0.06 mm (s = 0.2, standard deviation 0.006). The difference between theses surfaces and their Sal values is caused by an extended central lobe of the ACF (figure 12) due to the dominant textures of the 150° surfaces, caused by the layer-wise production process.

Figure 12. (a) Plot of the ACF of the surface shown in figure 10(a). (b) Plot of the ACF of the surface shown in figure 10(b). The extended central lobe in figure is caused by the distinctive layer structure of the surface built with an inclination angle of 150°.
Download figure:
Standard image High-resolution imageBased on the ACF and Str, the surface characteristic 'isotropy' was calculated by the ratio between the minimum and the maximum radii measured on the central lobe of the autocorrelation plot, as shown schematically in figure 13.
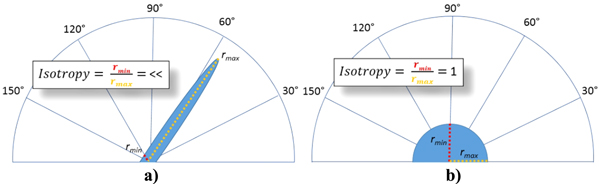
Figure 13. Schematic illustration of the ACF central lobe of an anisotropic (a), and isotropic (b) surface.
Download figure:
Standard image High-resolution imageIsotropic surfaces have an isotropy value near 100% whereas anisotropic surfaces, which represent a main direction, have a value near 0%. It is obvious that with an increase of the inclination angle within the upskin area the isotropic surface's characteristic decreases. The surface with an inclination angle of 90° (figure 10(a)) shows a high isotropic character (93.5%). The surface with a build angle of 150° (figure 10(b)) represents the typical surface characteristic of a layer wise production process. It has a lower isotropy (47.8%) due to the vertical layer distribution.
A comparison between a laser sintered and laser beam melted surface, each manufactured with an angle of 150°, shows that the significant surface structure is much more distinctive in the laser beam melting process. One reason is the difference in layer thicknesses between the two processes. While the laser beam melting process performs with values between 20 and 60 μm, the laser sinter process shows significantly higher values between 100 and 120 μm due to the different powder particle sizes. As a result, the level of detail of the typical surface characteristics of laser beam melted surfaces is much higher than that of the laser sintering process (figures 14(a) and (b)).
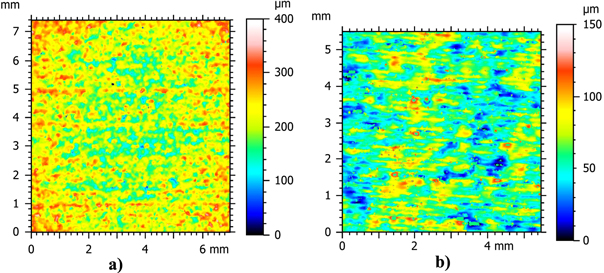
Figure 14. (a) Topography of a laser sintered surface built with an inclination angle of 150°. The large particle size and layer thickness lead to a surface characteristic with less details (scale 0—400 μm). (b) Topography of a laser beam melted surface built with an inclination angle of 150°. The small particle size and layer thickness lead to a surface detailed characteristic (scale 0—150 μm).
Download figure:
Standard image High-resolution imageAs a result of this less detailed surface structure, the isotropy parameter is not suitable for a reasonable correlation in the laser sintering process and showed a correlation coefficient of just 0.09 within this study. In contrast to that, the parameters Sdr and Sdq analyzed before have acceptable correlation coefficients around 0.6 and enable a separation especially between upskin and downskin areas, which is shown in figure 15.

Figure 15. Mean values of Sdr and Sdq and error bars at different inclination angles of laser sintered surfaces. For the downskin surfaces, the values are at an almost constant level.
Download figure:
Standard image High-resolution imageFor angles ≤90° (downskin), there is a quite stable level of Sdr and Sdq while the values increase for increasing build angles above 90° (upskin). An explanation for this plateau is the heat transfer of the laser beam on the loose powder particles which are located close to the laser scan areas (Pham et al 2008). Especially near overhang/downskin regions, the energy of the laser is also absorbed by these loose and pre-heated powder particles and binds them to the surface (figure 16), which creates a structure with weaker contours due to the filleting effect of these particles (Bacchewar et al 2007). This affects all surfaces with an inclination angle ≤90°. For surfaces with a build angle exceeding 90°, the energy of the laser is absorbed by former layers of the part and the surface gets a more angled dependent characteristic.
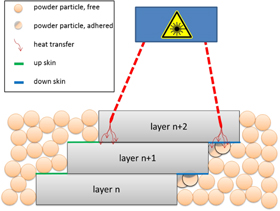
Figure 16. Phenomenon of adhesive powder particles on downskin and vertical surfaces, caused by the heat transfer of the laser energy into the powder.
Download figure:
Standard image High-resolution imageThe aforementioned results show that it is more difficult to find a strong correlation between the surface characteristic and surface parameters for the laser sintering process than the laser beam melting process. Nevertheless, both surfaces are characterized by an isotropic character with an additional specific surface structure, which depends on the inclination angle.
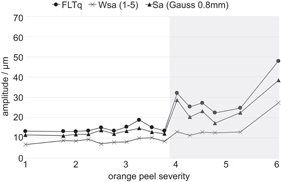
With regard to the laser sintering specific surface effect of orange peel, the root mean square flatness (FLTq, Gaussian low pass filter 0.8 mm, R2 = 0.81), the arithmetical mean height (Sa, Gaussian low pass filter 0.8 mm, R2 = 0.81) and the waviness characteristic value Wsa (1–5) (R2 = 0.69) showed a good correlation concerning the orange peel severity (figure 17).
Figure 17. Amplitudes of surface parameters (mean values determined within every grade) at different grades of orange peel severity (mean values of the expert evaluation). The shaded region represents the unacceptable severity.
Download figure:
Standard image High-resolution image
FLTq is defined in ISO 12781-1 and describes the root mean square flatness (ISO 12781-1 2011):

Due to its definition, it is a reasonable classification parameter, because a surface which is not characterized by an orange peel effect shows a much flatter topography than a peeled one. The squared term in equation (3) intensifies the influence of the orange peel severity and therefore FLTq is the parameter with the strongest correlation found within this study. Evaluating FLTq with regard to the orange peel severity, a Gaussian low pass filter of 0.8 mm is essential for a reasonable correlation. FLTq values with other filter wavelengths all showed lower correlation coefficients.
Sa is the arithmetical mean height evaluated over the three-dimensional surface and is defined in (ISO 25178-2 2012):

Due to the similarity to FLTq, a good correlation between the Sa values and the orange peel severity was expected and the curves of both parameters show a comparable course (figure 17).
The study that was performed also analyzed the conventional two-dimensional parameters. Because of the similar definition of Sa to Wa, the latter could be an alternative to the orange peel classification if an areal measurement is not possible. But it is important to mention that the more single profiles of Wa are measured, the better the classification becomes (see also (Grimm et al 2014)).
The good correlation of the parameters FLTq and Sa with a Gaussian low pass filter of 0.8 mm is also an explanation for reasonable results concerning the parameter Wsa (1–5), which is defined in (SEP 1941: 2012) and is calculated with a band pass filter between the wavelength of 1 and 5 mm.
As a conclusion of this parameter set, the orange peel effect of laser sintered surfaces shows its specific characteristic within the wavelengths of 0.8 mm up to 5 mm, which should be considered, when analyzing this surface effect.
If we define all of the orange peel surfaces in this study with a grade lower than 4 as not acceptable, a limit of 20 μm for FLTq (Gaussian low pass filter 0.8 mm), 15 μm for Sa (Gaussian low pass filter 0.8 mm) and 10 μm for Wsa (1–5) can be defined. The classification of the orange peel effect by the parameter Ra, suggested by Yusoff (Yusoff and Thomas 2008) could not be validated within this study (R2 = 0.3702).
5. Conclusion and outlook
The specific surface characteristics of AM parts need special analysis techniques and parameters. Within this study, it has been proved that an optical three-dimensional topography measurement, realized with a confocal microscope, offers the opportunities of a higher statistical significance compared to state-of-the-art tactile profilometry. In particular, the surfaces of laser beam melted parts showed quite strong correlations between the surface orientation and the areal parameters or analysis techniques, respectively. The parameters Sdr and Sdq are suitable for classification, even if the other parameters don't show any differences. Due to high standard deviations of the hybrid parameters, the fractal dimension is usable for a robust classification as well as the spatial parameters based on the ACF. The surfaces of laser sintered parts are more difficult to classify due to a lower level of detail of the typical surface effects. Nevertheless, the quantification of the orange peel severity in laser sintering by the surface parameters FLTq, Sa and Wsa (1–5) is possible. This laser sinter specific surface effect should be analyzed with Gaussian low pass filters of 0.8 mm.
However, future investigations are intended to intensify the proposed correlations. Therefore the authors will perform further analysis of areal parameters measured with a confocal microscope. Future aims will be a correlation between the azimuth angle φ and surface parameters as well as a classification of the so called 'balling' effect of laser beam melted surfaces. Furthermore, a correlation analysis between surface parameters and mechanical properties, and therefore the part's function, will be performed, because in general the establishment of functional correlations is one of the principal objectives of research in surface metrology (Brown 2013).
An automated inspection process by a confocal microscope, which is mounted on a robot arm, will complete this new approach, so the project will lead to a robust quantification of the external surfaces of AM parts and make a further step towards quality assurance in AM.
Acknowledgements
The authors would like to thank the Federal Ministry of Economics and Technology of Germany, for funding the research within the project 'Development of an intuitional on-demand control process for the areal characterization of additive manufactured surfaces'.