

Abstract
The need for engineering components with suitable functionality under harsh wear and aggressive environment subjected to high risk of deterioration, has led to the demand for surface treatment processes and high-performance materials. Ti-6Al-4V is one of the mostly used titanium alloys with more than 70% of the industrial applications in the aerospace, marine and automotive industries. Despite the exceptional properties of Ti-6Al-4V alloy, their low hardness, high susceptibility to corrosion, poor thermal stability and poor tribological properties have limited their viability in the field of engineering. In this research, laser metal deposition technique by incorporating quasicrystalline Al–Cu–Fe coatings can be very beneficial in enhancing the surface properties of Ti-6Al-4V alloy. A 3 kW continuous wave ytterbium laser system (YLS) attached to a KUKA robot which controls the movement of the cladding process was utilized for the fabrication of the coatings. The titanium alloy cladded surfaces were investigated for its microstructure, mechanical and wear resistance properties at different laser processing conditions. The obtained results illustrated that geometrical properties height and width of the deposit increase with an increase in laser power. Increase in scanning speed results in a decrease in the geometrical properties. Ti reacted with increased amount of Al and Fe and less amount of Cu powders to form Al2Ti, Fe0.975Ti, Al0.9Fe3.1Ti0.025 and AlCu2Ti. The optimum performances were obtained for an alloy composition of Ti-6A-4V/Al-Cu-5Fe composite, at laser power of 800 W and scanning speed of 1.0 m min−1. Its performance enhancement compared to the unprotected substrate comprised a significant increase in hardness from 302 to 2740 HV which translates to 89.14% in hardness values above that of the substrate. Coatings with higher hardness levels were achieved mainly due to the larger fraction of hard-intermetallic phases at lower laser scanning speeds. Finally, Ti-6Al-4V/Al-Cu-5Fe coating at laser power of 800 W and scanning speed of 1.0 m min−1 shows the highest wear resistance performance compared to the substrate. Ti-6Al-4V/Al-Cu-5Fe coating was 2.8 times the wear resistance performance of the substrate.
Export citation and abstract BibTeX RIS
1. Introduction
Titanium and it alloys are material of choice in a wide range of industrial applications owing to high strength-to-weight ratio, exceptional biocompatibility and corrosion resistance. These properties are obtained as a result of allotropic property possessed by these materials which is dependent on temperature and the effect of alloying on phase stability [1, 2]. However, poor tribological and low micro-hardness properties possessed by these materials hinder the extent of applications where the above-mentioned properties are required [3, 4]. Attar et al [5] reported that these setbacks can be addressed by employing laser deposition process which has the ability to enhance strength and micro-hardness. Material engineers have continued to develop new and existing fabrication techniques in pursuit of improving or entirely replacing the conventional energy intensive, environmentally hostile and expensive methods [6–9]. The microstructures of titanium alloys are primarily described by the amount and arrangement of α and β phases. The microstructures and mechanical properties of titanium alloys depend upon the processing history and heat treatment the material had gone through [10]. To obtain fine microstructure, high cooling rate is however advised; the use of lasers as a modification tool for materials however makes this possible.
Conventional aluminium alloys are broadly used for good mechanical properties and moderately light weight. Right selection of alloy for a given application requires deliberations of its ductility, density, tensile strength, weldability, formability, and corrosion resistance properties [11]. The combination of aluminium with iron and silicon will always form brittle intermetallic phases that are harmful to mechanical properties of the aluminium alloy [12].
For decades, ternary Al–Cu–Fe system has been extensively investigated. It had been reported that the Al–Cu–Fe alloy exhibited a quasicrystalline structure with a five-fold symmetry even in a conventionally solidified state [13]. The task of improving the properties of iron-containing aluminum materials has attracted much attention [14]. Most of these structures are based in aluminum alloyed to transition metals. Due to a set of essential properties, reinforcement of aluminium alloy with transition metals like Cu, and Fe is a promising application for these structures [15]. The composition of this phase, when formed, depends on the alloy composition, in addition to the composition of the co-existing phases [13].
As the variety of base metallic elements forming quasicrystals is wide, the range of alloying elements is even broader. But, the alloying elements are not easily available, often toxic or very costly. Al–Cu–Fe alloys are an exception; these alloys are interesting due to their lack of toxicity, easy availability and the favourable costs of their alloying elements [16]. Al–Cu–Fe quasicrystals show a five-fold symmetry and are, thus, icosahedrally structured. Thermal spaying technique had been used in the past to fabricate Al–Cu–Fe quasicrystalline alloy by emphasizing on the surface properties. However, the room-temperature brittleness is a set-back for this technique. [17]. According to Dmitrienko et al [18], quasicrystals consist of large atomic clusters in a melt state, while the degree of clustering is decreased in the quasicrystal solidification process. During nucleation, the local atomic order is supposed to be similar to that found in crystalline materials, whereas the quasiperiodic long-range structure develops during the growth process according to statistical and energetical criteria [18]. Thus, not surprisingly, the driving force for quasicrystal formation is suggested to be the minimization of the system free energy [19, 20]. With optimum laser processing parameters, a reliable coating that is free of cracks and pores can be produced on the matrix. The present study investigates the microstructural analysis, micro-hardness and wear resistance properties of Al–Cu–Fe quasicrystalline coatings on Ti-6Al-4V alloy.
2. Experimental details
2.1. Materials specifications and sample preparation method
The substrate material used in the present investigation was Ti-6Al-4V alloy with the chemical composition (wt%) 6.2 Al, 3.9 V, 0.2 Fe, 0.12 C, 0.15 O, 0.005 N, 0.0003 H and Balanced Ti. The substrate was cut and machined into dimensions 70 × 70 × 4 mm3. Prior to laser treatment, the substrates were sandblasted, washed, rinsed in water, cleaned with acetone and dried at room temperature before exposure to laser beam to minimize reflection of radiation during laser processing and enhance the absorption of the laser beam radiation. Al (99.8% purity), Fe (99.97% purity), Cu (99.9% purity), reinforcement metallic powders were used as alloying powders mixed in Al-3Cu-5Fe (A1), Al-3Cu-7Fe (A2), and Al-3Cu-10Fe (A3) ratios, respectively, in a shaker mixer (Turbular T2F; Glenn Mills, Inc.) for 18 h at a speed of 49 rpm to obtain homogeneous mixture. The particle shape of the powder used was spherical with 50–105 μm particle sizes. Samples were characterized for SEM and energy dispersive spectroscopy (EDS) analysis. Specimens for SEM (JSM-7600F; JOEL, Ltd) were prepared by cutting samples in such a way to reveal the transverse section of the coatings. While the microhardness was measured using four indentations and the average microhardness was recorded (figure 1).
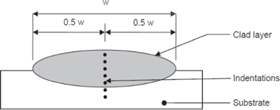
Figure 1. Placement of indentations [21].
Download figure:
Standard image High-resolution imageLaser surface alloying was performed using a 3 kW continuous wave (CW) Ytterbium Laser System (YLS) controlled by a KUKA robot which controls the movement of the nozzle head and emitting a Gaussian beam at 1064 nm. The nozzle was fixed at 4 mm from the steel substrate. The admixed powders were fed coaxially by employing a commercial powder feeder instrument equipped with a flow balance to control the powder feed rate. The metallic powder was fed through the off-axes nozzle fitted onto the Ytterbium fibre laser and it was injected simultaneously into a melt pool formed during scanning of the Ti-6Al-4V alloy by the laser beam. An argon gas flowing at a rate of 2.0 L min−1 was used as a shielding gas to prevent oxidation of the sample during laser surface alloying. Overlapping tracks were obtained by overlapping of melt tracks at 70%. To determine the best processing parameters, optimization tests were performed with the laser power of 800 to 900 W and scanning speed varied from 0.6 to 1.2 m min−1. The final selection criteria during optimization tests was based on surface having homogeneous layer free of porosity and cracks determined from SEM analysis. The optimum laser parameters used was 800 and 900 W power, a beam diameter of 4 mm, gas flow rate of 2.0 L min−1, powder flow rate of 2.0 g min−1 and scanning speeds of 1.0 and 1.2 m min−1 respectively.
3. Results and discussion
3.1. Microstructural analysis
Figure 2 illustrates the grain structure of titanium alloy. The average grain size is approximately 76 μm. The microstructure of substrate is represented by light and dark regions indicating two phases namely the alpha (α) and beta (β) phase that are equally distributed through the area of the substrate as shown in figure 2. This is the basic structure of titanium substrate that is used in this investigation.
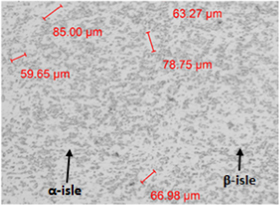
Figure 2. Substrate (Ti-6Al-4V) microstructure.
Download figure:
Standard image High-resolution imageThe high-resolution microstructure is achieved through SEM. Figure 3 illustrates the high magnification of composites formation and the bonding between the coating and the substrate at laser power of 800 W and scanning speed of 1.0 m min−1. Various phases that are differentiated by their colour and shape can be observed. Analysing figure 3, the lath-shaped Al3Fe monoclinic λ−phase can be found throughout the clad. The solidification mechanism is due to laser beam interaction, the coating powder particles melt and create a liquid pool on the titanium (substrate) surface that undergoes a limited melting [22]. Therefore, only small dilution of addition elements is obtained. Solidification begin with formation of some large particles such as Al and Fe. Since Cu is well known as a strong β-stabilizing element, it can be observed that atomic migration of Cu into Ti lattice results in the β-Ti phase formation during cooling and travels a longer distance in the Ti lattice than other elements which opens more crystallographic structure of the β matrix [22]. Aluminium and copper alloys are not really perfect materials for process of LMD due to lower absorption of photons and high reflectivity as compared to LMD friendly materials such Fe based alloys. Thus, aluminium and copper powder are coated with Fe for better photons absorption resulting in better deposit quality. This alternate layer morphology demonstrates the presence of eutectic phase in the inter-dendritic regions. It is found that low solidification velocity and high thermal gradient at the bottom of melt pool and above the solid/liquid interface results in the presence of columnar dendrites. An equiaxed microstructure is developed from middle to top section of the composite and this due to high solidification velocity and low thermal gradient at the upper part of the melt pool. This is well known phenomenon in rapid solidification [23].
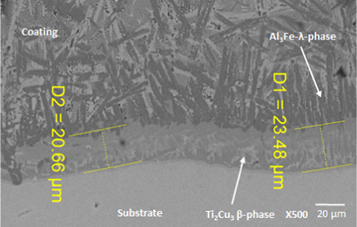
Figure 3. Microstructure of Al-Cu-5Fe at Laser Power of 800 W and Scanning Speed of 1.0 m min−1.
Download figure:
Standard image High-resolution imageFigures 4 and 5 represent the microstructure of Ti6Al4V/Al-Cu-10Fe and Ti-6Al-4V/Al-Cu-7Fe composites. It illustrates the microstructures of Ti6Al4V/Al-Cu-10Fe composites at laser power of 800 and 900 W respectively. In this region, where Fe concentration is highest, the incident heat and photons from melt pool initially interact with the Fe coating and absorbed heat energy conducted through the core and gradually interacts with titanium and aluminium. The microstructure shows a classic ferrite equiaxed grain and it is elongated nearly along the direction of cooling due to the high rate of cooling in rapid solidification [23–26]

Figure 4. Microstructure of Ti6Al4V/Al-Cu-10Fe composite at laser power of (a) 800 W (b) 900 W at 1.0 m min−1.
Download figure:
Standard image High-resolution image
Figure 5. Microstructure of Al-Cu-7Fe at Laser Power of 800 W and Scanning Speed of 1.0 m min−1.
Download figure:
Standard image High-resolution imageIt can be observed that laser power has significant influence on microstructure of these composites. Increasing laser power increases the columnar grains as well as the dendritic microstructure. At lower laser scanning speed under constant laser power, the microstructure is coarse but by increasing laser scanning speed, the microstructure is refined. However, at very high laser scanning speed, it results in cracking susceptibility and an increase in temperature gradient of interface such as figure 4(b). These cracks propagate through the grains and on the grain boundaries and have no regularity. They initiate on the solidification stage in the HAZ (heat affected zone) of adjacent tracks (under layers) or on the grain boundaries indicating that there are high stresses in the cooling and solidification zones as well as in the HAZ zone which provides propagation and origination of cracks. It is evident that an increase in laser power results in an increase in degree of melting therefore, decreasing low fusion porosity indicating that the quantity and size of pores were reduced. The coating is directly deposited on high thermal conductive Ti6Al4V substrate solidifying the melt very rapidly with significantly high cooling rate and undercooling thus, few pores were formed.
3.2. Electron dispersive spectroscopy (EDS)
EDS was utilised to analyse the element concentration distribution along the transition composition route. Figure 6 illustrates the number of elements at different scanning speed and laser powers. It can be observed that there was higher number of titanium and aluminium presented as per the theoretical expectation. The diffusion of all these elements are due to high-temperature gradients and multiple heating in laser metal deposition.
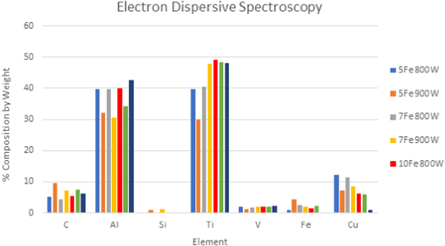
Figure 6. EDS Graph.
Download figure:
Standard image High-resolution imageThere is a proportional relationship between laser power and geometrical properties of the clad. Increasing laser power will increase the clad and HAZ height of the coatings. This was expected in accordance with the literature review; an increase in laser power increases the clad height. This takes place due to the laser-material interaction during the laser metal deposition. The un-melted powder particles initially travel through the laser beam before landing into the melt zone. This causes powder to melt before reaching its melt-pool however it reduces some of the laser power, which means less power is available to melt the substrate. This causes a narrower melt pool to be created indicating that the width of the clad would also be narrower. This can be seen by analysing the graph of deposit height and width vs laser power (figure 7). At laser power of 800 W, the width is smaller but by increasing laser power to 900 W, there will be a direct increase in the energy input level that allows for more power to be available for the melt pool to be created and therefore width becomes wider. The height of the clad however continue to increase due to sufficient energy to melt the incoming powder particles on the substrate. Hence, it can be understood that the influence of laser power on the clad width is comparatively more significant than its influence on the clad height [27, 28]

Figure 7. Graph of Deposit Height and Width vs Laser Power.
Download figure:
Standard image High-resolution imagePlotting the graph of deposit height and deposit width as a function of scanning speed (figure 8), it can be seen that these geometrical properties decrease with increasing scanning speed. This is due to a decrease in the amount of powder delivered per unit length, a reduction in the interaction time between the laser and the substrate as well as the energy input per unit length. It is evident that an increase in laser scanning speed results in an increase in aspect ratio. This is due to the fact that increasing laser scanning speed decreases the clad height while it has a slight effect on the clad width. Hence, it can be understood that the influence of laser scanning speed on the clad height is comparatively more significant than its influence on the clad width. It can be concluded that increasing laser scanning speed decreases the efficiency of powder. This is due to the width of melt pool becoming narrower as the powder efficiency decreases and laser scanning speed increases. Therefore, it reduces the possibility of powder catchment as a result of an increase in less favourable impact conditions (Liquid particle-solid substrate) or un-favourable impact conditions (Solid particle-solid substrate) [29].

Figure 8. Graph of Deposit Height and Width Vs Scanning Speed.
Download figure:
Standard image High-resolution imageThe morphologies of the laser cladded samples (figure 4) displayed different characteristics as a result of varied laser power and different cooling rate. Also, there is a difference in the heat affected zone (HAZ) bands. Observation shows a decrease in the grain size of the microstructure with the increase in processing scan speed within the coatings. As regards to solidification and formation of dendrites as evident in figures 4(a) and (b), when the laser scanning speed is low (1.0 m min−1), samples engage with the absorbed heat for a longer period of time and the cooling rate is slower, therefore grain growth takes a longer time to its own accord and consequently resulting in coarse microstructures and larger band of the HAZ [30]. However, at higher scanning speed (1.2 m min−1), the interaction time with the absorbing energy of the substrate are reduced. Consequently, this result in high cooling rate and a corresponding rapid nucleation rate yielding smaller sizes of grains after solidification. Simultaneously, The HAZ of high scanning speed samples showed a thinner band as compared to low scanning speed samples. The results can be related to the works of Qin et al [31] and Chen et al [32]. Thus, it can be agreed that the grain sizes of the cladded samples can be refined by increasing the scanning speed. The dendritic and inter-dendritic structures are also observed from the matrix. At high laser scanning speed during cladding, the cooling rate of the melt pool is very high, resulting in larger dendrite arm spacing as growth is observed towards the substrate (figure 4). Thus, it is well observed that the fast cooling rate resulting in fine dendritic microstructure and low dilution increased the micro-hardness properties of the coating [33]. Conversely, at lower scan speed (1.0 m min−1) coarse microstructure with longer interaction time is exhibited. Furthermore, it was also observed at figure 4 that laser induced thermal stress occurred at the transition zone leading to formation of cracks.
3.3. XRD analysis
The XRD results for Ti6Al4V/Al-Cu-5Fe and Ti6Al4V/Al-Cu-10Fe composites at different laser power and scanning speeds are shown in figures 9 and 10 respectively. Analysing Ti6Al4V/Al-Cu-5Fe graph, it was found that due to the effect of dilution, a part of Ti entered into the molten pool from the substrate. The results indicate that Ti, Al3Ti, Ti3Al, CuTi2 is formed through the in situ metallurgical reactions during the laser metal deposition process. This was expected in accordance with the results achieved from EDS (figure 6) and SEM (figure 3) analyses. It can be observed that no Fe seems to be presented as laser power and scanning speed increase to 900 W and 1.2 m min−1 respectively. Increasing laser power and scanning speed will significantly increase the diffraction peak of Ti and Ti3Al. Since there is no indication of Fe or Cu, Al and Ti concentration is highest which leads to the formation of titanium aluminide (Ti3Al) and presence of α & γ phases. Evaluating Ti6Al4V/Al-Cu-10Fe graph (figure 10), it is evident that the elemental Ti peaks were not observed. This indicates that Ti reacted with increased amount of Al and Fe and less amount of Cu powders to form Al2Ti, Fe0.975Ti, Al0.9Fe3.1Ti0.025 and AlCu2Ti. Increase in amount of Al and Fe and decrease in amount of Cu results in a change from fcc structure to a combined fcc and bcc structure. Thus, Al and Fe promotes bcc phase formation while Cu promotes fcc phase formation. Aluminium has a larger impact on causing the change in this structure.

Figure 9. XRD Spectra of (a) Al-Cu-5Fe 800 W 1.0 m min−1 (b) Al-Cu-5Fe 900 W 1.2 m min−1.
Download figure:
Standard image High-resolution image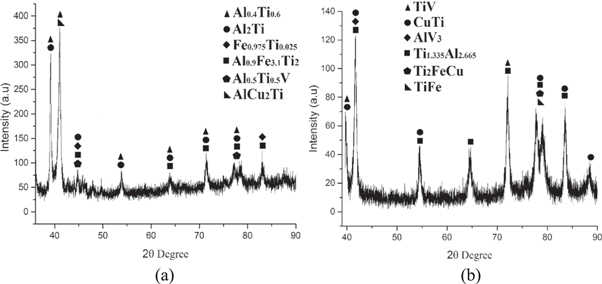
Figure 10. XRD Spectra of (a) Al-Cu-10Fe 800 W 1.0 m min−1 (b) Al-Cu-10Fe 900 W 1.0 m min−1.
Download figure:
Standard image High-resolution imageCrystalline phase with dissolved copper were found in the XRD. Quasicrystalline phases were also formed. The crystallization of the quasicrystalline phases occur during isothermal heat treatment. Rapidly solidified alloys are mainly composed of a solid solution of alloying elements and stable phases whose presence depends on the content of alloying elements. Rapid solidification leads to the formation of stable intermetallics and quasicrystalline phases. Attractive mechanical and wear properties are the attributes of quasicrystalline Al–Cu–Fe alloys. These properties can offer huge potentials of industrial applications. At the interfacial zone between the substrate and the coatings, partial melting occurred, and the heat slightly affect the substrate. There was minimal dilution due to existence of melting of thin zone at the substrate. Despite the minimal dilution and melting, there was metallurgical bonding formation between the substrate and the coating. The enhancement in hardness had been reported to be due to solid solution strengthening as a result of titanium concentration in copper. The intermediate and outermost layers consist of TiCu and Ti2Cu intermetallic phases. Ti3Al has also been reported to have improved wear resistance properties [34].
3.4. Microhardness
The hardness values were recorded at different points on the intermetallic section where formation of the composite takes place. Then the average of these values for each sample were recorded. Figure 11 illustrates the microhardness of Ti6Al4V/Al–Cu–Fe coatings. At scanning speeds of 1.0 m min−1 and 1.2 m min−1, it is evident that the mean hardness value decreases with increasing laser speed. Ti6Al4V/Al-Cu-5Fe compared to other composites has the highest mean hardness value at laser power of 800 W. Higher percentage of Al and Cu and less amount of Fe can increase the hardness at lower laser power. It was found that the lowest hardness value appears in the region of Ti6Al4V substrate and as moving along the direction of deposition, the hardness value begin to increase significantly. This non-linear increase is due to the diffusion of the coating and discrepancy between unmelted and resolidified coating hardness. It is seen that by using high laser power cooling rate decreases, thereby forming coarse dendrites that reduces the hardness.
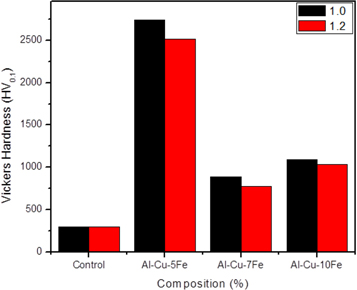
Figure 11. Hardness graph of Al–Cu–Fe at 800 W, 1.0 and 1.2 m min−1 scanning speeds.
Download figure:
Standard image High-resolution imageHowever, this is not true for Ti6Al4V/Al-Cu-7Fe and Ti6Al4V/Al-Cu-10Fe composites (figure 12). It can be seen that for both scanning speed of 1.0 m min−1 and 1.2 m min−1, the mean hardness value increases with increasing laser power. In this case, at the start of material deposition, the heat rapidly dissipated by the substrate heat conduction. At the beginning stage of the LMD process, the initial thermal transience produced a rapid quenching rate effect which resulted in hardness to increase. It can be observed that the mean hardness value increases with increasing laser power and this is due to the limited interaction within the powder and the laser; only a low amount of energy was supplied during the melting process. This low energy limited the amount of time available for growth, thus increasing the hardness. It is evident that both composites have the highest mean hardness values at higher laser power (900 W) and lower scanning speed (1.0 m min−1).
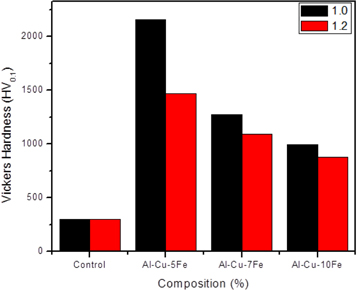
Figure 12. Hardness graph of Ti6Al4V/Al–Cu–Fe Coatings at 900 W, 1.0 and 1.2 m min−1 scanning speeds.
Download figure:
Standard image High-resolution imageAl2Ti, had been reported to be practically overlooked. Al2Ti, like Al3Ti, possessed lower density and better oxidation resistance compared to Ti3Al and TiAl based alloys as reported in the literature [24, 34]. Al2Ti produces material with a finer microstructure, a higher hardness, and increased resistance to room temperature cracking as shown in figure 10.
3.5. Wear analysis of the Al–Cu–Fe coatings
Figures 13 and 14 depict the graphs of coefficient of friction (COF) and wear depth (WD) as a function of time for the substrate and composites respectively. This is accomplished at different laser power and scanning speed. Evaluating the graphs of COF vs time for the composites and substrate, it can be observed that COF suddenly reaches its maximum for all the graphs and as the time begins to increase, the COF values start oscillating within that limits with increase in time. However, this is not true for the graph of wear depth vs time as it is evident that the wear depth increases gradually with increasing time. Ti6Al4V/Al-Cu-5Fe composite has the lowest coefficient of friction. This was expected in accordance with results obtained from hardness testing; high mean hardness value result in low coefficient of friction and low wear rate. This also implies that Ti6Al4V/Al-Cu-5Fe can be used in the aerospace industry for components such as engine turbine blades and bearings. Wear depth begins to increase as there is an increase in Fe concentration (figures 14 and 15). This can be seen from the graphs of wear depth vs time, the wear depth values for both the substrate and Ti6Al4V/Al-Cu-5Fe composite is lower than 0.025 mm and for the Ti6Al4V/Al-Cu-7Fe & Al-Cu-10Fe composites are above 0.03 mm. Figure 15 presents the coefficient of friction (COF) with sliding time of reinforced admixed laser clad Al–Cu–Fe metallic coatings and as-received Ti-6Al-4V alloy. The test was carried out under conditions of dry sliding situation of a load of 15 N at a sliding velocity of 2 m s−1 and 2 mm sliding distance using tungsten carbide ball. The entire samples were sectioned to dimensions 1 cm × 2 cm area that can be fixed securely in a fitted sample chuck. The coefficient of friction was recorded continuously during the test for duration of 1000s (17 min) of reciprocating movement. The pattern implied that the COF of Ti-6Al-4V alloy increased at initiation and later fluctuated.

Figure 13. Graph of Coefficient of friction and wear as a function of time for substrate (Ti6Al4V).
Download figure:
Standard image High-resolution image
Figure 14. Graph of Coefficient of friction and wear Depth as a function of time for Ti6Al4V/Al–Cu–Fe composite.
Download figure:
Standard image High-resolution image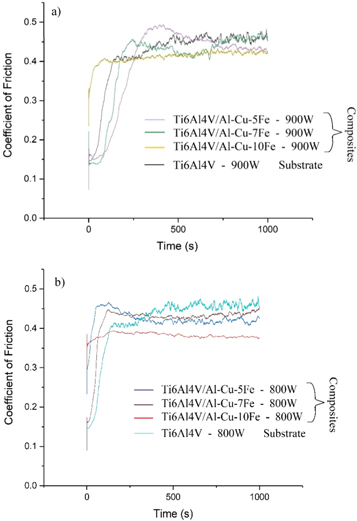
Figure 15. Graph of COF Vs Time for Ti-6Al-4V/Al–Cu–Fe Coatings at different laser power (a) 900 W (b) 800 W.
Download figure:
Standard image High-resolution imageFriction coefficients were observed to be reduced with the incorporation of the metallic coatings. Al–Cu–Fe ternary coatings exhibit the best wear resistance performance as a result of increased rate of solidification of laser deposited coatings which, in turn, produce matrices with smaller grain size. Consequently, the smaller the grain size the higher the resistance of the coating to deformation, which is according to the Hall-Petch equation [35]. Therefore, the reduced grain size of coatings with higher scan speeds enables the coatings to possess a reduced contact area of the coating surface with the steel ball, thus mitigating the smearing effect of the coatings on the steel ball. Lack of surface coating on the substrate is responsible for the high coefficient of friction recorded for the Ti-6Al-4V substrate.
The friction coefficient is calculated using the applied load and the frictional force, this is automatically done from the instrument by the following equation:

Where: μ = friction coefficient (dimensionless) Ff = Frictional force (N) and FN = Normal load (N)
Figure 16 shows the wear scar obtained during the wear test for the samples. According to Qu and Truhan [36], the wear depth Zw and wear volume of the flat specimen can be calculated with the following equations:


Where ZW = Wear depth; RS = Radius of spherical surface at both ends; W = Width of the wear scar VW = Wear Volume; LS = Stroke length
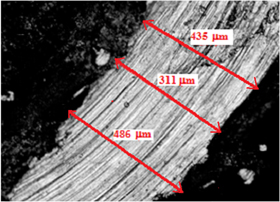
Figure 16. The wear track.
Download figure:
Standard image High-resolution imageGraphs of COF as a function of time (figure 15) for all the composites and substrate show a similar trend except at laser power of 900 W, the graphs have the steepest initial gradients and the Ti6Al4V/Al-Cu-10Fe composite has the least steep initial gradient.
The wear track for a Ti6Al4V/Al–Cu–Fe composite is illustrated in figure 16. The average wear track thickness is 410.7 μm. Wear thickness is an essential parameter used in industries to compute the wear rate, enabling to predict the life expectancy of a component that is subjected to wear.
The tribometer was used to measure the wear depth and COF while an optical microscope was utilized to measure the thickness of the wear track as shown in figure 16. The results obtained from wear track thickness is used in order to calculate the wear rate. However, comparing the calculated wear rate values lead to inaccurate results since the wear volume is not identical for all the samples. Unlike COF and wear depth, wear thickness increases with increasing laser power from this study. It can be observed that substrate has the highest wear thickness value compared to the Ti6Al4V/Al-Cu-5Fe, Al-Cu-7Fe and Al-Cu-10Fe. Reduction in wear thickness (figure 17) increases the contact stress. Ti6Al4V/Al-Cu-10Fe shows the highest wear thickness which indicates increase wear loss. However, adding higher amount of Fe into the coating can increase the wear thickness of the composite. Ti-6Al-4V/Al-Cu-10Fe coating displayed the highest wear thickness and it also indicates highest wear volume loss. There was wear reduction of 47.46%, 30.51% and 16.95% in Al-Cu-5Fe, Al-Cu-7Fe and Al-Cu-10Fe respectively. Al-Cu-5Fe coating shows the highest wear resistance performance compared to the substrate. Al-Cu-5Fe coating was 2.8 times the wear resistance performance of the substrate. Hence, the wear resistance performance of Ti-6Al-4V/Al-Cu-5Fe coating which also has the highest hardness is the best among all the ternary coated samples [37, 38].

Figure 17. Wear thickness results for the substrate and composites.
Download figure:
Standard image High-resolution image
The depth of groove and magnitude of delamination increases as the coating thickness increases, since the hardness of coating is a function of wear resistance. Formation of microcracks were observed in all the coatings but microcracks were more distinct in the highest coating thickness. This is because, the higher coating thickness has higher porosity and low micro-hardness values. The low-microhardness and high porosity in the coating results for the higher wear volume loss [39–46]. Therefore, the wear volume loss increases as the coating thickness increases.
4. Conclusion
- Well optimized process parameters and carefully chosen reinforcement materials fractions resulted in coatings with improved mechanical properties. Optimization of laser processing parameters lead to enhanced quality of the coatings, microstructural evolution and surface adhesion between substrate and reinforcement materials.
- The obtained results illustrated that geometrical properties height and width of the deposit increase with an increase in laser power. Increase in scanning speed results in a decrease in the geometrical properties. However, further increase in laser scanning speed results in cracking susceptibility and an increase in temperature gradient of interface.
- Ti6Al4V/Al-Cu-5Fe found to have higher mean hardness value compared to substrate and other composites which correlates with higher wear resistance and higher strengths. Ti reacted with increased amount of Al and Fe and less amount of Cu powders to form Al2Ti, Fe0.975Ti, Al0.9Fe3.1Ti0.025 and AlCu2Ti. This resulted in a change from fcc structure to a combined fcc and bcc structure. The wear resistance of titanium grade five alloy was improved by depositing hybrid quasicrystalline coating. Al-Cu-5Fe coating at laser power of 800 W and scanning speed of 1.0 m min−1 shows the highest wear resistance performance compared to the substrate. Al-Cu-5Fe coating was 2.8 times the wear resistance performance of the substrate.
Acknowledgments
The authors which to acknowledge the National Research Foundation (NRF) South Africa for their funding support.