

Abstract
We describe fabrication of ZnO-TiO2 nanocomposites with improved photocatalytic activity. The nanocomposite catalysts were synthesized by chemical co-precipitation approach encapsulating wurtzite ZnO nanoparticles (NPs) with anatase TiO2 shell. The TiO2 thickness was controlled by optimizing the weight ratios of ZnO to TiO2 to investigate the effect of TiO2 shell thickness on the photocatalytic properties of ZnO-TiO2 heterojunctions. ZnO NPs could be uniformly coated by TiO2 layers with desirable shell thicknesses. The band edge energy of the prepared nanocomposite catalysts indicated that the thickness of TiO2 layers could decrease the band gaps of the catalysts compared with the pristine ZnO NPs. The photocatalytic property of ZnO-TiO2 nanocomposites was evaluated by measuring photo-degradation of methylene blue (MB) in aqueous media. The all synthesized nanocomposite catalysts showed improved photocatalytic efficiency in comparison with the pristine ZnO NPs relevant to the red shift generated and higher absorption of photons in UV region. The photocatalytic also results revealed that the photo-activity performance of the samples were improved by increasing the shell thickness because of a decline in the measured band-gaps. The kinetic expressions with different orders were also studied and an appropriate model was demonstrated for the photocatalytic degradation process of MB.
Export citation and abstract BibTeX RIS
1. Introduction
Since the pioneer study on the photosensitization effect of a photoelectrochemical Pt-TiO2 electrode for hydrogen and oxygen production from water in 1979 [1], the development and application of nano-sized metal-oxide semiconductors such as SnO2, Cu2O, ZnO and Fe2O3 have attracted significant attention of researchers in the field of oxidative degradation of environmental organic contaminants [2–5]. Several strategies and techniques e.g. band-gap engineering, co-catalyst incorporation and surface engineering have been investigated to circumvent the restrictive barriers of these catalysts for the industrial applications including high recombination rate of photo-excited electron-hole pairs [6–9]. For example, Xu et al described in-situ synthesis of a novel plate-like Co(OH)2 decorated TiO2 nano-sheets with efficient H2 photocatalytic evolution activity [10]. Wang et al reported a co-catalyst for enhanced photocatalytic hydrogen evolution using TiO2 [11]. Lin et al presented an effective surface of disordered metal oxide nanocrystals to improve their photocatalytic efficiency [12]. However, apart from intricate approaches, these features are indispensable for practical applications because the synthetic procedures often necessitate expensive engineering processes.
Among the conventional solutions to overcome the short lifetime problem of photo-exciting charge carriers, an effective method is coupling of nanomaterials with different band-gap energies in heterostructures [13]. The precise alignment of the energy bands in heterojunction nanomaterials can improve charge separation efficiency by prolonging the lifetime of photo-generated excitons. To achieve this objective, Xu et al investigated the CoMoS2/rGO/C3N4 ternary heterojunction catalysts having high photocatalytic activity and stability for hydrogen evolution process under visible light irradiation [14]. In another study, Jiang et al introduced a two dimensional Z-Scheme AgCl/Ag/CaTiO3 nano-heterojunctions for photocatalytic hydrogen production enhancement [15].
While variable nanostructures have been developed to dominate the aforementioned problems, several research groups attempted to improve the photocatalytic performance of metal-oxide semiconductor nanomaterials by synthesizing dual core-shell nanostructures [16]. For example, Kwiatkowski et al prepared ZnO/TiO2 core/shell composites by sol-gel deposition of TiO2 on ZnO nanorods hydrothermally grown on electrically conductive indium tin oxide substrate (ITO) for photodecomposition of methylene blue (MB) [17]. Nadrah et al synthesized core@shell TiO2@SiO2 nanoparticles with photocatalytic activity featuring a significantly faster preferential degradation of model pollutant (rhodamine B) in presence of abundant concentration natural organic matter compared to pure TiO2 (P25) [16]. Abdel-Wahab et al presented the performance of photocatalytic degradation of paracetamol over magnetic flower-like TiO2/Fe2O3 core-shell nanostructures [18]. In another study, Vasilaki et al synthesized ZnO/TiO2 core-hell photocatalysts of a complex flower-like architecture to enhance photocatalytic performance and superhydrophilicity without UV irradiation [19]. In 2019, a stable Ta3N5@PANI core-shell photocatalyst was fabricated by Niu et al to investigate shell thickness effect on high-efficient photocatalytic performance and enhanced mechanism [20].
Liu et al prepared p-n heterojunction BiFeO3-TiO2 photocatalyst with and applied it for visible-light photocatalytic degradation [21]. According to positions of energy bands, the metal-oxide heterostructures can be defined as Type I (straddling gap), Type II (staggered gap), and Type III (broken gap) photocatalysts. Photo-excited charge separation can occur in staggered gap nano-sized heterojunctions in band-energy engineering, which can enhance the photocatalytic activity. The lowest energy states for photo-induced holes and electrons on opposite sides of the junction in staggered gap. Therefore, upon excitation, charge carrier pairs can migrate in the opposite direction and be enriched in both semiconductors [22].
Nanostructured titanium dioxide (TiO2) and zinc oxide (ZnO) are well-known n-type semiconductor materials with wide band-gaps (∼3.22 eV, and 3.37 eV, respectively) playing effective roles in electromagnetic energy absorption and photo-degradation of organic pollutants [18, 19]. Although, TiO2 and ZnO have similar band-gap energy values, the conduction and valence bands of TiO2 are located under the corresponding bands of ZnO (∼0.48 eV) [13]. Therefore, the difference of redox energy levels existing between the two metal oxides make them appropriate for the preparation of core-shell heterojunction nanostructures.
Although, there are several reports focusing on the synthesis of ZnO/TiO2 heterostructures including physical vapor deposition [23], microwave-assisted hydrothermal technique [24] and radio frequency sputtering [25], it is still very challenging to achieve photocatalysts with tunable structures via low-cost fabrication procedures. Among the previously published synthesis methods, the co-precipitation technique is a facile chemical process widely used for industrial production due to its cost effective practice [26]. Accordingly, Banavatu et al prepared γ-Bismuth molybdate (γ-Bi2MoO6) catalyst using co-precipitation method to evaluate photocatalytic degradation of Rhodamine-B, Crystal Violet and Orange II dyes under visible light irradiation [27]. Ayodhya et al prepared ZnS nanoparticles by co-precipitation method using various capping agents for their photocatalytic application in degradation of XO dye [28]. A research by Lassoued et al presented the synthesis and characterization of Co-doped nano-TiO2 through co-precipitation method for photocatalytic activity [29]. Moitra et al. reported a simple 'in situ' co-precipitation approach for preparation of multifunctional CoFe2O4-RGO nanocomposites suggesting an excellent microwave absorber and a highly efficient magnetically separable recyclable photocatalyst for dye degradation [30].
It is noteworthy that there are a few articles regarding the precise control of the shell thickness due to laborious synthesis requirements [31]. In the present work, we report the preparation of wurtzite ZnO/anatase TiO2 nanocomposite catalysts by a simple and effective chemical co-precipitation technique utilizing the advantages of heterojunctions with core-shell nanostructures. In addition, the optimum condition in photocatalytic performance was found by controlling the thickness of TiO2 layer. We also preformed precise studies to understand the role of charge carriers (electrons and holes) and the photocatalytic performance mechanism at heterojunctions.
2. Experimental section
2.1. Materials and characterization
Zinc acetate dihydrate [Zn (CH3COO)2, 99%], titanium isopropoxide [C12H28O4Ti, 97%], isopropyl alcohol [C3H8O, 99%], sodium hydroxide (NaOH, 99%), Hydrochloride acid and ethanol were procured from Merck. Water was deionized by a Nano Pure System (Barnsted). All the chemicals were analytical grade and used without further purification.
X-ray diffraction (XRD) patterns were obtained suing an Ultime IV Multipurpose x-ray diffractometer with Cu Kα1 (λ = 0.15406 nm) radiation to determine the crystalline phase of samples. Field emission scanning electron microscopy (FESEM, Zeiss SIGMA VP-500) and transmission electron microscopy (TEM, Zeiss-EM10C-100KV) were carried to study surface morphologies and size distribution of the prepared nanostructures. Particle sizes were also identified from FESEM and TEM images by Microstructure Measurement Software (ImageJ). The energy-dispersive x-ray spectroscopy (EDX) elemental maps were obtained using FESEM microscope (LEO-1525). Fourier transform infrared (FT-IR) measurements were characterized by a Perkinelmer BX-II instrument to investigate the chemical structure information of the nanoparticles. Optical properties were studied based on absorption spectra using an Avantes diffuse reflectance spectroscopy (Avaspec-2048-TEC) with AvaLamp DHS Setup.
2.2. Synthesis of ZnO/TiO2 nanocomposite photocatalysts
Figure 1 shows the overall synthesis procedure for the preparation of the ZnO/TiO2 photocatalyst. The process utilized to synthesize ZnO/TiO2 core-shell heterojunctions consisted of ZnO NPs synthesis by chemical co-precipitation method followed by TiO2 encapsulation. It is noteworthy that the thickness of the TiO2 shell can be tuned by controlling the amount of the titanium precursor. The fabrication procedure was completed by preparing ZnO/TiO2 nanostructures with different TiO2 shell thicknesses. In the first stage to synthesize the ZnO nanostructures, 1.0 M and 0.5 M of zinc acetate and sodium hydroxide were separately dissolved in deionized water (200 ml) and stirred for 30 min at room temperature. The obtained solutions were added drop-wise into an empty beaker under vigorous stirring. The resultant mixture was stirred for 2 h at room temperature to yield a white precipitate. In order to remove the impurities, the precipitation was centrifuged (4000 rpm) for 10 min, washed with deionized water and ethanol, and dried in an oven at 80 °C for 24 h. The dried powder was finally calcined at 350 °C for 2 h under air atmosphere to complete the process of acquiring ZnO NPs.
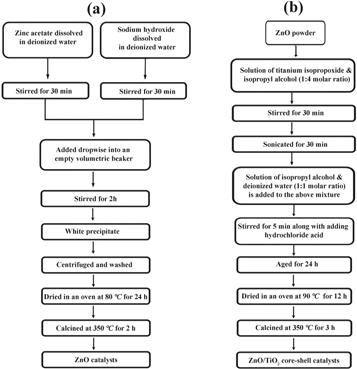
Figure 1. Procedure for the preparation of (a) ZnO NPs, and (b) ZnO/TiO2 nanocomposite catalysts.
Download figure:
Standard image High-resolution imageThe ZnO/TiO2 nanocomposite fabrication was pursued by a co-precipitation route utilizing a previously reported technique [32]. In a typical synthesis, 1 g of the prepared ZnO NPs was added into a solution including 15 g of titanium isopropoxide and isopropyl alcohol with a mole ratio of 1:4 and stirred for 30 min to fabricate core-shell nanostructures. The obtained mixture was sonicated for 30 min to disperse the ZnO NPs in alkoxide solution. A solution of isopropyl alcohol and deionized water with a mole ratio of 1:1 was added to the mixture under vigorous stirring to achieve a final molar ratio of 1:8:4 between titanium isopropoxide, isopropyl alcohol and deionized water. An acidic condition was achieved at pH ∼3 by adding HCl into the reaction mixture. It should be noted that optimizing an acidic solution is essential for the stability of TiO2 nanostructures [33]. The final mixture was aged by stirring smoothly for 24 h at room temperature. The then sample was centrifuged and dried in an oven at 90 °C for 12 h. The resultant solids were finally calcined at 350 oC in air for 3 h and to produce ZnO/TiO2 core-shell nanostructures. To tune the thickness of TiO2 shell, various weight portion of TiO2 to ZnO was applied. The nanocomposite catalysts could be prepared in weight ratios of 1:20 and 1:25 and were labeled as ZnO/TiO2-1/20 and 1/25.
2.3. Photocatalytic reactions
The photocatalytic activity of ZnO/TiO2 nanocomposite catlysts was evaluated by studying the degradation of methylene blue (MB) as a model dye in aqueous solutions under UV light irradiation. The utilized photocatalytic reactor consisted of two UV lamps with the radiance power of 18 W and the light intensity of 115 mW cm−2 (Philips) as light sources with wavelength of 320 nm illuminating aqueous solutions from the top. The photocatalytic reactor was kept inside a box made of medium-density fiberboard to eliminate the effect of the UV light background. In addition, the reactor was equipped with two fans to circulate the air and maintain the temperature. In a typical photocatalytic reaction, 0.04 g of the nanostructured catalyst was added into 250 ml of MB solution with an initial concentration of 10 ppm. To perform photocatalytic tests, alkaline solution with pH 8 was provided using NaOH. All samples were stirred under dark conditions for 20 min to ensure the establishment of an adsorption-desorption equilibrium between the surface of the prepared catalysts and MB. The MB de-colorization was evaluated using UV-Vis spectrophotometer (UV-Vis, Hach DR 5000). For this purpose, first at given time intervals (each 20 min), catalysts were centrifuged with a speed of 3000 rpm for 10 min and then filtered by a syringe filter in order to remove particles of used catalysts from the solution. The characteristic absorption peak of MB was monitored by UV-Vis spectrophotometer at λmax = 633 nm. The photo-degradation percentage was calculated by the following equation [34]:

Where  is the initial concentration of MB in mgl−1, and
  is final concentration at the irradiation time t (min). The kinetic of MB removal by ZnO/TiO2 nanocomoosites was studied by fitting the experimental data to Langmuir-Hinshelwood kinetics expressions given as [35]:

Where  is the MB concentration in mgL−1 at given time t (min). The parameter n indicates kinetic order, and
  is the decolorization rate constant for n-order. By substitution of n = 0, 1, and 2 into the equation (2), and the integration for boundary conditions,
  at
at  and
and  at
at  the following equations can be derived:


The Langmuir-Hinshelwood models linearized as equations (3)–(5) are best-known as zero, first and second-order kinetic models, respectively. Where  is considered as the MB concentration immediately after the adsorption-desorption equilibrium.
  is the rate constant of zero-order model in mg l−1 min−1,
 is the rate constant of first-order model in min−1 and
  is the rate constant of second-order model in L mg−1 min−1.
3. Results and discussions
XRD patterns of the pristine ZnO and ZnO/TiO2 nanocomposites are depicted in figure 2. The Miller indices related to TiO2 and ZnO planes are given by T and Z letters, respectively. The diffraction peaks related to ZnO nanostructure appeared in the XRD pattern are corresponding to (100), (002), (101), (102), (110), (103), (200), (112), (201), (004) and (202) planes, which are well indexed to hexagonal wurtzite structure of ZnO (JCPDS Card No. 36-1451). No impurity was observed indicating the high purity of ZnO NPs before TiO2 encapsulation. The XRD pattern of TiO2 coated ZnO NPs shows new phases related to ZnO/TiO2 nanostructure, which can be assigned as anatase TiO2 (JCPDS Card No. 21-1272). The peak intensities of TiO2 anatase phase are increased with increasing the weight portion of TiO2 to ZnO. The average crystallite size of ZnO NPs and ZnO/TiO2 nanocomposite photocatalysts was estimated by XRD patterns using the Debye-Sherrer's equation [32]. The mean crystal size of ZnO NPs was calculated to be ∼23 nm by the full width at half-maximum (FWHM) of the (101) peak in figure 2(a). The average crystallite size of ZnO/TiO2-1/15, ZnO/TiO2-1/20, and ZnO/TiO2-1/25 was obtained as ∼25 nm, ∼32 nm, and ∼35 nm, respectively, by the same method using dominant peak of (101) plane of anatase TiO2 (figures 2(b)–(d)). The results show an increase in the average crystalline size with increasing the weight portion of TiO2 to ZnO. Actually, the increase of the titanium precursor amount leads to the formation of thicker TiO2 nanostructures with bigger crystalline sizes.
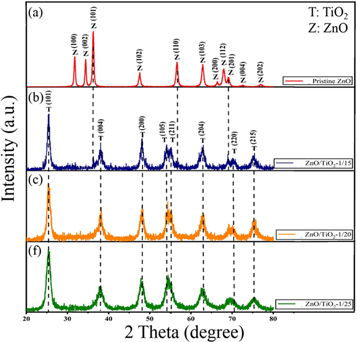
Figure 2. XRD spectra of (a) ZnO NPs, (b) ZnO/TiO2-1/15, (c) ZnO/TiO2-1/20, and (d) ZnO/TiO2-1/25 nanocomposite catalysts.
Download figure:
Standard image High-resolution imageThe EDX mapping of the prepared nanocomposite confirmed the uniform distribution and presence of the elements in the ZnO/TiO2 nanomaterials. The FESEM image (figure 3(A)) and EDX maps for the nanocomposite are exhibited in figure 3. The EDX maps illustrate the presence of the elements titanium (Ti), zinc (Zn), and oxygen (O) with a homogeneous distribution (figures 3(B)–(D)).
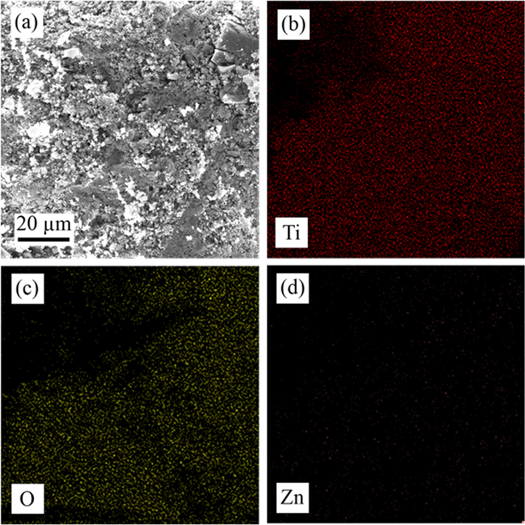
Figure 3. (a) FESEM image, and EDX mapping of (b) Ti, (c) O, and (d) ZnO/TiO2 nanocomposite catalyst.
Download figure:
Standard image High-resolution imageSurface of the ZnO NPs and ZnO/TiO2-1/15 nanostructures were studied in the wavenumber range of 400-4000 cm−1 by FT-IR spectroscopy. As indicated in figure 4(a), FT-IR analysis of the ZnO NPs illustrates several well-defined absorption peaks at 422.06 cm−1, 573.81 cm−1, 1447.71 cm−1, 1590 cm−1, 2358.15 cm−1, and 3435.90 cm−1. The characteristics peaks observed in range of 400–900 cm−1 belonging to typical Zn–O–Zn vibration caused by stretching vibration in ZnO lattice [36]. A strong absorption peak at 1447.71 cm−1 suggests the presence of the astatine functional groups in ZnO NPs [37]. The weak peak in the vicinity of 1590 cm−1 is also observed for the ZnO sample, which can be ascribed to H–O–H bending vibration mode due to surface–absorbed water. The water molecules can be absorbed on the ZnO surface appearing as –OH stretching vibration peak [24]. In addition, the bands observed at 2358.15 cm−1 and 3435.90 cm−1 can be attributed to O=C=O bonds, and interactions between hydroxyl groups and the surface of ZnO [37].
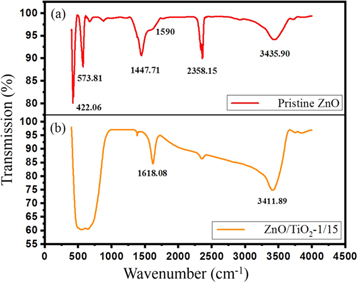
Figure 4. FT-IR spectra of (a) ZnO NPs, and (b) ZnO/TiO2-1/15 nanostructure.
Download figure:
Standard image High-resolution imageThe sharp peaks of stretching vibration at 400–900 cm−1 disappear in the FT-IR spectrum of ZnO encapsulated with TiO2 shell and a new wide absorption in the same range appears compared to the FT-IR spectrum of the ZnO NPs. In addition, a similar occurrence can be observed between 1400 cm−1 and 3500 cm−1 [38]. A broad peak related to the stretching vibration of O–H bond, and different interactions between hydroxyl groups and the surface of TiO2 at 3411.89 are also emerged [39].
FESEM studies determined the surface morphology of the ZnO NPs and ZnO/TiO2 nanocomposites. A typical FESEM image captured from the ZnO NPs is displayed in figure 5(a). The morphology shown in figure 5(a) does not exhibit uniform NPs with a high degree of homogeneity. The sheet-like shapes formed in FESEM image shown in figure 5(a) are due to the agglomerated spheres. Accordingly, the size of particles can be estimated with measuring the thickness of sheet-like structures. The diagram illustrated in figure 5(b), ascertain the particle size of 18 nm to 50 nm. However, morphological observations of ZnO/TiO2 core-shell structures as illustrated in figure 5(c) indicate relatively uniform of spheres particles with an average size particle about 30 nm (figure 5(d)).

Figure 5. (a), (c) FESEM images, and (b), (d) particle size distribution of (a), (b) ZnO NPs and (c), (d) ZnO/TiO2-15 nanostructure.
Download figure:
Standard image High-resolution imageThe ZnO/TiO2 nanocomposites with different shell thicknesses were precisely investigated using TEM analysis (figures 6–8). According to TEM images in, the core-shell structure can be clearly identified for all samples in which ZnO cores are encapsulated inside TiO2 shells (figures 6(a)–8(a)). The particle size histograms (figures 6(b)–8(b)) estimate the average particle size of ∼24 nm, 39 nm, and 42 nm for ZnO/TiO2-1/15, ZnO/TiO2-1/20, and ZnO/TiO2-1/25 core-shell nanostructures, respectively.

Figure 6. (a) TEM image, (b) histogram of particle sizes, and (c) histogram of shell thickness of ZnO/TiO2-1/15.
Download figure:
Standard image High-resolution image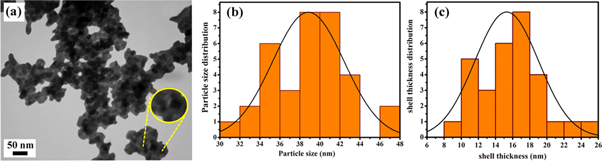
Figure 7. (a) TEM image, (b) histogram of particle sizes, and (c) histogram of shell thickness of ZnO/TiO2-1/20.
Download figure:
Standard image High-resolution image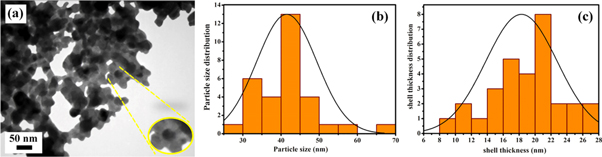
Figure 8. (a) TEM image, (b) histogram of particle sizes, and (c) histogram of shell thickness of ZnO/TiO2-1/25.
Download figure:
Standard image High-resolution imageThe TiO2 shell thickness of the nanocomposites was also calculated from distribution patterns of shell thickness. The values were measured to be about 13 nm, 15 nm, and 18 nm for ZnO/TiO2-1/15, ZnO/TiO2-1/20, and ZnO/TiO2-1/25 nanocomposites, respectively (figures 6(c)–8(c)). The thickness of outer shell gradually grows with increasing the TiO2 to ZnO weight ratio. The shell thickness can be controlled by changing TiO2 concentration to reach the optimal thickness. In addition, the quantitative characterization results obtained from FESEM and TEM histogram analysis can be found in table 1.
Table 1. Characteristics of the pristine ZnO NPs and ZnO/TiO2 nanocomposites.
| Sample | Crystallite size (nm) | Particle size (nm) | Average thickness (nm) | Absorption edge (nm) | Band gap (eV) | Decolorization efficiency (%) |
|---|---|---|---|---|---|---|
| Pristine ZnO | 23 | 33–39 | — | 365 | 3.4 | 20.1 |
| ZnO/TiO2–1/15 | 25 | 24 | 13 | 387 | 3.2 | 23.87 |
| ZnO/TiO2-1/20 | 32 | 39 | 15 | 400 | 3.1 | 35.55 |
| ZnO/TiO2-1/25 | 35 | 42 | 18 | 406 | 3.05 | 59.56 |
The UV-Vis observations and the corresponding Tauc plots can be employed to understand the optical characteristics of the pristine ZnO NPs and ZnO/TiO2 nanocomposite photocatalysts. The light absorbance characteristics of the all synthesized samples are plotted in a wavelength range of 200–800 nm and the results are displayed in figure 9(a). The optical absorbance data can specify the near band-edge optical absorption of the prepared samples. The absorbance of the ZnO NPs exhibits a broad and strong absorption profile in the UV region of electromagnetic spectrum with a steep edge in visible region. As it can be seen from figure 9(a), optical characteristic of the pristine ZnO NPs shows a sharp absorption peak at ∼365 nm. It is clear from the absorbance spectrum (figure 9(a)) that ZnO/TiO2 nanocomposites reveal no particular peak inferring the absorption peaks. As shown in figure 9(a), after coating ZnO with TiO2 layers, the overall absorbance of ZnO/TiO2 core-shell nanostructures becomes weaker. This can be mainly attributed to the scattering effect of the TiO2 shell according to Mie's theory for spherical structures [40]. Li et al reported a similar behavior with studying the effect of SiO2 shell thickness on optical absorption characteristics of Ag@SiO2@Ag sandwich nanostructures [41]. Zhang et al also presented another similar trend for Ag@SiO2@TiO2 core-shell nanoparticles, which happened with direct coating TiO2 on Ag core without a SiO2 interlayer and also in the presence of SiO2 interlayer [42].
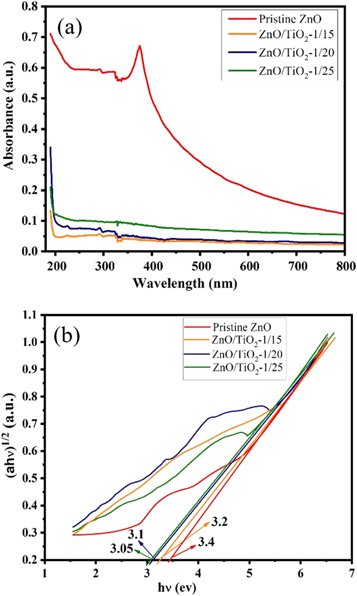
Figure 9. (a) UV-Vis absorption spectra, and (b) plots of ![${\left[a.h\nu \right]}^{1/2}$](https://content.cld.iop.org/journals/2053-1591/6/11/115060/revision2/mrxab49c4ieqn13.gif) for obtaining optical band-gaps of the pristine ZnO NPs and ZnO/TiO2 nanocomposites.
for obtaining optical band-gaps of the pristine ZnO NPs and ZnO/TiO2 nanocomposites.
Download figure:
Standard image High-resolution imageThe optical band-gap energy of the pristine ZnO NPs and ZnO NPs encapsulated with TiO2 shell can be estimated by Kubelka-Munk equation as [43], where α is the absorption coefficient,
  is the photon energy, A is the proportionality constant and
  is the optical band-gap energy. The band-gap energy values can be calculated by plotting
  against photon energy
 The plots converted from the absorbance spectra shown in figure 9(a), are exhibited in figure 9(b). The band-gap energy of the samples are obtained from intercept of the tangent to
  -axis. Table 1 shows the characteristics of the pristine ZnO NPs and ZnO/TiO2 nanocomposites.
The band-gap energy of the pristine ZnO NPs and ZnO encapsulated with TiO2 shell having the weight portion of 1/15, 1/20 and 1/25 are found to be ∼3.4 eV, 3.2 eV, 3.1 eV, and 3.05 eV, respectively. The results indicate a decrease for the all prepared ZnO/TiO2 nanocomposites. The band-gap engineering for ZnO/TiO2 nanocomposites can occur with being encapsulated ZnO core NPs into TiO2 shells. Indeed, the absorbance edges of all ZnO/TiO2 core-shell nanostructures generate a red shift towards bigger wavelengths in UV light region. The absorption edges obtained for ZnO/TiO2 samples suggest an improvement in charge separation, which can be due to less photon energy required to excite electrons and transfer charge-carriers involving in photocatalytic processes. Figure 9(b) shows a red shift ∼22 nm, ∼35 nm, and ∼41 nm for ZnO/TiO2-1/15, ZnO/TiO2-1/20 and ZnO/TiO2-1/25 core-shell nanostructures in contrast to the pristine ZnO NPs, respectively. In general, the resultant red shift can be described as the decrease of electron-transition energy, which can be achieved by narrowing the band-gap size. In addition, it is expected that ZnO/TiO2-1/25 nanocomposite would present a better photocatalytic activity due to the smaller band-gap energy. This is because smaller band-gaps cause photo-excited excitons, which need less energetic photons and thereby the bigger photocatalytic rate [44]. According to the discussion presented in the literature, fundamental parameters of photocatalytic activity are influenced by the wavelength of the exposed light and band-gap of employed semiconductor material. It was reported that lower band-gap played an active role to reach superior efficiency [45]. It is worth mentioning that a considerable amount of literature has been published on reducing the band-gap of semiconductors using various strategies such as doping non-metal ions (e.g., N and C) [46–49] and transition-metal cations (e.g., Cr and V) [50, 51] to improve photocatalytic activity. Therefore, it is necessary to optimize the shell thickness of the nanostructures to achieve appropriate ban-gap energies for the practical applications.
The photocatalytic performance of the pristine ZnO NPs and ZnO/TiO2 nanocomposites were evaluated by the de-colorization of MB aqueous solutions. The validity of UV light irradiation time on the de-colorization efficiency was investigated in solutions with 10 ppm dye concentration and pH 8 containing 0.04 g photocatalyst. Optical absorption spectra were periodically recorded in different time intervals (20 min) up to 120 min at room temperature. The resultant data are presented in figure 10. Figures 10(a)–(d) illustrates changes in UV-visible absorption spectra of MB solutions in terms of UV light exposure time in the presence of the pristine ZnO NPs, ZnO/TiO2-1/15, 1/20, and 1/25 nanocomposite photocatalysts, respectively. The synthesized photocatalysts exhibited moderate to good photocatalytic activity to remove MB from aqueous solutions.
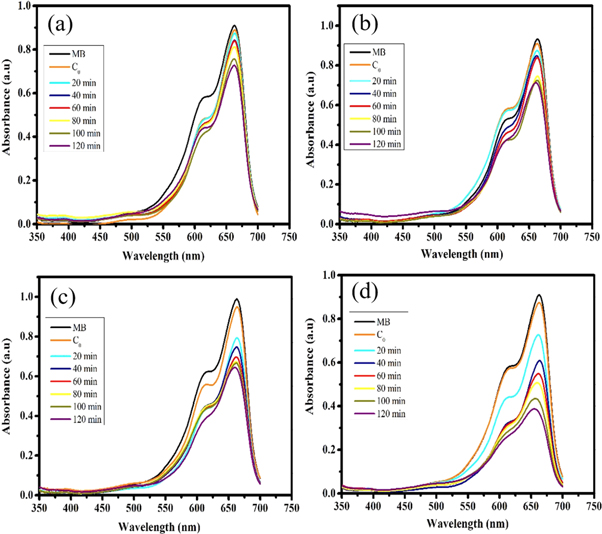
Figure 10. Photocatalytic activity of (a) the pristine ZnO NPs, (b) ZnO/TiO2-1/15, (c) ZnO/TiO2-1/20, and (d) ZnO/TiO2-1/25 nanocomposite photocatalysts.
Download figure:
Standard image High-resolution imageTo discuss the effect of shell thickness in the synthesized catalysts on the photocatalytic activity, the characteristic absorbance peak at λmax = 663 nm was detected. The photoactivity of the examined samples is illustrated in figure 11. It can be concluded from photocatalytic experiments that the highest photo-degradation efficiency is achieved in the presence of ZnO/TiO2-1/25 nanocomposite photocatalyst in which the photocatalytic activity trend can be represented as ZnO/TiO2-1/25 (59.56%) > ZnO/TiO2-1/20 (35.55%) > ZnO/TiO2-1/15 (23.87%) > Pristine ZnO (20.1%) after 120 min of UV irradiation time. Such photocatalytic activity can be explained by the factor relevant to the decrease of band-gap sizes due to the significant presence of the TiO2-related crystalline structure around the ZnO core. The band-gap energy effect can be associated with differences created among the band-gap structures during synthesis process. As shown in figure 9(b), the band-gap engineering technique by encapsulation process can provid smaller band-gap energies equivalent to 3.2 eV, 3.1 eV, and 3.05 eV for ZnO/TiO2-1/15, ZnO/TiO2-1/20 and ZnO/TiO2-1/25 nanostructures compared with the value of 3.4 eV for the pristine ZnO NPs. Although no huge changes are seen for band-gaps of nanocomposites in comparison with band-gap of ZnO NPs, the resultant values have led to more efficient separation of photoexcited charge carriers and better improvement of photocatalytic performance.
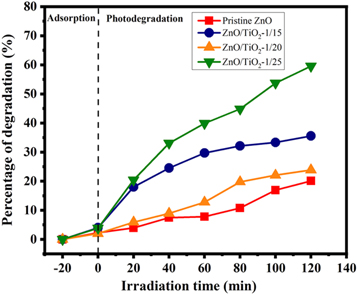
Figure 11. Comparative efficiency study of the prepared photocatalysts for MB photo-degradation.
Download figure:
Standard image High-resolution imageAs previously mentioned according to the band-gap theory, semiconductors with narrower band-gaps can extend the light absorption range resulting improvement the photocatalytic performance [52]. Therefore, possessing the least band-gap value might be a reason for ZnO/TiO2-1/25 nanocomposite catalyst with enhanced photocatalytic activity. In addition to the band-gap effect, the improvement of photocatalytic efficiency in nanocomposite catalysts can be attributed to reduction of recombination occurring in their structures, which can be further explained by photodegradation mechanism. These results suggest the importance of the controlling shell thickness to achieve the optimum conditions for the photocatalytic performance.
Figure 12 presents the schematic depiction of the photocatalytic mechanism in the presence of ZnO/TiO2 core-shell heterojunction nanostructures. The possible charge transfer process suggests a charge exchange through inverse type II heterojunctions [53] between ZnO and TiO2 components in which both ZnO and TiO2 can absorb the illuminated UV photons in a core-shell structure. In inverse type II heterojunction illustrated in figure 12, the valence band of ZnO (VBZ) is located at a more positive potential compared to TiO2 (VBT), while the conduction band of TiO2 (CBT) is more negative rather than that of ZnO (CBZ) [33]. Charge-transfer pathways exhibit the opposite migration directions for photoexcited electrons and holes in both ZnO core and TiO2 shell regions enriching both semiconductors. Photogenerated electrons migrate from CBT to CBZ to reach a less negative conduction band and holes passing from VBZ to the corresponding band in TiO2 decreasing the positive valance band [54].
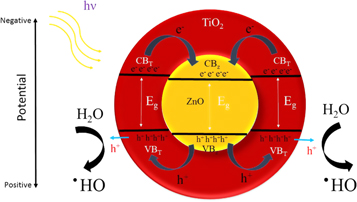
Figure 12. Charge-transfer mechanism in heterojunction of ZnO/TiO2 core-shell nanostructures.
Download figure:
Standard image High-resolution imageThe band alignment estimated in inverse type II heterojunction of ZnO/TiO2 nanocomposite catalysts causes photogenerated electrons diffusing into the core region. Therefore, the corresponding holes take part in the photocatalytic activity at the valance band of TiO2 shell. Consequently, the photoexcited electrons are effectively isolated in CBZ and only holes placed in VBT are allowed to participate in the photocatalytic process. It is concluded that the photocatalytic performance improvement resulted for nanocomposite catalysts in comparison with the pristine ZnO catalysts can be due to the charge separation mechanism, which occurs at the interface and amplifies the lifetime enhancement of the photoexcited carriers.
The mechanism of the photocatalytic degradation in the presence of ZnO/TiO2 nanocomposite photocatalyst can be described by the formation of the hydroxyl radical (·OH), which is performed through the holes transferred into the valence band of TiO2 shell region. The ·OH radicals are mainly formed from  in the presence of either the c adsorbed H2O according to equation (6) or the OH− groups on the surface based on equation (7) [55]. Repeated attacks of ·OH radicals on dye molecules finally lead to the degraded products as described in equation (8).


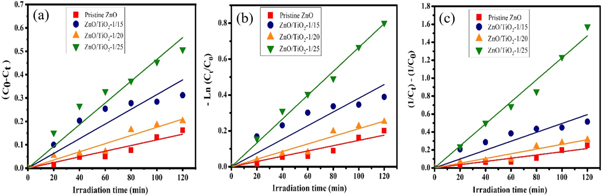
It is necessary to study the rate-governing steps for time dependent catalysts to modulate the efficiency of the photo-degradation systems. To investigate the photocatalytic de-colorization process of MB, three Langmuir-Hinshelwood kinetic models including zero, first and second-order models are used by plotting the values of 
 and
and  versus t for the pristine ZnO NPs and ZnO/TiO2 photocatalysts. Figures 13(a)–(c) exhibits the kinetic curves accompanied by the corresponding theoretical fits for zero, first and second-order models, respectively. The reaction rate constants (k) are determined from the slope of theoretically fitted lines given by equations (3)–(5). The best-fitting kinetic model is chosen using the linear regression method based on the correlation coefficients (R2). Table 2 shows the photo-degradation rate constants (
 and
and  ) and the corresponding determination coefficients (
 and
and  ) for the synthesized photocatalysts.
Figure 13. (a) Zero, (b) first, and (c) second-order kinetic curves of MB photo-degradation for the pristine ZnO NPs, and ZnO/TiO2 photocatalysts.
Download figure:
Standard image High-resolution image
Table 2. Kinetics for MB degradation in the presence of the pristine ZnO NPs and ZnO/TiO2 nanocomposite photocatalysts.
| Zero-order | First-order | Second-order | ||||
|---|---|---|---|---|---|---|
| Sample | K0 (mg l−1 mim−1) | R02 | K1 (min−1) | R12 | K2 (L mg−1 min−1) | R22 |
| Pristine ZnO | 0.00121 | 0.96986 | 0.00147 | 0.96095 | 0.0018 | 0.953 |
| ZnO/TiO2-1/15 | 0.00175 | 0.97673 | 0.00212 | 0.97651 | 0.0026 | 0.97132 |
| ZnO/TiO2-1/20 | 0.00315 | 0.92493 | 0.00382 | 0.94358 | 0.0049 | 0.9536 |
| ZnO/TiO2-1/25 | 0.00465 | 0.97838 | 0.00664 | 0.99697 | 0.0122 | 0.9935 |
The R2 values are obtained to determine the most appropriate model for the applied photocatalysts. According to results presented in table 2 and based on the highest R2 values, the pristine ZnO NPs and ZnO/TiO2-1/15 nanostructures follow zero-order kinetics, while ZnO/TiO2-1/20 and ZnO/TiO2-1/25 nanostructures pursue second-order and first-order models, respectively. The higher k values generally show the faster degradations and thereby the better photocatalytic activities.
The dimensionless parameter  is defined as an indicator of an improvement order for synthesized ZnO/TiO2 nanocomposites in comparison to the pristine ZnO catalyst. The obtained comparative data are summarized in table 3. All applied models indicate similar trends as ZnO/TiO2-1/25 > ZnO/TiO2-1/20 > ZnO/TiO2-1/15 > pristine ZnO, which are in agreement with the sequence resulted from figure 11.
Table 3.
The dimensionless term of  in the presence of ZnO/TiO2 nanocomposites.
| Sample | Zero-order | First-order | Second-order |
|---|---|---|---|
| ZnO/TiO2-1/15 | 3.8 | 4.5 | 6.7 |
| ZnO/TiO2-1/20 | 2.6 | 2.6 | 2.7 |
| ZnO/TiO2-1/25 | 1.4 | 1.4 | 1.4 |
4. Conclusion
ZnO/TiO2 nanocomposite catalysts were synthesized using a simple chemical co-precipitation method. The TiO2 shell thickness could successfully be controlled by tuning the weight portion of TiO2 to ZnO. The synthesized photocatalysts showed pure wurtzite ZnO crystal structure and anatase TiO2 phases for the core and shell structures, respectively. The prepared ZnO/TiO2 catalysts revealed broader absorption ranges of UV-Vis spectra compared with the pristine ZnO nanoparticles because of red-shifts obtained from diffuse reflectance spectrum. The influences of TiO2 shell thickness on the photocatalytic activity were explored by measuring the degradation rate of methylene blue. The de-colorization rate of the ZnO/TiO2 photocatalysts was higher compared with the pristine ZnO photocatalyst, which is in agreement with the corresponding band-gap energies. The optical and photocatalytic properties of the prepared nanostructures indicated the importance of finding the optimal shell thickness for the practical applications. The photo-degradation mechanisms suggested to be initiated by holes transferred into the valence band of TiO2 shell region.