
Abstract
Fused deposition modelling (FDM) has been widely explored for number of commercially available virgin thermoplastics (such as: poly lactic acid (PLA), nylon, acrylonitrile butadiene styrene (ABS) etc), thermoplastic based composites and printing conditions. But hitherto little has been reported on flexural and pull-out properties of 3D printed PLA based hybrid composite matrix (having magnetostrictive properties) especially in structural engineering applications. In the present work an effort has been made for 3D printing of PLA hybrid composite matrix (having magnetic characteristics) to investigate the flexural and pull out properties. The photo micro-graphic analysis and Shore D hardness has been performed on the printed samples and multifactor optimization tool has been used for optimizing the printing conditions. From multifactor optimization viewpoint it has been ascertained that infill density 100%; infill angle 45°; and infill speed 90 mm s−1 are the best printing conditions. Further from morphological testing it has been observed that mechanical properties (flexural and pull out) are dependent upon the hardness, surface porosity and surface roughness (Ra). The creo structural analysis supported with photomicrographs have been performed on the samples prepared at best setting of input parameters and it has been found that strain increases downward along the thickness and is maximum at lowest layer due to which the failure starts from the base line in flexural testing.
Export citation and abstract BibTeX RIS

Original content from this work may be used under the terms of the Creative Commons Attribution 4.0 licence. Any further distribution of this work must maintain attribution to the author(s) and the title of the work, journal citation and DOI.
1. Introduction
The FDM based 3D printing is one of foremost important techniques and is becoming the need of the day in various field of application such as for medical, mechanical, space, automobile and many other industries. The importance of FDM can be imagined by the recent trends of manufacturing in medical and automobile sectors. The various levels of input parameters and controlled output makes FDM a well suitable manufacturing technique for reliability studies where each time with the controlled input parameters the replication accuracy is maximum in comparison to any other process as very less human interaction is there with manufacturing interface [1]. Layer by layer supplanting of material with different degree of orientation with the axis makes this process special and with this controlled deposition of material, properties of product such as strength, flexibility, durability, chemical strength etc can be controlled and varied according to application [2]. Researchers have tried to explore FDM with different feedstock filament materials such as carbon reinforced polymers, metal reinforced polymers, ceramic reinforced polymers, and carbon nanotube (CNT) reinforced polymers and various other reinforced or composite feedstock filaments. The flexible nature of FDM has made it possible to print different range of feedstock filaments without causing any change in machine interface such as hardware or software [3, 4]. Polylactic acid (PLA) a biodegradable polymer with almost similar properties with acrylobutadiene styrene (ABS) has been recently explored by researchers for medical, structural applications. Effect of build orientation (one of the input parameter of 3D printing) on the printed part of PLA has been investigated for prediction of mechanical (tensile) property of material and it has been found that supplanting of material with 0° has shown maximum tensile property in compare to other angles of deposition because of the parallel deposition of material to the product length. Fatigue testing of PLA printed part with different build orientation varying from 0°–45° has been investigated and it has been found that under constant loading part with 0° supplanted layers have shown maximum strength. It was found that increase in temperature of product lead to decrease in fatigue life cycle of product [5, 6]. PLA reinforced with clay nano composite has been investigated for the printing capability with different set of printing temperature and effect of varying temperature on 3D printed part property has been explored. Further dynamic mechanical analysis (DMA), thermogravimetric analysis (TGA) and differential scanning calorimetry (DSC) have been performed to know the actual trends of behavior of printed geometry. Storage modulus found to be increased with the reinforcement of clay nanocomposites. Modulus of elasticity was found to be increasing with increasing printing temperature for PLA4032D with 4 wt% of clay nanocomposites reinforcement while it was decreased for PLA2003D with 4 wt% nano clay composite [7].
Effect of printing conditions on the of PLA has been explored for the purpose of ascertaining the properties of printed part as it was noticed that change in processing conditions alters the chemical, physical and mechanical properties of filament. Chemical analysis of sample has suggested the possible oxidation of printed surface and other testing have suggested that surface roughness and other properties have been affected with the different printing conditions [8]. PLA reinforced with tri-calcium phosphate (TCP) has been investigated for the printing capabilities of composite with varying set of input parameters such as processing temperature and sample size (thickness). It has been found that degree of crystallinity has been improved with increased temperature of printing. Tensile properties were dependent on the size of printed samples while surface roughness of printed sample has not affected the sample property significantly [9]. 3D printed samples of PLA material with fused filament fabrication (FFF) has been investigated for fatigue failure with varying input parameters (nozzle size, printing speed, layer thickness and infill density) of printing. It has been found that infill density has played major role in fatigue life of printed sample. Threshold limit of 35.8 MPa has been obtained for fatigue life of PLA based printed sample. This investigation has suggested 3D printing of PLA specimen were found better for honeycomb structure of printing and infill density of 75%, 0.3 mm layer thickness with 0.5 mm of nozzle diameter provided the optimized condition of printing. Further equal size of nozzle and thickness of sample resulted in poor fatigue life due to improper deposition of layers. Thermal effect in fracture was found insignificant for the tested samples [10].
3D printed scaffolds with high porosity and geometrical porosity have been investigated for fatigue behavior and it was found that with reversal strain load application, strain softening of samples has been seen. Circular geometry of pores has exhibited stable fatigue life, whereas triangular geometric pores were inefficient for fatigue loading conditions. Low stress concentration in case of circular pores was found to be the reason of better fatigue resistance of scaffold. Thus varying geometry of pores lead to fatigue life improvement of 3D printed PLA scaffold with high significance. Circular pore based printed samples were found to be deformed due to buckling whereas in triangular pore based specimen simple shear mechanism has been seen as the deformed geometry has 45° inclination to the load [11]. Infill density as one of the important input parameter of FDM has been investigated for its effect on mechanical properties of printed specimens made up of PLA and it has been found that with enriching infill density compressive strength of printed sample of PLA has been enhanced but lower density of printing reduced the time for printing for the same size of sample as low metal deposition was required in case of low density printed part [12]. PLA reinforced with wood particles from 0–50 wt% has been investigated for the 3D printing conditions and mechanical properties were investigated for the printed samples. It has been found that printed parts with high level of wood content has shown decrease in tensile strength of specimen while with loading upto 10% (tensile strength: 57 MPa) has shown better mechanical property than neat PLA(tensile strength: 55 MPa). Surface roughness and porosity were found to be increased with increased loading of wood particles. Further DMA analysis has shown decrease in storage modulus with high wood reinforcement [13].
Various 3D printers are available in today's world for different field of applications. An open source replicating rapid prototype (Rep-Rap) 3D printer has been used for the printing of PLA to investigate the mechanical properties of printed parts with different set of input conditions. Ultimate tensile strength of samples were reduced with 90°orientation deposition of layers as fracturing force was perpendicular to the layer of deposition. Further it was noticed that layer thickness upto 0.15 mm maximum strain rate has been obtained and for the 0.2 mm layer thickness minimum strain rate has been obtained [14]. Filaments of wood and polymeric material have been investigated for the purpose of mechanical, morphological and chemical properties in which content of wood powder changed from 20–40 wt% and it has been found that 20 wt% of wood in composite improved the tensile properties while on increasing further wood contend lead to reduction in properties whereas high content of wood in polymeric matrix lead to improvement in flexural properties and hardness of printed specimens [15]. Highly dense PLA blocks have been prepared with 3D printed and examined for the tensile, compressive and fracture properties and effect of extrusion direction have been investigated with the loading conditions in testing. It has been found that when material was loaded in the direction of deposition the results were better for the mechanical properties in compare to loading in any other direction such as in transverse direction [16]. Continuous carbon fiber (CCF) reinforced PLA matrix has been 3D printed and flexural properties and tensile properties have been investigated in which it has been found that increased content of CCF (upto 27 wt%) improved the flexural strength of PLA (335 MPa) and modulus of elasticity (30 GPa) [17]. Various researchers have also used Fe3O4 and iron powder as reinforcement in polymeric base matrix to prepare feedstock filament of FDM setup [18–20].
From the reported literature, it has been observed that PLA a biodegradable polymer has been well explored with reinforcements such as CCF, CNT, graphene, wood powder and many others. But hitherto little has been reported on flexural and pull-out properties of 3D printed PLA based hybrid composite matrix (having magnetostrictive properties) especially in structural engineering applications. This work is an extension of previously reported study on PLA hybrid composite matrix with magnetic properties, prepared with twin screw extruder (TSE) [19, 21]. In the present work an effort has been made for 3D printing of prepared feedstock filament to investigate the flexural and pull out properties. The PVC and wood powder are good selection for reinforcement being poor conductor of heat, electricity, where as Fe3O4 reinforcement is especially useful in self assembly applications. Therefore in the present study a novel magnetostrictive feedstock filament has been used for printing on FDM by varying the printing conditions.
2. Materials and method
In this present work feedstock filament having paramagnetic character has been prepared with TSE [19, 21] which was used for 3D printing of flexural specimen as per ASTM D790 standard. The selected PLA matrix was having magnetization 28.65 emu g−1, coercivity 74.54 Oe and retentivity 1.27 × 10⁻² G. PLA and PVC have been procured from local market (Batra plastic house: Ludhiana, India), Fe3O4 has been procured from local vendor (Shiva Chemicals: Ludhiana, India) of 99% purity and of mesh size 44 micron and wood powder has been collected from local wood working industry and processed with sieve shaker to segregate wood powder of 50 micron size so that compatibility issue of size may be addressed. Four materials have been used for preparing feedstock filament for 3D printer and whose properties are given in table 1. The methodology adopted to perform this investigation has been shown in figure 1 which clearly depicts the steps of investigation of current study.
Table 1. Properties of PLA, PVC and Fe3O4 [22].
| Material/Properties | PLA | PVC | Fe3O4 |
|---|---|---|---|
| Density (g cm−3) | 1.255 | 1.80 | 5.17 |
| Melt flow (g/10 min) | 21–28 | 0.420–460 | — |
| Tensile strength (MPa) | 73 | 0.758–156 | — |
| Flexural strength (MPa) | 65 | — | — |
| Modulus of Elasticity (GPa) | 3.37 | 0.00552–0.0121 | 175 |
| Glass transition temperature (°C) | 61–62 | 82 | — |
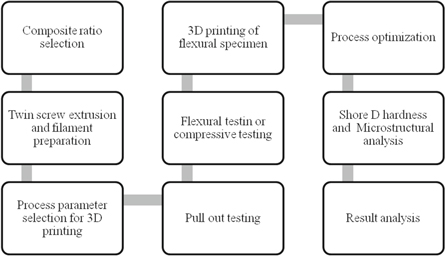
Figure 1. Methodology adopted.
Download figure:
Standard image High-resolution image3. Experimentation
3.1. Composite preparation
The TSE has been used to blend the polymers and reinforcements. During pilot experimentation PVC proportion was varied from 10–25 wt%, magnetite powder from 0–30 wt% and wood powder from 5–20 wt%. It has been found that PLA 50 wt%, PVC 25 wt%, wood powder 5 wt% and Fe3O4 20 wt% resulted into better mechanical properties of the feedstock filament for 3D printing. Therefore this ratio has been taken in this work to investigate and optimize the 3D printing condition for mechanical property especially for flexural and poll out. The TSE was used to blend the composition/proportion at 170 °C temperature, 0.15 Nm of torque and 10 kg of loading condition. With the given conditions of extrusion the filament having magnetic characteristics (paramagnetic) was prepared successfully with diameter of filament varying from 1.65–1.75 mm. This diameter range has been found satisfactory for 3D printing and melt flow index of composite has been ascertained as 42.37 gm/10 min.
3.2. Printing of test specimen
Filament prepared with TSE was used to print flexural specimen according to ASTM D695 standard using the Taguchi orthogonal array (OA) L9 approach. Several input parameters may be changed for printing some of them are shown by fish bone diagram as represented in figure 2. Out of these parameters 3 input process parameters (a) infill density (b) infill angle and (c) infill speed have been selected as from literature survey it has been seen that these parameters play very crucial role in output properties than other process parameters.

Figure 2. Various input parameters for 3D printing with FDM.
Download figure:
Standard image High-resolution imageTable 2 shows fixed input parameters for present study. Based upon trial runs the infill density has been varied from 60%–80%, infill angle from 45°–90° and infill speed from 50–90 mm s−1. Table 3 shows log of experimentation for present study.
Table 2. Constant printing parameters.
| Parameters | value |
|---|---|
| Bed temperature | 65 °C |
| Fill pattern | Rectilinear |
| Nozzle temperature | 235 °C |
| Filament Diameter | 1.70 mm |
| Nozzle diameter | 0.5 mm |
| Solid layers | Top 3, Bottom 3 |
| Travel speed | 130 mm s−1 |
Table 3. Experimentation log.
| S. No. | Fill Density (%) | Fill Angle (°) | Infill Speed (mm s−1) |
|---|---|---|---|
| 1 | 60 | 45 | 50 |
| 2 | 60 | 60 | 70 |
| 3 | 60 | 90 | 90 |
| 4 | 80 | 45 | 70 |
| 5 | 80 | 60 | 90 |
| 6 | 80 | 90 | 50 |
| 7 | 100 | 45 | 90 |
| 8 | 100 | 60 | 50 |
| 9 | 100 | 90 | 70 |
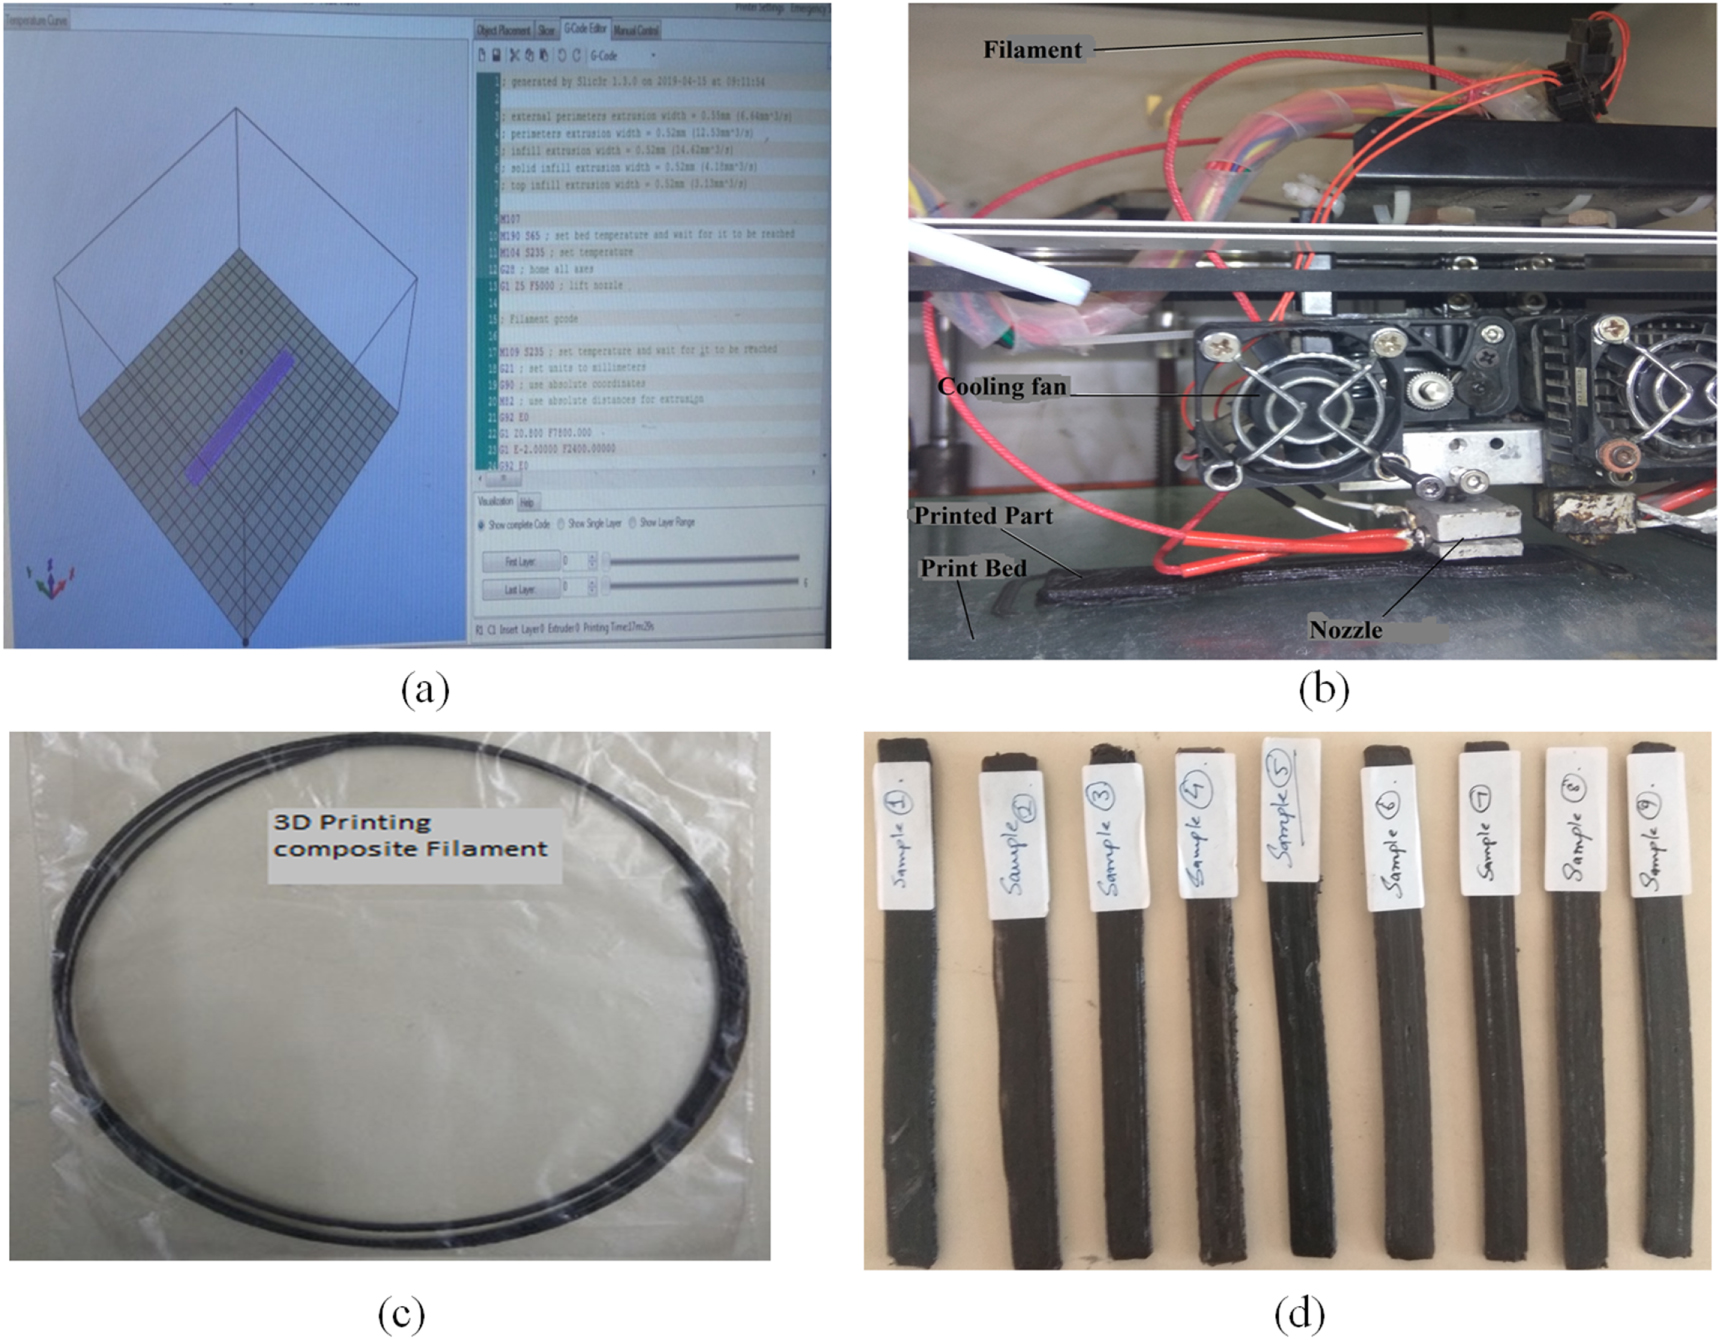
Figures 3(a)–(d) respectively shows the printing interface of printer, in process online printing, in-house prepared composite feed-stock filament and successfully printed parts.

Figure 3. (a) Printing interface with G-code; (b) 3D printing of flexural specimen; (c) Composite feedstock filament; (d) Printed flexural specimens.
Download figure:
Standard image High-resolution image3.3. Flexural testing
3D printed samples were further tested for flexural properties and pull out properties using universal tensile testing machine setup (Make: Shanta Engineering; Pune, India). Properties such as peak strength, peak load, break load, percentage peak elongation, and percentage break elongation were obtained and optimized for larger is the better case using analysis of variance (ANOVA).
3.4. Morphological properties testing
The samples after flexural testing were tested for morphological properties such as porosity, photo-micrographic analysis and Shore D hardness. The samples with lowest and highest values of mechanical performance were further processed with image processing software tool to characterize their surface roughness (Ra value) to correlate the surface properties with mechanical performance.
4. Results and discussion
4.1. Flexural testing results
For all the printed specimens flexural test and pull out test has been performed and properties were recorded using UTM interface on machine as given by tables 4 and 5, and for those values the properties were analyzed using ANOVA to calculate the signal to noise (SN) ratios of properties (see table 6) for larger the better type case. As observed from table 7 it is clear that the model is accurate as percent residual error (2.13%) is less than 5% and moreover infill angle input parameter is also significant (P value < 0.05). From rank table 8 it is very clear that effect of infill angle is most prominent as it was ranked 1st, infill density was ranked at 2nd and infill speed was least significant for the process of printing. Stress versus strain relationship as seen from figure 4 (flexural tested samples) clearly demarcates the difference among printed samples (with different conditions). Sample at S. No.7 (as per table 3) has shown maximum strain as well as stress (see figure 4). Similarly from figure 5 (pull out tested samples) similar trend was observed.
Table 4. Flexural properties of FDM based 3D printed samples with standard deviation.
| Flexural Properties | ||||||
|---|---|---|---|---|---|---|
| S. No. | PL | PE | BL | BE | PS | BS |
| 1 | 12.7 ± 1.21 | 7.61 ± 0.31 | 13.11 ± 1.20 | 14.56 ± 1.01 | 9.16 ± 1.01 | 9.46 ± 1.01 |
| 2 | 11.2 ± 1.04 | 5.98 ± 0.15 | 10.08 ± 1.01 | 10.24 ± 1.56 | 8.08 ± 0.65 | 7.27 ± 1.05 |
| 3 | 7.8 ± 0.65 | 1.99 ± 0.08 | 5.06 ± 0.56 | 4.55 ± 1.20 | 5.63 ± 0.21 | 3.65 ± 0.51 |
| 4 | 18.1 ± 2.21 | 7.89 ± 0.51 | 16.29 ± 1.42 | 15.77 ± 3.32 | 13.06 ± 2.21 | 11.75 ± 1.04 |
| 5 | 11.7 ± 1.21 | 6.84 ± 0.21 | 10.53 ± 1.35 | 13.49 ± 1.67 | 8.44 ± 1.01 | 7.60 ± 0.51 |
| 6 | 8.1 ± 1.03 | 2.66 ± 0.11 | 5.67 ± 1.05 | 6.65 ± 1.45 | 5.84 ± 1.03 | 4.09 ± 0.56 |
| 7 | 19.6 ± 3.10 | 8.23 ± 1.35 | 17.64 ± 2.21 | 20.47 ± 3.35 | 14.14 ± 2.52 | 12.72 ± 2.35 |
| 8 | 14.2 ± 2.21 | 6.35 ± 0.74 | 12.78 ± 1.67 | 17.52 ± 3.20 | 10.24 ± 1.67 | 9.22 ± 1.53 |
| 9 | 9.78 ± 0.65 | 3.2 ± 0.24 | 7.8 ± 1.05 | 7.84 ± 1.14 | 7.05 ± 0.65 | 5.63 ± 0.58 |
Note: PL: Peal Load; PE: Peak Elongation; BL: Break Load; BE: Break Elongation; PS: Peak Strength; BS: Break Strength. It should be noted that each sample was printed with 3 repetitions on FDM setup so that deviation in properties may also be reported.
Table 5. Pull out properties FDM based 3D printed samples with standard deviation.
| Pull out properties | ||||||
|---|---|---|---|---|---|---|
| S. No. | PL | PE | BL | BE | PS | BS |
| 1 | 50.21 ± 4.52 | 32.45 ± 3.54 | 48.21 ± 4.20 | 30.4 ± 3.54 | 36.22 ± 4.52 | 34.78 ± 2.65 |
| 2 | 45.21 ± 3.54 | 29.13 ± 4.52 | 40.12 ± 3.14 | 28.56 ± 4.52 | 32.61 ± 3.54 | 28.94 ± 3.54 |
| 3 | 42.23 ± 3.12 | 26.12 ± 4.01 | 38.54 ± 3.54 | 25.87 ± 3.61 | 30.46 ± 2.65 | 27.80 ± 4.52 |
| 4 | 55.05 ± 5.54 | 32.15 ± 4.52 | 52.14 ± 4.52 | 34.18 ± 3.54 | 39.71 ± 3.54 | 37.61 ± 2.65 |
| 5 | 50.23 ± 4.52 | 28.12 ± 3.54 | 46.24 ± 3.61 | 30.61 ± 4.52 | 36.23 ± 4.52 | 33.35 ± 3.54 |
| 6 | 40.63 ± 3.12 | 24.13 ± 2.36 | 38.62 ± 3.54 | 28.51 ± 3.54 | 29.31 ± 3.54 | 27.86 ± 4.52 |
| 7 | 63.41 ± 4.85 | 40.12 ± 4.52 | 59.91 ± 4.52 | 40.12 ± 3.61 | 45.74 ± 3.42 | 43.21 ± 3.67 |
| 8 | 59.54 ± 3.12 | 35.26 ± 2.81 | 55.63 ± 3.54 | 36.54 ± 4.52 | 42.95 ± 2.65 | 40.13 ± 3.54 |
| 9 | 56.23 ± 4.52 | 33.85 ± 3.54 | 50.84 ± 4.52 | 32.12 ± 3.61 | 40.56 ± 4.52 | 36.67 ± 4.52 |
Table 6. SN ratios for tested samples for flexural and pull out properties.
| SN ratios for flexural properties (dB) | ||||||
|---|---|---|---|---|---|---|
| S. No | PL | PE | BL | BE | PS | BS |
| 1 | 22.08 | 17.63 | 22.35 | 23.26 | 19.24 | 19.52 |
| 2 | 20.98 | 15.53 | 20.07 | 20.21 | 18.15 | 17.23 |
| 3 | 17.84 | 5.98 | 14.08 | 13.16 | 15.00 | 11.25 |
| 4 | 25.15 | 17.94 | 24.24 | 23.96 | 22.32 | 21.40 |
| 5 | 21.36 | 16.70 | 20.45 | 22.60 | 18.53 | 17.62 |
| 6 | 18.17 | 8.50 | 15.07 | 16.46 | 15.33 | 12.23 |
| 7 | 25.85 | 18.31 | 24.93 | 26.22 | 23.01 | 22.09 |
| 8 | 23.05 | 16.06 | 22.13 | 24.87 | 20.21 | 19.29 |
| 9 | 19.81 | 10.10 | 17.84 | 17.89 | 16.97 | 15.01 |
| SN ratios for pull out properties | ||||||
| S. No | PL | PE | BL | BE | PS | BS |
| 1 | 34.02 | 30.22 | 33.66 | 29.66 | 31.18 | 30.83 |
| 2 | 33.10 | 29.29 | 32.07 | 29.12 | 30.27 | 29.23 |
| 3 | 32.51 | 28.34 | 31.72 | 28.26 | 29.68 | 28.88 |
| 4 | 34.82 | 30.14 | 34.34 | 30.68 | 31.98 | 31.51 |
| 5 | 34.02 | 28.98 | 33.30 | 29.72 | 31.19 | 30.46 |
| 6 | 32.18 | 27.65 | 31.74 | 29.10 | 29.34 | 28.90 |
| 7 | 36.04 | 32.07 | 35.55 | 32.07 | 33.21 | 32.71 |
| 8 | 35.50 | 30.95 | 34.91 | 31.26 | 32.66 | 32.07 |
| 9 | 35.00 | 30.59 | 34.12 | 30.14 | 32.16 | 31.29 |
Table 7. Analysis of variance for SN ratios for peak load (Flexural property).
| Source | DF | Seq SS | Adj SS | Adj MS | F | P |
|---|---|---|---|---|---|---|
| Infill Density | 2 | 10.131 | 10.131 | 5.0654 | 7.62 | 0.116 |
| Infill Angle | 2 | 49.830 | 49.830 | 24.9150 | 37.47 | 0.026 |
| Infill Speed | 2 | 1.215 | 1.215 | 0.6074 | 0.91 | 0.523 |
| Residual Error | 2 | 1.330 | 1.330 | 0.6649 | ||
| Total | 8 | 62.505 |
DF: Degree of freedom; Seq SS: sum of square; Adj SS: adjusted sum of square; F: Fisher value; P: Probability.
Table 8. Response table for SN ratios for peak load (Flexural Property).
| Level | Infill density | Infill angle | Infill speed |
|---|---|---|---|
| 1 | 20.30 | 24.36 | 21.10 |
| 2 | 21.56 | 21.80 | 21.98 |
| 3 | 22.90 | 18.61 | 21.68 |
| Delta (Difference between maximum and minimum observed value) | 2.60 | 5.75 | 0.88 |
| Rank | 2 | 1 | 3 |
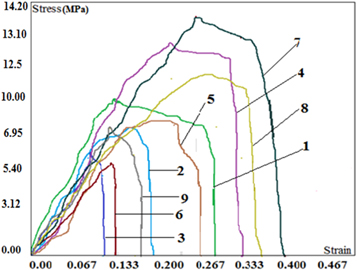
Figure 4. Stress versus strain diagram for samples for flexural testing.
Download figure:
Standard image High-resolution image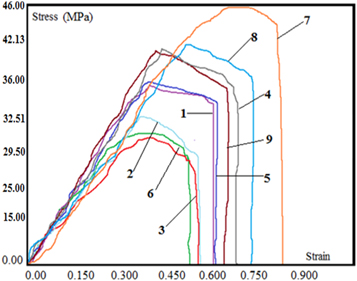
Figure 5. Stress versus strain diagram of samples for pull out testing.
Download figure:
Standard image High-resolution imageFrom main effect plot (see figure 6), it was ascertained that infill density of 100%, infill angle of 45° and infill speed of 70 mm s−1 was the optimized condition for peak load of flexural property but a critical point was noticed that the required set of conditions were out of the design of experimentation therefore it was necessary to perform a set of experimentation with the optimized condition. Therefore with optimized condition experimentation was performed and actual values of each property were obtained by flexural and it was found that the predicted and actual results were very close as seen by table 9.
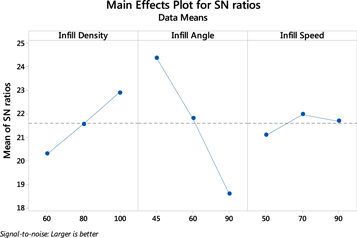
Figure 6. Main effect plot for SN ratio for peak load (Flexural Property)
Download figure:
Standard image High-resolution imageTable 9. Actual versus predicted optimum values for each property of flexural specimen.
| Flexural properties | ||||||||
|---|---|---|---|---|---|---|---|---|
| S. No. | Properties | Ka | Kb | Kc | K |

|
Y(opt) (predicted) | Y(actual) |
| 1 | Peak load | 22.90 | 24.36 | 21.98 | 21.59 | 26.06 | 20.09 | 19.56 |
| 2 | Peak elongation | 14.82 | 17.96 | 14.53 | 14.08 | 19.15 | 9.07 | 10.24 |
| 3 | Break load | 21.63 | 23.84 | 20.72 | 20.13 | 25.93 | 19.79 | 19.65 |
| 4 | Break elongation | 22.99 | 24.48 | 21.53 | 20.96 | 27.08 | 22.59 | 20.93 |
| 5 | Peak strength | 20.06 | 21.52 | 19.14 | 18.75 | 23.22 | 14.49 | 15.54 |
| 6 | Break strength | 18.80 | 21.00 | 17.88 | 17.29 | 23.10 | 14.29 | 14.24 |
| Pull out properties | ||||||||
| 1 | Peak load | 35.51 | 34.96 | 34.31 | 34.13 | 36.52 | 66.99 | 68.54 |
| 2 | Peak elongation | 31.2 | 30.81 | 30.01 | 29.8 | 32.42 | 41.78 | 40.41 |
| 3 | Break load | 34.86 | 34.52 | 33.52 | 33.49 | 35.92 | 62.52 | 61.49 |
| 4 | Break elongation | 31.15 | 30.8 | 30.01 | 30 | 31.96 | 39.63 | 38.95 |
| 5 | Peak strength | 32.68 | 32.12 | 31.47 | 31.29 | 33.69 | 48.36 | 47.54 |
| 6 | Break strength | 32.02 | 31.68 | 30.69 | 30.65 | 33.09 | 45.13 | 44.59 |
4.2. Optimization for the flexural and pull out properties using ANOVA statistical tool
For prediction of optimized peak load predicted value equation (1) has been used:
Note: KA, KB, and KC are the maximum values of input processing parameters from table 8.
K = mean of SN values for peak load analysis = 21.59


Putting these values in equation (1)

for lesser is the better case

for larger is the better case


Similar studies have been performed for all other properties and predicted values have been found and compared with actual observed values for flexural and pull out properties (see table 9).
A multifactor optimization tool for all the SN values of flexural properties and pull out properties (see table 6) was applied individually to know the best and worst conditions of printing from which it was found that sample 7 was best among all and sample 3 was worst of all for flexural and pull out properties (table 10).
Table 10. SN values for multifactor optimization of flexural and pull out properties (for samples as per table 3).
| Multi factor optimization | S. No 1 | S. No 2 | S. No 3 | S. No 4 | S. No 5 | S. No 6 | S. No 7 | S. No 8 | S. No 9 |
|---|---|---|---|---|---|---|---|---|---|
| SN value (Flexural) | 26.18 | 25.29 | 20.44 | 26.87 | 25.67 | 22.23 | 27.18 | 26.15 | 23.54 |
| SN value (Pull out) | 29.96 | 29.66 | 29.47 | 30.13 | 29.86 | 29.48 | 30.50 | 30.30 | 30.12 |
Since from table 10, experiment No. 7 has resulted into best mechanical (flexural, pull out properties). This sample was subjected to creo commercial structural analysis package for flexural testing (figure 7). From rank table 8 it is clear that printed sample with infill angle of 45° and infill density of 100% has given optimum result this behavior may be attributed to the fact that the flexural testing instrument applies destruction force perpendicular to the surface (see figure 7) but the layers printed part had solid layers at 45° and high infill density provided low porosity due to which when destructing force applied the layers were strong enough to absorb the maximum load and thus provided best result. Whereas in the case with printed part at 90° orientation the layers were parallel to the destructing force and as strain was maximum at lowest layer the layer get separated easily due to which that sample was not capable of resisting applied load and get destroyed easily. From observation it is noticed that with increase in infill angle from 45°–90° the strength of printed sample decreased whereas with increasing infill density from (60%–100%) the strength of printed specimen increased. When load was applied from UTM for sample with 45° deposition the layers resisted maximum as strain lines are maximum at bottom surface and upper surface is in compression while bottom surface in tension (see figure 7) and load gets distributed on number of inclined layers. In contrast when sample with 90° deposition was tested with the same condition the material layers being parallel to the destructing force get easily separated due to which, poor properties were recorded for them. The cut-section 'A-A' clearly shows tensile loading in the lower layers and compressive loading conditions in the upper layers of fractural test specimens. For more understanding photomicrographs of fractured and un-fractured printed parts were taken at ×30 magnification with tool maker's microscope (figure 8) and it has been observed that while flexural loading the inner zone was under compression and outer was under tension. The results are in line with observations made by other investigators [23–28].
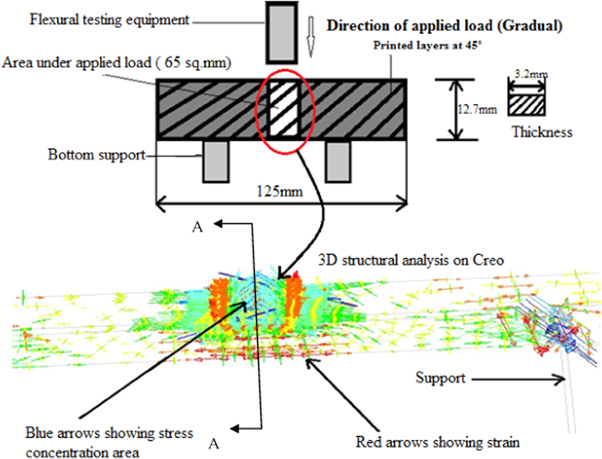
Figure 7. 2D view of flexural testing with 3D simulation for stress and strain.
Download figure:
Standard image High-resolution image
Figure 8. (a) Printed part and (b) Fractured part under flexural loading.
Download figure:
Standard image High-resolution image4.3. Shore D hardness
3D printed samples were tested for their Shore D hardness characteristic as it was evident from past literature that hardness plays crucial role in deciding the properties of composite. From shore D testing it was found that sample 7 held maximum hardness whereas sample 3 had least hardness as evident from figure 9. Sample 7 was printed with maximum density and also the print angle was 45° therefore holds maximum hardness. Whereas print density of sample 3 was least (60%) therefore interspacing was much prominent in sample 1 and this caused low hardness of print sample. Photo-micrographic analysis (at 100 × magnification) of samples (figure 10) revealed that percentage porosity was also playing role in hardness and sample mechanical properties as it is evident from figure 10. The sample possessing maximum hardness has least porosity whereas sample whose hardness was less possessed maximum porosity.
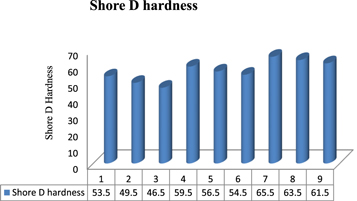
Figure 9. Shore D hardness of printed samples (as per table 3).
Download figure:
Standard image High-resolution image
Figure 10. Photo-micrographic analysis for porosity (as per table 3).
Download figure:
Standard image High-resolution image4.4. Surface roughness testing
From surface and mechanical performance it was observed that sample 3rd held least mechanical performance (as per flexural and pull out results) and sample 7th held maximum mechanical performance. The photo-micrographic images (see figure 10) were further processed with image processing software package tool and Ra profile was observed (figure 11) from which it was figured out that sample 3rd held high roughness value (Ra = 51.48) than sample 7th (Ra = 21.47) which may also be one of the reasons for its poor mechanical performance. The same is also visible from 3D rendered image of photomicrographs.

Figure 11. Surface roughness profile (at cut-off length of 0.04 mm), (a) for sample at S. No. 3, (b) for sample at S. No.7 (as per table 3).
Download figure:
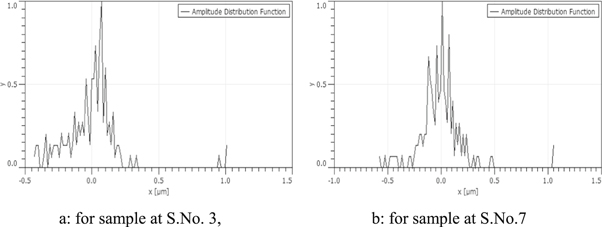
Standard image High-resolution imageBased upon 3D rendered images (figure 11), the amplitude distribution function (ADF) was noticed (figure 12) which clearly indicates that the sample at S. No. 7 (as per table 5) is more uniformly distributed (normal distribution view point) in comparison to sample at S. No.3 (which is more aligned towards left), hence responsible for poor mechanical properties.
Download figure:
Standard image High-resolution image
5. Conclusions
In this research work magnetostrictive polymer feedstock filament has been used for 3D printing and samples were printed for flexural standard so that flexural and pull out properties.
- 1.From multifactor optimization of flexural and pull out properties it has been found that experimental condition 7 (Infill density: 100; Infill angle: 45°; and Infill speed: 90 mm s−1) is the best printing condition and experimental condition 3 (Infill density: 60; Infill angle: 90°; and Infill speed: 90 mm s−1) is the worst among all.
- 2.From stress and strain curve it has been found that the sample with best properties (sample 7) also holds maximum strain absorbing capacity as its break elongation is 20.47 mm (see table 4) and strain capacity is 0.4094 for flexural results whereas in case of pull out the sample 7 holds break elongation of 40.12 (see table 5) and strain capacity of 0.8024. Hence this may be considered as best situation for crash applications.
- 3.From morphological testing it has been found that mechanical properties (Flexural and Pull out) are in relation with hardness, porosity and surface roughness.
- 4.From creo model analysis (see figure 7) it has been found that strain increases downward in the thickness and is maximum at lowest layer due to which the failure starts from the base row in flexural testing therefore it is recommended to use small angle of printing must be used. As the number of load sharing layers increases, maximum strength is obtained.
Acknowledgments
The authors are obliged to manufacturing research lab GNDEC Ludhiana and Thapar institute for continuous help and support for their valuable help in present research.