
Abstract
In this paper, three different strategies based on machine learning methods were applied to Al-Zn-Mg-Cu series alloy composition design with the targeted property of stress corrosion cracking (SCC) resistance. By comparing the results of the strategies, it was discovered that the performance of the efficient global optimization (EGO) method was better than that of response surface optimization method, and much better than that of Random method, among which the Al-6.05Zn-1.46Mg-1.32Cu-0.13Zr-0.02Ti-0.50Y-0.23Ce (named EGO alloy) alloy had the best stress corrosion cracking resistance. The slow strain rate test (SSRT) technique was carried out to compare the EGO alloy with the traditional 7N01 alloy. It indicated that the ISCC of the new EGO alloy was lower than that of traditional 7N01 alloy for both single and double aging treatment. With the XRD, SEM and EDS analysis, it was found the rare earth elements formed Al8Cu4(Y, Ce) and quadrilateral phase Al20Ti2(Y, Ce) in the EGO alloy.
Export citation and abstract BibTeX RIS

Original content from this work may be used under the terms of the Creative Commons Attribution 4.0 licence. Any further distribution of this work must maintain attribution to the author(s) and the title of the work, journal citation and DOI.
1. Introduction
7XXX series Al alloys (Al-Zn-Mg-Cu series alloys) have been widely applied in the body structures and key components of high-speed trains [1–3] due to their excellent mechanical properties, low density, and good weldability. However, stress corrosion cracking (SCC) has been an issue in the 7XXX series Al alloys which may lead to significant service failures [4, 5]. Up to now, there have been intensive investigations on SCC resistance and a number of methods proposed to improve it [6–8]. It has been shown that SCC resistance depends on many factors, such as alloy composition, heat treatment system, and corrosion solution [9]. Chen et al [10] pointed out when the Zn/Mg ratio was 4.53, the alloy had excellent SCC resistance, where the ISCC was 3.4%. The SCC resistance increased significantly as the Zn/Mg ratio decreased, which was attributed to the narrower width of precipitation-free zone. Other work indicated that the addition of Cu clearly improved the strength and corrosion resistance while it decreased the welding properties due to its extended solidification temperature range [11, 12]. Also, the addition of rare earth elements such as Zr and Sc [13–15] may enhance the corrosion resistance. Therefore, designing reasonable elements ratios, no matter main alloying elements or microelements, was able to effectively improve the SCC resistance of 7XXX series Al alloys.
Material design has always been a continuous research hotspot. Designing materials with targeted properties is often time-consuming and laborious due to the complexity of the search space. Composition design methods are various, including theoretical calculations, orthogonal tests, further designs based on traditional composition, trial-and-error, and so on. The phase field method, which can effectively simulate the microstructure evolution of various materials under different process parameters, is a significant part of the materials simulation space [16–20]. In the case of multiphase crystalline solids, the phase field method is an efficient tool to predict the properties of a complex alloy. Ma et al [21] employed a phase field model incorporating applied thermal stress to predict the equivalent elastic modulus, and its relationship with solid fractions can be achieved quantitatively by adding an external constant stress boundary condition. Zhang et al [22] established a thermodynamically consistent phase field model to describe the sintering process with multiphase powders. The results demonstrated that the microstructure and solute distribution during the sintering process can both be obtained quantitively.
Given the complexity of the design problem and the recent advances in modelling large data sets, machine learning methods have been applied in the field of material science [23, 24]. Up to now, there has been much interest in using machine learning for material design, which can help researchers to optimize materials with targeted properties less time and with lower cost [25, 26]. Xue et al [27] employed an adaptive design strategy coupled with experiments to discover the target alloy, Ti50.0Ni46.7Cu0.8Fe2.3Pd0.2, from a potential space of 800 000 compositions. Wen et al [28] searched for high entropy alloys (HEAs) with high hardness in the Al-Co-Cr-Cu-Fe-Ni system by formulating a material design strategy based on a machine learning model. The feasibility and availability of machine learning in the field of material science has been demonstrated as a new way of material design and discovery. Generally, machine learning is used to establish a functional model between inputs (such as the composition) and outputs (such as the target property) based on the known observation data [26, 29–31]. Then, based on the model, the targeted property of unexplored materials is estimated, which leads researchers to choose the candidate with the best estimated property for experiment measurement. The methods of estimating the targeted property of materials by the models are referred to as strategies. Different strategies for searching the material design space have various results and efficiency, hence a suitable strategy is of vital significance for material composition design.
So far, few researchers have applied machine learning to the composition design of 7XXX Al alloys. In this paper, based on machine learning methods, three different material design strategies for optimizing the stress corrosion resistance (SCC) behavior of Al-Zn-Mg-Cu-Zr-Ti-Y-Ce alloys were investigated. Then, the optimization ability of the three material design strategies was compared. Finally, the designed Al alloy with the best SCC resistance using the material design strategy was compared with the traditional 7N01 alloy.
2. Material design strategies and experimental methods
2.1. Initial data set
For this paper, several elements which exert positive effect on the SCC behavior were added into 7XXX series Al alloys, such as Zr, Ti, Y, and Ce. The designed alloys are marked as Al-x1Zn-x2Mg-x3Cu-x4Zr-x5Ti-x6Y-x7Ce. Every doping element could vary in steps of 0.01% with constraints x1 ∈[5.00, 8.40], x2 ∈[1.20, 2.90], x3 ∈[1.20, 2.60], x4 ∈[0.08, 0.25], x5 ∈[0.02, 0.20], x6 ∈[0.00, 0.50], and x7 ∈[0.00, 0.50] (values given in w%). Then, 40 groups of Al alloys were cast within the composition range, including 10 groups of quaternary alloys (Al-Zn-Mg-Cu), 20 groups of seven-membered alloys (Al-Zn-Mg-Cu-Zr-Ti-Y and Al-Zn-Mg-Cu-Zr-Ti-Ce), and 10 groups of eight-membered alloys (Al-Zn-Mg-Cu-Zr-Ti-Y-Ce). Subsequently, 40 data sets with inputs of Al composition and the output of electrical conductivity (σ) were obtained. The initial 40 data sets are given in the Appendix. As well known, SCC generally occurs in the potential sensitive area and has a certain internal correlation with the electrical properties of Al alloys. Research has suggested that the SCC resistance of Al alloys is positively correlated with its electrical conductivity [32, 33]. Therefore, electrical conductivity is often used to evaluate the SCC resistance of Al alloys [34–36]. Hence, electrical conductivity (σ) is taken as the preliminary target output value.
2.2. Material design strategies based on a machine learning method
The learning loop was divided into six parts, which are illustrated in figure 1. The first part was setting up the initial data set, including the 40 data sets mentioned above. The electrical conductivity was measured as the output. In the second part, a surrogate model called Kriging was trained to establish the relationship between composition and electrical conductivity. The Kriging model can be represented as follows:

where  is the coefficient of the basis function,
  represents the basis function, and
  expresses the Gaussian random process error, which obeys the normal distribution. The mean square error (MSE) at a point can be expressed by the uncertainty.
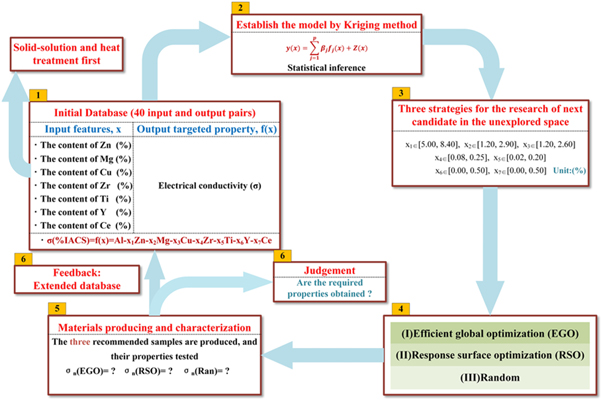
Figure 1. The material learning loop using machine learning methods: (1) The initial database contains the electrical conductivity after solid-solution and heat treatment for samples with different compositions. (2) The surrogate model is trained. (3) The design space for the different strategies. (4) The three different machine learning strategies. (5) The sample recommend by each method is produced and electrical conductivity measured. (6) If the desired properties are obtained, the process stops; otherwise, the three new data points are added to the database, and the loop is restarted with the updated database.
Download figure:
Standard image High-resolution imageThen, in the third part, the efficient global optimization (EGO), response surface optimization (RSO), and Random methods were applied to search for the next candidate in the unexplored space. The Random strategy resembles the trial-and-error approach which is commonly used in traditional material design. Input points were randomly generated in the unknown space, and it has the maximum uncertainty. The RSO method uses the maximum value predicted by the Kriging model in the unsearched space as the optimal result, which is an exploitation process. The EGO strategy makes further improvement on the RSO strategy and combines the predicted values by MSE, which is call the 'expected improvement (EI)' function, to determine the next iteration point. Let  be the current best function value. Before the x is sampled, the value y(x) is uncertain. However, the predicted value,
  and standard deviation, s, of the prediction function can be used to establish the normal random distribution Y,
  Formally, the improvement of the point x is
  To obtain the expected improvement, the expected value is taken as follows:


where  and
and  are the standard normal density and distribution function, respectively. The search process of EI is called exploration. EI is able to balance the relationship between a better target value and the uncertainty of the model. If the maximum value of the EI function could be selected, both global and convergence can be considered. Based on the three strategies, different methods are chosen for the next candidate. For the Random method, the randomly generated input value is regarded as the candidate. For the RSO method, the optimal value predicted by the response surface is treated as the candidate. For the EGO method, the input point corresponding to the maximum EI is the next candidate. Candidates obtained by the three strategies were heat treated with same parameters and tested in same way.
In the last part, the three different candidates are fed back into the database to extend it. However, if the required property is obtained, the material design loop can immediately break.
2.3. Experimental procedures
The detailed manufacturing process of the alloys used in the learning loop is shown in figure 2(a). The Al-x1Zn-x2Mg-x3Cu-x4Zr-x5Ti-x6Y-x7Ce alloys calculated in the learning loop were prepared in an electric resistance furnace, and the burning loss rate of different elements was taken into account. The specimens were machined into gauge dimensions of 20 × 20 × 5 mm3 and were polished using 400, 800, 1200, and 1500 grit abrasive papers to guarantee the surface consistency. Then, the specimens were solution treated at 470 °C for 2 h and then aged at 120 °C for 8 h and 170 °C for 12 h. Lastly, the electrical conductivities were measured by a 7501 Eddy current conductometer.

Figure 2. The detailed manufacturing process of (a) the alloys used in the learning loop and (b) the EGO alloy.
Download figure:
Standard image High-resolution imageThe detailed manufacturing process of the highest conductivity Al alloy obtained by the EGO strategy (called 'EGO alloy' below) is shown in figure 2(b). The EGO alloys were cast in a preheated cylindrical iron mold with an interior diameter of 90 mm. After a homogenizing treatment at 465 °C for 24 h, the obtained ingots were machined into ∅86 mm cylinders and then extruded at 420 °C with an extrusion ratio of 10. Then, the EGO alloy and 7N01 alloy were heat treated with the same parameters, as shown in table 1, including a single-aging treatment (referred to as '(1)') and a double-aging treatment (referred to as '(2)'). The final SCC susceptibility was studied using a slow strain rate test (SSRT) at a strain rate of 1.0 × 10⁻⁶ s−1 in air and a 3.5 wt% NaCl solution. The specimens were polished by 1500 grit abrasive paper before testing. In order to ensure reproducibility of the experiments, each test was repeated at least three times. The SCC susceptibility is evaluated by:

where Asol and Aair are the area enclosed by the stress–strain curve of specimens in air and in the 3.5 wt% NaCl solution, respectively.
Table 1. Heat treatment processes for the EGO and 7N01 alloys.
| No. | Material | Solid solution | Heat treatment |
|---|---|---|---|
| 1 | EGO alloy(1) | 470 °C–2 h | 120 °C–24 h |
| 2 | 7N01 alloy(1) | 470 °C–2 h | 120 °C–24 h |
| 3 | EGO alloy(2) | 470 °C–2 h | 120 °C–8 h + 170 °C–12 h |
| 4 | 7N01 alloy(2) | 470 °C–2 h | 120 °C–8 h + 170 °C–12 h |
In order to identify the phases of the EGO alloy, x-ray diffraction (XRD) analysis was performed with a Bruker D8 ADVANCE A25X. The specimens were 10 × 10 × 4 mm3. The x-ray scanning ranged from 5° to 85°. Fracture morphology and microstructure were study with a JEOL JSM 7800F field emission scanning electron microscope (SEM), and the elemental determination employed an Oxford X-Max 80 energy dispersive spectrometer (EDS).
3. Results and discussion
3.1. Comparison of the three material design strategies
After establishing the Kriging model, the accuracy of the surrogate model needed to be verified to see if the model can be used for the next optimization. Generally, model verification includes a number of common methods. For the Kriging response surface, the most accurate verification method is 'cross-validation.' Jones et al [37] pointed out that taking out a sample point to form training data has minimal impact on the accuracy of the fitted response surface unless the sample points are very small, which is also a prerequisite for cross-validation. Standard cross-validation residual were proposed for evaluating the surface accuracy, and the formula is shown below:

where  is the true objective function value of sample points
  and
and  and
and  represent, respectively, the predicted values and the MSE calculated by fitting the response surface where x(i) x(i) is taken out. It is generally considered that if the residual of the surrogate model is within [−3, +3], the model can be used for the next calculation. At this point, the model was approximately 99.7% confident that y(x(i)) would lie in the ±3 MSE interval of
  so the model accuracy was high enough.
Figure 3 shows the response surface cross-validation of the 40 initial training data, in which (a) and (b) are the initial response surface cross-validation and standard cross-validation residuals, respectively. It can be observed clearly from figure 3(a) that some data points are close to the standard 45° line, while others are far away. This indicates that Kriging model has good predictability for many points and poor predictability for a few points, which mainly depends on whether the distribution of initial points is concentrated. Figure 3(b) exhibits that all the residuals fall in the range of [−3, 3] with a uniform distribution and no obvious trend with respect to the predicted value. Therefore, the response surface model-Kriging model built by the initial training set meet the requirement of precision, which allowed it to be used for the material design strategies.

Figure 3. Response surface cross-validation of initial training data: (a) initial response surface cross-validation and (b) standard cross-validation residuals.
Download figure:
Standard image High-resolution imageAfter cross-validation, the obtained Kriging model was employed for material design optimization in the next step. The material design strategies mentioned above (EGO, RSO, and Random) were used for four iterations each, and an Al alloy with a different composition was obtained in each iteration. Figure 4 shows the results predicted by each of the material design methods. The iterative feedback loops were performed four times; thus, four alloys were predicted and synthesized for each of the three methods (twelve alloys in total that are listed in table 2). After each iteration, the electrical conductivities of the calculated Al alloys were measured, and the results, augmented by the training data, led to a new round of regression and design. In figure 4, it can be extrapolated that the Random method is similar to the common trial-and-error method. Conductivities obtained by the Random method had low values due to the complexity of search space. However, conductivities of Al alloys designed by the RSO method are much higher than the Random method. The values of the four iterations are 38.899, 38.790, 39.992, and 39.756 (% IACS) respectively. The 3rd and 4th iterations had higher conductivity than the maximum of the initial training set (39.092% IACS). Based on a trade-off between exploitation and exploration, the EGO strategy, compared to the RSO strategy, performs better and produces the best performer in every iteration. On the 3rd iteration, the Al alloy (Al-6.05Zn-1.46Mg-1.32Cu-0.13Zr-0.02Ti-0.50Y-0.23Ce) with the highest conductivity of 42.15 % IACS was obtained. The cross-validation results of the final model after iteration using the EGO strategy are shown in figure 5. The 40 initial data are not completely on the standard 45° line and were on both sides of the line. However, the error ranges of almost all points intersect the standard 45° line. At the same time, the four points iterated by EGO are close to the 45° line, which indicates that the prediction ability of the model (near the iteration point) is significantly improved.

Figure 4. The measured conductivity of the Al alloys predicted by each of the material design methods.
Download figure:
Standard image High-resolution imageTable 2. The predicted and measured conductivities of Al alloys from different material design strategies.
| Iteration No. | Strategy | Composition | Predicted values (% IACS) | Measured values (% IACS) |
|---|---|---|---|---|
| 1 | EGO | Al-5.93Zn-1.46Mg-1.23Cu-0.19Zr-0.11Ti-0.50Y-0.40Ce | 39.591 ± 2.299 | 40.227 |
| 1 | RSO | Al-5.48Zn-1.52Mg-1.22Cu-0.19Zr-0.12Ti-0.50Y-0.47Ce | 39.826 ± 0.814 | 38.899 |
| 1 | Random | Al-7.07Zn-2.78Mg-1.77Cu-0.12Zr-0.05Ti-0.35Y-0.12Ce | 30.455 ± 1.490 | 33.456 |
| 2 | EGO | Al-5.53Zn-1.45Mg-1.20Cu-0.08Zr-0.20Ti-0.50Y-0.50Ce | 39.877 ± 0.946 | 39.221 |
| 2 | RSO | Al-5.73Zn-1.49Mg-1.22Cu-0.19Zr-0.11Ti-0.50Y-0.43Ce | 40.269 ± 0.050 | 38.790 |
| 2 | Random | Al-6.42Zn-2.11Mg-2.29Cu-0.19Zr-0.17Ti-0.02Y-0.12Ce | 31.996 ± 0.399 | 34.887 |
| 3 | EGO | Al-6.05Zn-1.46Mg-1.32Cu-0.13Zr-0.02Ti-0.50Y-0.23Ce | 39.946 ± 0.971 | 42.152 |
| 3 | RSO | Al-5.97Zn-1.49Mg-1.26Cu-0.25Zr-0.06Ti-0.50Y-0.36Ce | 40.403 ± 0.080 | 39.992 |
| 3 | Random | Al-6.57Zn-2.74Mg-1.37Cu-0.16Zr-0.08Ti-0.35Y-0.28Ce | 32.143 ± 5.044 | 34.217 |
| 4 | EGO | Al-5.88Zn-1.38Mg-1.36Cu-0.08Zr-0.02Ti-0.50Y-0.06Ce | 42.073 ± 0.750 | 41.598 |
| 4 | RSO | Al-6.03Zn-1.45Mg-1.35Cu-0.08Zr-0.02Ti-0.50Y-0.15Ce | 42.394 ± 0.095 | 39.756 |
| 4 | Random | Al-5.29Zn-2.38Mg-2.44Cu-0.24Zr-0.18Ti-0.15Y-0.28Ce | 32.550 ± 4.092 | 32.295 |
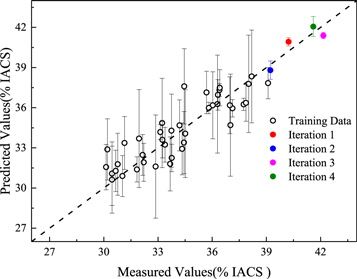
Figure 5. The cross-validation results of the final model after iteration by the EGO strategy.
Download figure:
Standard image High-resolution image3.2. SCC susceptibility tested by SSRT
The typical strain–stress curves of the EGO and 7N01 alloys in air and the 3.5 wt% NaCl solution are displayed in figure 6. Figure 6(a) shows the strain–stress curves of the Al alloys treated by single aging treatment (EGO(1) and 7N01(1)). It reveals that the SCC phenomenon occurs in both the EGO(1) alloy and 7N01(1) alloy. The ultimate strain of the EGO(1) alloy had some loss but the strength was almost unchanged, while the ultimate strength and strain of 7N01(1) alloy decreased more severely. Figure 6(b) shows the strain–stress curves of the Al alloys with the double-aging treatment (EGO(2) and 7N01(2)). It reveals that the curves of the EGO(2) alloy in 3.5 wt% NaCl and in air almost overlap, which indicates no SCC occurred, while the ultimate strain of the 7N01(2) alloy reduced relatively significantly.

Figure 6. Typical strain–stress curves of the EGO and 7N01 alloys in air and 3.5 wt% NaCl solution at a rate of 1.0 × 10⁻⁶ s−1 for (a) the single-aging heat treatment and (b) the double-aging heat treatment.
Download figure:
Standard image High-resolution imageFigure 7 shows the loss factors (ISCC) of the EGO and 7N01 alloys under the single and double aging treatment. A high ISCC means high SCC susceptibility [38, 39]. Figure 7 reveals that the ISCC of the EGO alloy(1) is only 6.82%, which is significantly lower than that of the 7N01 alloy(1) with an ISCC of 23.55%. This indicates that the EGO alloy(1) has lower stress corrosion cracking susceptibility. Meanwhile, the ISCC of the EGO(2) alloy is only 1.15%, and the ISCC of the 7N01(2) alloy is 13.16%, which is much higher than that of the EGO(2) alloy. The ISCC results confirm that the EGO alloy has better SCC resistance compared with the traditional 7N01 alloy. In particular, the EGO alloy with the double-aging treatment has almost no stress corrosion cracking.
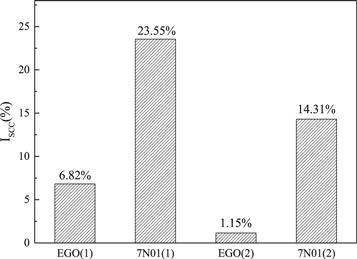
Figure 7. The ISCC of the EGO and 7N01 alloys.
Download figure:
Standard image High-resolution image3.3. Mechanisms for improved SCC resistance
Figures 8(a) and (c) show the SSRT fracture micrographs of the single- and double-aged EGO alloys in air. It can be observed that the fracture modes of both the single- and double-aged EGO alloys are mainly ductile transgranular fracture in nature because of the number of dimples on the fracture surface. The effect of heat treatment on the SSRT fracture mode is not significant in air. Figure 8(b) shows the SSRT fracture morphology of the single-aged EGO alloy in a 3.5 wt% NaCl solution. Some corrosion marks appear on the fracture surface, as well as cleavage step and many dimples, which indicates that the fracture mode is a mixed ductile and plastic fracture. Figure 8(d) shows the SSRT fracture morphology of double-aged EGO alloy in a 3.5 wt% NaCl solution. Similarly, there exist some corrosion marks and many dimples and tearing ridges on the fracture surface. In general, SCC fracture surfaces have more intergranular fracture marks, like rock candy fracture or cleavage steps, because SCC begins at grain boundaries. However, the SEM micrographs show little trace of intergranular failure, as shown figures 8(b) and (d), which indicates that the EGO alloy has great SCC performance.
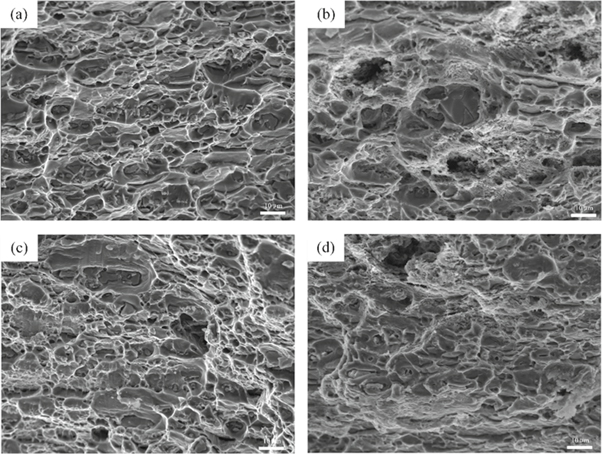
Figure 8. SEM fracture images of the SSRT samples: (a) EGO alloy with single-stage aging treatment tested in air, (b) EGO alloy with single-stage aging treatment tested in a 3.5 wt% NaCl solution, (c) EGO alloy with double-stage aging treatment tested in air, and (d) EGO alloy with double-stage aging treatment tested in a 3.5 wt% NaCl solution.
Download figure:
Standard image High-resolution imageFigure 9 shows the XRD diffraction patterns of the as-cast and double-aged EGO alloys. It reveals that the major phases in the as-cast alloy were α-Al and Al8Cu4Ce, and in the double-aged EGO alloys were α-Al, MgZn2, and Al8Cu4Ce. This indicates that the rare elements exist in the form of Al8Cu4Ce. Figure 10 shows the SEM images and EDS patterns of the as-cast and double-aged EGO alloys. There are various shapes of phases distributed in the as-cast EGO alloy, as shown in figure 10(a). According to the EDS energy spectrum, the elements at point A include Al, Zn, Mg, Cu, Y, and Ce. The Mg element content is very low, which can be almost ignored. Combined with XRD analysis, it can be concluded that this phase should be Al8Cu4(Y, Ce), with some Zn dissolved in this phase. In figure 10(a), another quadrilateral phase at point B has a different elemental distribution. Analyzing the EDS energy spectrum, the quadrilateral phase contains Ti and rare earth elements Y and Ce, which is identified as Al20Ti2(Y, Ce) with some Zn and Mg dissolved in it. Figure 10(b) exhibits the SEM images and EDS patterns of the EGO alloy after the double-stage aging treatment. It shows that there are mainly two phases in the alloy, shown by a difference in color. It can be seen from the EDS energy spectrum analysis that the phases with the two different colors are the same as those in the as-cast aluminum alloy, namely Al8Cu4(Y, Ce) and Al20Ti2(Y, Ce).

Figure 9. XRD patterns of the as-cast and double-stage aged EGO alloy.
Download figure:
Standard image High-resolution image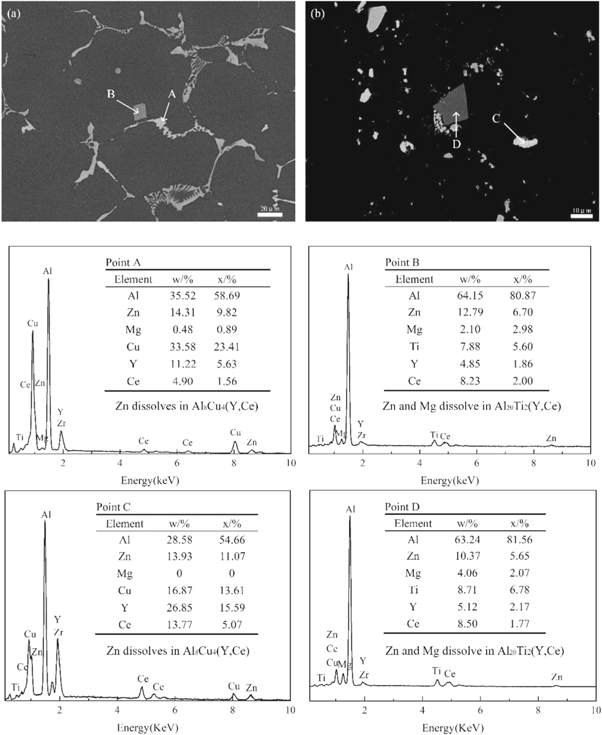
Figure 10. SEM images and EDS patterns of the EGO alloy: (a) the as-cast EGO alloy and (b) the double-aged EGO alloy.
Download figure:
Standard image High-resolution image
Al-Zn-Mg-Cu alloy is prone to SCC under the combined action of a corrosive medium and stress. After the aging treatment, there exists a prominent potential difference between the grain boundary precipitated by η(MgZn2) and the Al matrix in Al-Zn-Mg-Cu alloy, which causes an anode dissolution channel, also called a corrosion channel. SCC occurs along grain boundaries with the effect of stress. A stress concentration forms at the crack source, which accelerates the crack propagation. Then, the expanded cracks accumulate into large ones that causes stress corrosion cracking [40, 41]. However, the addition of rare earth elements Ce and Y into the Al-Zn-Mg-Cu alloy make the rare earth phase Al8Cu4(Y, Ce) and Al20Ti2(Y, Ce) form which are mentioned above. Some Zn and Mg elements are dissolved in the two rare earth phases, which make the η(MgZn2) content decline and distribute discontinuously at the grain boundary. Therefore, the continuous anode channel is not easily formed during the corrosion process, which improves the corrosion resistance of the alloy.
Hydrogen embrittlement also gives rise to SCC behavior. Active hydrogen atoms generated by an aqueous solution are concentrated at areas of stress concentration (including the crack tip), the defect grain boundary, and areas of dislocation concentration, resulting in material embrittlement and hydrogen-induced cracking [41]. However, rare earth elements Ce and Y have greater affinity with H atoms due to characteristic of their electronic structure, and they can dissolve and absorb H atoms in large quantities. Meanwhile, rare earth oxide films are easily generated by rare earth element and O; as a result, a layer of oxide film covering the substrate is able to prevent the H from penetrating, which reduces the concentration of H atoms on the grain boundary, resulting in lower SCC susceptibility [42]. Finally, Ce in corrosive environments is inclined to produce a chemical reaction with the corrosion medium, Cl− and O2−, which generates the dense reaction products Ce-containing oxide or Ce-containing chloride. Reaction products as the passivation layer are adsorbed by the surface of the Al substrate to reduce the pitting corrosion damage by Cl−, and effectively prevent the further corrosion [43, 44].
4. Conclusion
The conclusions of the paper can be summarized as follows:
- 1.The efficient global optimization (EGO) method, making a trade-off between exploitation and exploration, performed better than the response surface optimization method, and performed much better than the Random method, in finding a 7XXX series Al alloy with improved SCC resistance. Using an initial database containing the composition and conductivity of 40 samples, a learning loop was iterated four times using all three methods with the conductivity as a proxy for SCC resistance. The composition Al-6.05Zn-1.46Mg-1.32Cu-0.13Zr-0.02Ti-0.50Y-0.23Ce, obtained by the EGO strategy, had the best SCC resistance.
- 2.The EGO alloy had better SCC resistance than the traditional 7N01 alloy. After single-aging and double-aging heat treatments, the Iscc values of the EGO alloy were significantly lower than the 7N01 alloy (6.82% and 1.15% compared to 23.55% and 14.31%).
- 3.The addition of rare earth elements Y and Ce formed the Al8Cu4(Y, Ce) and quadrilateral Al20Ti2(Y, Ce) phases, which improve the stress corrosion cracking (SCC) resistance of 7XXX Al alloys by decreasing the amount of η(MgZn2) on the grain boundaries, which disrupts the continuous anode channels; by forming rare earth oxide films, which help prevent hydrogen embrittlement; and by creating dense Ce-containing oxides and chlorides, which passivate against pitting damage.
In this paper, the iterative feedback loops were only performed four times due to the limitations of time and experiment. If iterative feedback loops could be done more times, the performance of the alloy would improve. At the same time, further development of basic model (Kriging model in this paper) can also reduce the number of iterations necessary in EGO strategy. Only a single objective function (electrical conductivity) was used for composition optimization. If possible, a multi-objective function combining electrical conductivity and hardness could be used for optimization so that the mechanical properties and corrosion resistance would be improved simultaneously.
Material design by machine learning methods is a significant part of 'Materials Genome Initiative' proposed in 2011. This paper shows the great potential of machine learning in composition design. In fact, machine learning has many more applications, including material properties prediction and the improvement of material simulation calculation methods. Another effective method, the phase field method which was mentioned previously, is also one of the main computational tools in the 'Materials Genome Initiative.' It can also be a powerful tool in future of material property prediction and design. Future advances in material design may result not from the development of a single approach but a combination of multiple technologies, which will make the field sustainable.
Acknowledgments
The present study is supported by the National key Research and Development Program of China (Grant No. 2016YFB0700505). We would like to thank Editage (www.editage.com) for English language editing.
Appendix
The initial 40 data sets.
| No. | Al(%) | Zn(%) | Mg(%) | Cu(%) | Zr(%) | Ti(%) | Y(%) | Ce(%) | Electrical conductivity(%IACS) |
|---|---|---|---|---|---|---|---|---|---|
| 1 | 87.73 | 8.23 | 1.82 | 2.21 | 0.00 | 0.00 | 0.00 | 0.00 | 36.405 |
| 2 | 88.06 | 7.69 | 1.92 | 2.33 | 0.00 | 0.00 | 0.00 | 0.00 | 37.742 |
| 3 | 87.87 | 7.53 | 2.03 | 2.57 | 0.00 | 0.00 | 0.00 | 0.00 | 36.032 |
| 4 | 87.62 | 8.25 | 2.22 | 1.90 | 0.00 | 0.00 | 0.00 | 0.00 | 37.009 |
| 5 | 88.60 | 7.80 | 2.26 | 1.34 | 0.00 | 0.00 | 0.00 | 0.00 | 33.245 |
| 6 | 87.94 | 7.36 | 2.35 | 2.35 | 0.00 | 0.00 | 0.00 | 0.00 | 33.130 |
| 7 | 87.11 | 7.89 | 2.56 | 2.44 | 0.00 | 0.00 | 0.00 | 0.00 | 33.762 |
| 8 | 89.07 | 6.30 | 2.70 | 1.93 | 0.00 | 0.00 | 0.00 | 0.00 | 30.457 |
| 9 | 87.04 | 8.08 | 2.77 | 2.12 | 0.00 | 0.00 | 0.00 | 0.00 | 34.336 |
| 10 | 90.59 | 5.12 | 2.88 | 1.41 | 0.00 | 0.00 | 0.00 | 0.00 | 30.658 |
| 11 | 87.47 | 8.11 | 1.51 | 2.29 | 0.14 | 0.07 | 0.41 | 0.00 | 37.123 |
| 12 | 87.09 | 7.15 | 2.74 | 2.20 | 0.22 | 0.14 | 0.45 | 0.00 | 30.457 |
| 13 | 90.63 | 5.54 | 2.21 | 1.24 | 0.18 | 0.14 | 0.06 | 0.00 | 31.951 |
| 14 | 89.12 | 6.43 | 1.70 | 2.06 | 0.17 | 0.05 | 0.46 | 0.00 | 36.980 |
| 15 | 87.15 | 8.11 | 1.74 | 2.40 | 0.24 | 0.04 | 0.32 | 0.00 | 36.319 |
| 16 | 87.74 | 7.31 | 2.78 | 1.89 | 0.13 | 0.11 | 0.05 | 0.00 | 30.199 |
| 17 | 88.74 | 6.33 | 2.18 | 2.20 | 0.21 | 0.19 | 0.14 | 0.00 | 31.147 |
| 18 | 88.04 | 7.80 | 2.26 | 1.34 | 0.21 | 0.08 | 0.27 | 0.00 | 33.388 |
| 19 | 89.84 | 5.12 | 2.88 | 1.41 | 0.14 | 0.13 | 0.48 | 0.00 | 31.032 |
| 20 | 87.37 | 7.20 | 2.36 | 2.36 | 0.18 | 0.06 | 0.48 | 0.00 | 31.837 |
| 21 | 86.46 | 8.08 | 2.77 | 2.12 | 0.09 | 0.16 | 0.00 | 0.33 | 32.153 |
| 22 | 88.90 | 6.65 | 2.41 | 1.87 | 0.09 | 0.07 | 0.00 | 0.02 | 33.675 |
| 23 | 89.26 | 7.23 | 1.35 | 1.46 | 0.17 | 0.11 | 0.00 | 0.42 | 38.018 |
| 24 | 90.87 | 5.12 | 1.65 | 1.54 | 0.21 | 0.15 | 0.00 | 0.47 | 34.452 |
| 25 | 89.85 | 5.11 | 2.13 | 2.15 | 0.24 | 0.18 | 0.00 | 0.34 | 32.871 |
| 26 | 90.04 | 5.94 | 2.09 | 1.26 | 0.10 | 0.19 | 0.00 | 0.38 | 34.509 |
| 27 | 89.04 | 6.08 | 1.87 | 2.34 | 0.18 | 0.12 | 0.00 | 0.37 | 34.193 |
| 28 | 86.68 | 7.60 | 2.75 | 2.56 | 0.16 | 0.04 | 0.00 | 0.20 | 30.773 |
| 29 | 87.18 | 7.70 | 2.55 | 2.11 | 0.08 | 0.05 | 0.00 | 0.33 | 32.210 |
| 30 | 89.57 | 6.67 | 1.65 | 1.84 | 0.14 | 0.07 | 0.00 | 0.09 | 37.871 |
| 31 | 88.44 | 7.77 | 1.73 | 1.35 | 0.11 | 0.17 | 0.08 | 0.35 | 36.290 |
| 32 | 89.96 | 5.43 | 1.93 | 1.89 | 0.22 | 0.07 | 0.49 | 0.02 | 33.230 |
| 33 | 88.74 | 5.95 | 1.95 | 2.45 | 0.13 | 0.17 | 0.48 | 0.14 | 34.437 |
| 34 | 87.43 | 8.26 | 1.64 | 2.18 | 0.17 | 0.06 | 0.24 | 0.02 | 35.816 |
| 35 | 87.49 | 7.72 | 1.58 | 2.47 | 0.11 | 0.19 | 0.40 | 0.05 | 35.687 |
| 36 | 87.31 | 7.69 | 1.92 | 2.33 | 0.18 | 0.08 | 0.07 | 0.41 | 33.747 |
| 37 | 86.37 | 7.89 | 2.56 | 2.44 | 0.12 | 0.06 | 0.21 | 0.35 | 30.127 |
| 38 | 88.39 | 7.23 | 1.60 | 1.90 | 0.19 | 0.07 | 0.46 | 0.16 | 36.420 |
| 39 | 90.75 | 5.16 | 1.59 | 1.30 | 0.20 | 0.13 | 0.40 | 0.48 | 39.092 |
| 40 | 89.03 | 7.41 | 1.43 | 1.32 | 0.21 | 0.11 | 0.48 | 0.02 | 38.187 |