
Abstract
The great interest in the study of diamond-like carbon films (a-C:H) is justified by its mechanical and tribological properties. However, the high internal stress of the film results in its difficult adhesion to the metallic substrate, which can be solved by nitrogen incorporation in the a-C:H film, allowing a formed film of lower internal stress. The objective of this work is to evaluate the influence of flow (20, 30 and 40sccm), CH4/Ar ratio (90/10 and 70/30) and voltage (400, 500, 600 and 700 V) in the a-C:H formation. For the best condition of the film, we studied the effect of nitrogen incorporation in the hardness and wear resistance of the a-C:H(N), modifying the nitrogen percentage in the treatment at 10% to 60% N2. The treatments were carried out in the Ti6Al4V substrate by DC-PECVD for two hours. For good adhesion of the films on the substrate, a silicon interlayer must be produced. The increase in the voltage above 600 V increases the ID/IG and film thickness, causing its delamination, and the gas ratio did not influence the a-C:H characteristics. The a-C:H film deposited with 30 sccm, 90/10 and 500 V was characterized as a-C:H (hard), with properties such as the hardness of 17 GPa, 30% H, 39% sp3 and ID/IG ratio of 0.58. Since nitrogen reduced the deposition rate, the total gas flow for the production of a-C:H(N) was performed with 40 sccm. The Raman spectra of a-C:H(N) films showed changes in D band intensity and displacement in relation to the nitrogen-free film spectrum, evidencing the incorporation of nitrogen in the film. The XPS analysis showed the linear increase of the nitrogen incorporation in the a-C:H(N) film with the increase of the amount of the N2 gas in the treatment, which caused, in general, a decrease in the amount of C–C sp3 bonding, increasing the adhesion of the film in the substrate and not necessarily the low wear resistance of the formed film.
Export citation and abstract BibTeX RIS

Original content from this work may be used under the terms of the Creative Commons Attribution 4.0 licence. Any further distribution of this work must maintain attribution to the author(s) and the title of the work, journal citation and DOI.
1. Introduction
Carbon is one of the elements of great highlight, as it can form a variety of structures with intrinsic properties related to each formed material, explained by the different hybridization that this element can present [1–3]. The bonds between the sp3 carbon characterize the diamond formation, while the sp2 bonds are presented in the graphite and sp1 bonds form the hydrocarbons [4–6]. Carbon also can form graphene (which gives rise to carbon nanotube—NTCs), fullerenes and DLC films.
The DLC films correspond to the formation of an amorphous carbon structure, with the presence of sp2 and sp3 bond of carbon in different proportions that, together with the amount of hydrogen, determined the kind and property of the film produced [7]. The nomenclatures of the DLC films are tetrahedral amorphous carbon (ta-C), hydrogenated tetrahedral amorphous carbon (ta-C:H), hard hydrogenated amorphous carbon (a-C:H) and soft hydrogenated amorphous carbon (a-C:H) [4, 8].
According to Robertson [4] the DLC film that presents hydrogen concentrations between 30 and 50% receives the nomenclature of hydrogenated amorphous carbon (a-C:H), and presents lower hardness and internal stress than ta-C, facilitating the adhesion process of the film in the metallic substrates. This occurs due to sp2 bonds formed in detriment of sp3 bonds.
The DLC films have been used in a variety of applications due to their notable properties, as protective coatings against wear and corrosion, in optical windows (optical filters), data storage hard drives, high performance automotive parts, coatings for biomedical products and electromechanical microdevices [9–12].
However, as reported by Chen et al [13] and confirmed by Cemin et al [11], the high intrinsic compressive stress of the film, the high variation of the elastic coefficient, the difference in thermal expansion and the low chemical affinity between DLC and substrate difficult the adhesion process of the DLC film mainly when deposited on metallic surfaces. Thus, the use of techniques as oxide layer removal and the use of film interlayer previously to the DLC film deposition can improve this adhesion feature. Another used technique consists of the doping of the film with different elements, such as boron, fluorine and nitrogen, which has been widely used to relieve the internal stress of the film [14–16].
The effects of the nitrogen incorporating in DLC film is the reduction of the internal stress due to the decrease in the formation of carbon atoms with sp3 hybridization. As a consequence, the film hardness is reduced and the DLC film adhesion on the substrate is facilitated, arousing interest in synthesis and application of these films [15–21, 67].
The production of DLC and N-DLC films by plasma enhanced chemical vapor deposition (PECVD) technique comes as a potential alternative of a surface treatment since it presents a relatively low cost, clean technology and formation of the homogeneous and uniform film [9, 22]. This technique is being the focus of research for DLC film formation in Ti6Al4V alloy for space application [23], for application of DLC film in 316L stainless steel to act as anti-bactericidal agent in biomedical device [24], used to produce DLC film on inner surface of a long stainless steel tube [25], used to show the beneficial effects on the increased electrochemical activity of the DLC film doped with nitrogen [16, 26] and to investigate the lubricating effect of the DLC film doped with nitrogen deposited on 3024 stainless steel to improve the tribocorrosion properties of the studied material [27].
Since nitrogen is a low cost and environmentally friendly gas, it could be used to modify the undesirable properties of the DLC film, maintaining the high hardness and low coefficient of friction characteristic of the a-C:H films. The objective of this work is to produce the a-C:H and a-C:H(N) film on Ti6Al4V alloy substrate by PECVD, and to study the effects of the deposition parameters and the nitrogen incorporation on the physical, tribological, mechanical and adhesive properties of the film.
2. Experimental
In this work we used the Ti6Al4V alloy with a dimension of 13 × 13 × 9 mm and blade of colorless glass with a dimension of 10 × 25 × 1.2 mm to carry out the film deposition. The metal sample was abraded by using water sandpaper, and polished with 3 μm diamond paste. The cleaning of the samples was carried out with water and detergent and then isopropyl alcohol, then they were put on ultrasound for 5 min each stage and dried with the use of a thermal blower.
2.1. Films deposition by pulsed DC—PECVD
The film deposition was carried out by pulsed DC—PECVD technique at the Laboratory of Technology and Surface Engineering (LabTES) of Sorocaba Technological College (Fatec Sorocaba) located in Sorocaba, São Paulo—Brazil. The detailed description of the equipment is presented in Cruz et al [28].
The cleaning of the samples by plasma ablation process was carried out using argon (50%) and hydrogen (50%) gases at a pressure of 2.0 torr by 30 min, a voltage of 350 V and a temperature range from 250 to 300 °C.
The interlayer deposition was carried out immediately after the ablation process using hexamethyldisiloxane (HMDSO) as a precursor in a proportion of 70% HMDSO and 30% Ar by 15 min, voltage of 500 V, the temperature of 200 °C and 6.0 × 10⁻² torr of total pressure gases. After that, without opening the reactor, the a-C:H and a-C:H(N) film deposition was performed.
The a-C:H film was deposited from the gases methane (CH4) and argon (Ar), studding the effect of total gas flow (20, 30 and 40 sccm keeping constant 500 V and 90% CH4–10% Ar), gas proportion (90% CH4–10% Ar and 70% CH4–30% Ar keeping constant 500 V to all gas flow studied) and treatment power (400 V, 500 V, 600 V and 700 V keeping constant 30 sccm and 90% CH4–10% Ar) in the film production. The treatment parameters are presented in table 1.
Table 1. Treatment parameters for the production of a-C:H and a-C:H(N) film and results of the visual analyses of all formed films.
| a-C:H Film | ||||||
|---|---|---|---|---|---|---|
| Total gas flow (sccm) | Gas proportion (%) | Voltage (V) | Time (h) | Temperature (°C) | Visual aspect | |
| a-C:H-20_70/30 | 20 | 70 CH4–30 Ar | 500 | 2 | 167–102 | poorc |
| a-C:H-20_90/10 | 90CH4–10 Ar | 150–105 | poorc | |||
| a-C:H-30_70/30 | 30 | 70CH4–30 Ar | 150–110 | poorb | ||
| a-C:H-30_90/10 | 90 CH4–10 Ar | 160–119 | good | |||
| a-C:H-40_70/30 | 40 | 70 CH4–30 Ar | 149–117 | good | ||
| a-C:H-40_90/10 | 90 CH4–10 Ar | 137–90 | good | |||
| a-C:H-400 V | 30 | 90 CH4–10 Ar | 400 | 150–72 | poora | |
| a-C:H-500 V | 500 | 150–109 | good | |||
| a-C:H-600 V | 600 | 162–104 | good | |||
| a-C:H-700 V | 700 | 171–149 | poorb | |||
| a-C:H(N)-30_80/20 | 30 | 80 CH4–20 N2 | 500 | 150–70 | poora | |
| a-C:H(N)-40_80/20 | 40 | 80 CH4–20 N2 | 500 | 150–107 | good | |
aThin film. bPartially delaminated and. cCompletely delaminated.
The best parameter for the production of the a-C:H film was considered for the production of a-C: H(N) film. For this treatment, the argon gas was replaced by nitrogen gas. The treatment parameter for this stage is presented in table 2. The proportion of nitrogen ranged from 10 to 60%, keeping the other parameters constant.
Table 2. Treatment parameters to study the nitrogen incorporation effect in a-C:H film deposition and results of the visual analyses of nitrogenated films.
| Nitrogen Incorporation on a-C:H Film | ||||||
|---|---|---|---|---|---|---|
| Total gas flow (sccm) | Gas proportion (%) | Voltage (V) | Time (h) | Temperature (°C) | Visual aspect | |
| a-C:H-40_0%N2 | 40 | 90 CH4–10 Ar | 500 | 2 | 128 | good |
| a-C:H-40_10%N2 | 90 CH4–10 N2 | 92 | good | |||
| a-C:H-40_20%N2 | 80 CH4–20 N2 | 100 | good | |||
| a-C:H-40_30%N2 | 70 CH4–30 N2 | 102 | good | |||
| a-C:H-40_40%N2 | 60 CH4– 40 N2 | 90 | good | |||
| a-C:H-40_50%N2 | 50 CH4– 50 N2 | 103 | good | |||
| a-C:H-40_60%N2 | 40 CH4– 60 N2 | 103 | good | |||
2.2. Characterization
In order to characterize the physical, tribological, mechanical and adhesive properties of the formed films, we performed visual analyses, profilometer test, Fourier transform infrared spectroscopy (FTIR) analysis, energy dispersive spectroscopy (EDS) by scanning electron microscopy (SEM) analysis, Raman Spectroscopy analysis, x-ray photoelectron spectroscopy (XPS) analysis, micro-abrasive wear test by fixed ball, nanohardness test and adhesion test by Rockwell hardness.
Visual analysis, performed in metallic and glass samples, was carried out immediately after the film deposition to verify the color, adhesion, aspect and uniformity of the formed film. The formed film was classified as 'good' (uniform, homogeneous and adherent) or 'poor' (total and partial delamination or irregular film).
The film thickness and roughness were determined by the profilometer test in the glass sample. To determine the thickness film, a glass region was covered with Kapton tape which formed a step during the deposition process. The analyses were carried out according to the ISO 468:1982 standard [29] at the Laboratory of Technological Plasma Laboratory (LaPTec) of the São Paulo State University (UNESP), Sorocaba Campus located in Sorocaba, São Paulo—Brazil using a VeecoDektak 150 equipment exerting a force of 3.00 mg on the film with horizontal scanning of 250 μm in the direction towards the step created in glass sample, with a resolution of 0.056 μm.
The determination of the compounds and bands formed in the produced film were defined by Fourier transform infrared spectroscopy (FTIR) carried out in the Ti6Al4V samples at the LaPTec of the UNESP Sorocaba Campus using a JASKO FTIR-410 Spectrometry equipment. The scanning time was 128 s and a resolution of 4 cm−1. The spectra were obtained in accordance to ASTM E1252 standard [30].
To the carbon film characterization, D and G bands were analyzed by Raman Spectroscopy in metallic samples. It was used an argon laser with 5 μm of diameter spot, the wavelength of 514 nm and power of 5% in a Renishaw—in Via Raman Microscope at the Laboratory of Carbon Sci-Tech Labs, University of Campinas (UNICAMP), located in Campinas, São Paulo–Brazil. The obtained spectra were deconvolved by the Fityk 0.9.8 software and the extracted data was analyzed using Origin Software 6.0.
The G band, found in 1560 cm−1, is related with sp2 bond, characteristic of graphitic materials, and the D band is found in 1380 cm−1, related to angular alteration of sp2 bond, that occurs due to the presence of sp3 hybridization. The ratio between the intensity bands D and G ( ), the G band displacement and the width of half of band G (FWHM(G)) were determined to obtain the microstructure information of the film. To derive the hydrogen content in film, it was used the equation (1) [31].

where I(G) is the intensity of G band and m is the inclination of spectra between 1000 and 1800 
The x-ray photoelectron spectroscopy (XPS) technique allowed to determine the carbon, nitrogen and oxygen quantity present in the produced film, besides the quantification of the sp2 and sp3 bonds between carbons and nitrogen in the films formed in metallic samples. These analyses were carried out in a spectrometer Thermo Scientific K-Alpha of the Brazilian Nanotechnology National Laboratory (LNNano), located in the Brazilian Center for Research in Energy and Materials (CNPEM), in Campinas, São Paulo—Brazil. Casa XPS software was used to calculate atomic concentration and peak fittings. The peaks were referenced to the C1s peak at binding energy (BE) of 285 eV.
The micro-abrasive wear test was carried out in the base, a-C:H and a-C:H(N) treated metal sample, using a fixed ball device, detailed in [32], with a steel sphere (AISI 52100) with radius R of 12.7 mm, 40 Hz of frequency (160 rpm), a normal load of 8 N and time of 600 s. In this test, the contact between a sphere and a flat sample forms a wear scar whose diameter d is used to determine the wear volume (V), determined in equation (2), of the tested materials [33].

After the test, the wear scar was measured by Leica model DMi8 C optical microscopy (MO) at the Metallography Laboratory of Fatec Sorocaba. It is important to mention that the micro-abrasive tests were carried out in triplicate, without any lubricant or abrasive slurry.
The nanoindentation technique was used to measure the hardness and Young Modulus using the Hysitron Triboindenter equipment located in the LaPTec in UNESP Sorocaba Campus, considering the Oliver—Pharr method [34]. We carried out 16 indentations with space of 15 μm between them, with applied load at 250 until 5000 μN (partial load-unload). The tests were conducted considering the ISO 14577-1:2015 and ASTM E2546-15 standard [35, 36]. The nanohardness was determined considering the indentation depth value of 15% of the film thickness obtained [37].
The adherence of the a-C:H and a-C:H(N) films deposited on the metal surface were measured according the VDI 3198 Indentation Test Evaluation Standard [38] by Rockwell C in a Mitutoyo - HR 300 Digital equipment conducted considering the ASTM E2546-15 standard [36]. The qualitative analyzes were carried out in the indentation area by SEM, and the quantitative analyzes were carried out by ImageJ software, comparing the total analyzed area with the delaminated region [39].
3. Results and discussion
3.1. Formation of the a-C:H and a-C:H(N) film
Table 1 presents the visual analysis results of all a-C:H films studied, observing that the parameters used to produce the a-C:H-30_70/30, a-C:H-30_90/10, a-C:H-40_70/30, a-C:H-40_90/10, a-C:H-500 V and a-C:H-600 V, with previous deposition of amorphous silicon interface, was adequate to form a uniform and good adhesion film on the substrate. The produced film decreased the surface roughness of the studied material. The total gas flow and treatment voltage were found to have a major influence on a-C:H film production.
The treatment carried out at 20 sccm (a-C:H-20_70/30 e a-C:H-20_90/10) produced a thicker film, influenced by the high deposition rate, due to the great number of active species in the plasma [40, 41], causing the delamination of the formed film [4]. The Increase in the total gas flow to 30 sccm causes a decrease in the deposition rate compared to the film formed at low pressure, producing a film with good adhesion on the substrate. The increase in the gas flow to 40 sccm (a-C:H-40_90/10) decreases the average free path provided by the high number of species present in the plasma, decreasing the electron energy that is responsible for active species formation in the plasma, decreasing the deposition rate [28, 41], presented in table 3.
Table 3. Thickness, roughness and deposition rate of the a-C:H films.
| Thickness (nm) | Roughness (Ra) (nm) | Deposition rate (nm h−1) | |
|---|---|---|---|
| Substrate | — | 65.60 ± 41.6 | — |
| a-C:H-20_70/30 | 1931.23 ± 296.87 | 13.44 ± 3.21 | 965.61 |
| a-C:H-20_90/10 | 1260.63 ± 361.79 | 15.34 ± 1.82 | 630.31 |
| a-C:H-30_70/30 | 2522.60 ± 260.28 | 135.30 ± 84.61 | 1261.30 |
| a-C:H-30_90/10 | 969.71 ± 74.50 | 29.77 ± 12.58 | 484.8 |
| a-C:H-40_70/30 | 1159.04 ± 73.39 | 14.80 ± 4.40 | 579.52 |
| a-C:H-40_90/10 | 609.57 ± 112.79 | 7.84 ± 2.91 | 304.8 |
| a-C:H(N)-30_80/20 | 230.2 ± 55.4 | 27.5 ± 6.2 | 115.1 |
| a-C:H(N)-40_80/20 | 374.4 ± 22.3 | 76.8 ± 51.3 | 187.2 |
Once the methane presents a high ionization potential, decreasing the deposition rate of the film [4], this gas must be higher in percentage than argon to form a good thicker film within the treatment time studied in this work. This behavior is discussed by J. Robertson [4], who comments that the deposition rate decreases exponentially with the increase in the ionization potential of this precursor. It is observed that the lowest percentage of methane (70%CH4–30%Ar) studied in this work formed a thinner film than a higher percentage of methane (90%CH4–10%Ar), showing in table 3.
Analyzing the voltage effect in the production of the film, it is possible to observe that, as presented in figure 1, the increase in the voltage increases the deposition rate of the film. A voltage higher than 600 V forms a thicker film, since higher voltage favors high energy and high rate deposition, causing consequently its lateral delamination [42, 43]. Also, the temperature imposed at high voltage impairs the film adhesion to the substrate. However, a very thin film is formed at a voltage lower than 500 V due to a decrease in the deposition rate, evidenced by a greener color formed film. The films formed at 500 V and 600 V were the most uniform, due to the intermediate deposition rate.
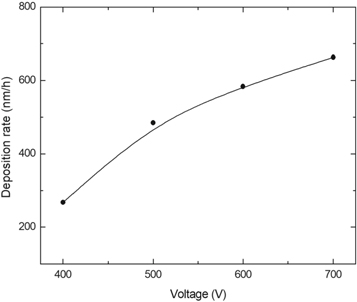
Figure 1. Influence of the Voltage in the deposition rate, showing an increase in the deposition rate with the increase in the voltage.
Download figure:
Standard image High-resolution imageThe FTIR spectrum for film a-C:H-30_90/10 shown in figure 2(a) indicates the formation of the hydrogenated amorphous carbon film. As reported in the literature [18], amorphous carbon film presents bands in the region of 3100 to 2700 cm−1. In this work, the FTIR spectra show CH3 bonds with bend mode in 1450 cm−1, C=C bonds in the region of 1680 to 1600 cm−1, C≡C bonds in 2250 to 2100 cm−1, and carbon bonds in 900 to 690 cm−1 denote the aromatic presence with out of plane bend [44].

Figure 2. Molecular structure of the films obtained by FTIR analyses at (a) a-C:H-30_90/10, (b) a-C:H-40_90/10, (c) a-C:H(N)-30_80/20 and (d) a-C:H(N)-40_80/20. The lines in the FTIR spectra are only a guide to the eyes.
Download figure:
Standard image High-resolution imageIt is also possible to observe in two spectrums a band in the region of 1300 to 1000 cm−1, denoting C–O bond. According to D'Agostino et al [42], the presence of these bonds can be explained the presence of atoms with pendant bonds on the surface of the films which, when in contact with a rich oxygen atmosphere, can bind to the film. The presence of CO2 in the 2500 cm−1 region arises due to the interference of the FTIR environment in the moment of analyses.
It is possible to note that the FTIR spectrum of the a-C:H-40_90/10 film, presented in figure 2(b), is similar to a-C:H-30_90/10 film spectrum, but it shows a favor of the formation of C–H with sp2 hybridization in the region of 3100 a 3000 cm−1 and a more intense bond of C=O next to the 1700 cm−1 pick to this treatment condition, obtaining a film with a high proportion of sp2 bond and oxygenated film in the relation of the a-C:H-30_90/10 treatment.
Analyzing the Raman spectrum for all a-C:H films, it is possible to observe the total gas flow and gas proportion that do not have a significant influence in the D and G bands. However, the increase in the voltage influences the displacement of the G band to smaller numbers of Raman shift. The voltage of 600 V (a-C:H-600V) causes the highest displacement from 1560 to 1492 cm−1, as shown in figure 3(a), indicating the formation of cyclic structures in carbon atoms with sp2 hybridization [44].

Figure 3. Raman spectra of the (a) a-C:H films, analyzing the effect of the treatment parameters in structure formation of the produced films (b) comparison of the films a-C:H-30_90/10, a-C:H (N)-40_80/20 and a-C:H (N)-30_80/20.
Download figure:
Standard image High-resolution imageIn table 4 it is possible to note the D-band (1380 cm−1), the G-band (1560 cm−-1), the band intensity and the ID/IG ratio for the deposited films. The a-C:H-30_90/10 film with ID/IG ratio of 0.58 approximately and hydrogen percentage of 27.21% is characteristic of a-C:H hard, considering the classification proposed by Robertson [4]. The a-C:H hard formation is proved by XPS results, showing a film with 94.81% of carbon, 5.19% of oxygen, 52.6% of C–C (sp2) bond and 39.1% of C–C (sp3) bond. These results are according to Robertson [4]. Also, the high amount of oxygen and the decrease of sp3 bond due to the increase in the sp2 bond present in a-C:H-40_90/10 film in relation to the a-C:H-30_90/10 film, illustrated in the analyzes of FTIR spectrum, is confirmed in XPS results. This can explain the decrease in the hardness of the produced films, whose value was 14.6 ± 3.2 GPa to a-C:H-30_90/10 film and 11.4 ± 1.0 GPa to a-C:H-40_90/10 film.
Table 4. Results obtained by Raman Spectrum and XPS analysis.
| Samples | C–C sp3 (%) | C–N sp3 (%) | C (%) | O (%) | N (%) | Peak position (D) (cm−1) | Peak position (G) (cm−1) | I(D) | I(G) | ID/IG |
|---|---|---|---|---|---|---|---|---|---|---|
| a-C:H-30_90/10 | 39.1 | 0.0 | 94.6 | 5.4 | 0.0 | 1396.13 | 1543.68 | 1092.64 | 1866.70 | 0.58 |
| a-C:H-40_0%N2 | 30.9 | 0.0 | 74.7 | 25.3 | 0.0 | 1402.95 | 1540.39 | 943.95 | 1562.55 | 0.60 |
| a-C:H-40_10%N2 | 25.4 | 7.9 | 89.2 | 8.7 | 2.1 | 1397.40 | 1543.89 | 1592.81 | 2516.84 | 0.63 |
| a-C:H-40_20%N2 | 25.4 | 12.4 | 89.2 | 7.5 | 3.2 | 1411.19 | 1544.82 | 1339.13 | 2102.33 | 0.64 |
| a-C:H-40_30%N2 | 31.5 | 8.8 | 91.1 | 4.8 | 4.1 | 1395.03 | 1546.21 | 1024.59 | 1600.20 | 0.64 |
| a-C:H-40_40%N2 | 21.3 | 11.2 | 88.6 | 6.2 | 5.2 | 1391.57 | 1547.43 | 1354.00 | 2045.34 | 0.66 |
| a-C:H-40_50%N2 | 23.9 | 25.0 | 86.8 | 6.6 | 6.7 | 1407.94 | 1549.95 | 1079.26 | 1408.31 | 0.77 |
| a-C:H-40_60%N2 | 19.8 | 11.9 | 86.5 | 4.9 | 8.6 | 1401.40 | 1551.39 | 916.27 | 1231.79 | 0.74 |
The parameters used in the formation of the films a-C:H-30_90/10 and a-C:H-40_90/10 were considered for the study of the formation of films a-C:H(N).
In figure 4(a) it is possible to observe the visual aspect of the film a-C:H-30_90/10, of black color, characteristic of DLC films. In figure 4(b) it is presented the visual analysis of the film a-C:H(N) formed with the total gas flow of 30 sccm. As observed, the produced film in the Ti6Al4V substrate shows a pink color, characteristic of interface film coloring, evidencing a formation of a very thin film. In figure 4(c), the nitrogenated film was produced with a greater total gas flow, with 40 sccm, thus obtaining a black colored film characteristic of a-C:H film. Thus, the increase in the gas flow to 40 sccm produced a thicker nitrogenated film with full coverage of a-C:Si:H:O interlayer.
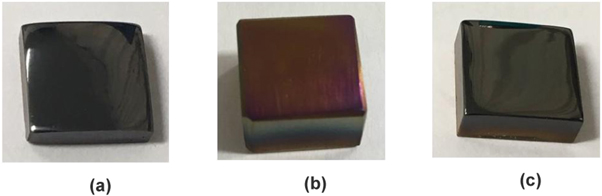
Figure 4. Visual aspects of the formed films to treatments (a) a-C:H-30_90/10, (b) C:H(N)-30_80/20 and (c) a-C:H(N)-40_80/20.
Download figure:
Standard image High-resolution imageThese results are verified in table 3, in which the a-C:H(N) films have a lower thickness than the a-C:H films, proving that the nitrogen incorporation reduces the deposition rate of the film [5].
Figure 2(b) presents the FTIR spectra of the a-C:H(N)-30_80/20 film. It is possible to verify the absence of the band in 3100 to 2700 cm−1 region and the presence of bands related to interface a-C:Si:H:O. As observed in figure 2(c), the FTIR spectrum of the a-C:H(N)-40_80/20 film presents the peak in 3000 to 2800 cm−1 region due to CH2 bond with stretch mode, peak related to CH3 group (1450 cm−1) and presence of bands in the region of 1600 to 1680 cm−1 related to C=C bonds. The nitrogen incorporation is visible in the region of 1000 to 1350 cm−1, indicating the C–N bonds, could be amines, and bands in 3100 to 3500 cm−1, indicating that N–H bonds in stretch mode could be amines or amides [66]. Then, the gas flow at 30 sccm used to form an a-C:H(N) structure produced a very thin film, which is insufficient to be detected by this technique. Thus, it was necessary to increase the gas flow to 40 sccm (a-C:H(N)-40_80/20) to produce a nitrogenated film with adequate thickness.
In Raman spectra of a-C:H(N)-30_80/20 (figure 3(b)) we observe the discrete bands D and G in 1360 and 1580 cm−1 respectively, however with high inclination due to luminescence from hydrogen related to interface a-C:Si:H:O. It is assumed that the total gas flow of the treatment was not sufficient for the formation of the amorphous carbon film and it is not possible to obtain a deconvolution for this spectrum, due to low intensity bands of the film [37].
The Raman spectrum of the a-C:H(N)-40_80/20 film (figure 3(b)), showed the characteristic bands D and G of the amorphous carbon film, however, the characteristic bands of nitrogen incorporation were not visible. This fact is due to the low incorporation of nitrogen used in the present work. However, there is an increase in intensity and small displacement of the D band in relation to the spectrum obtained from the film without nitrogen incorporation, as shown in table 4.
Nitrogen decreases the deposition rate of the film, result observed by [45, 46]. It was then necessary to increase the gas flow for the formation of the a-C:H(N) film in relation to the flow used for a-C:H film. The flow rate of 30 sccm was not sufficient for the formation of the a-C:H(N)-30_80/20 film, or it was formed at a such a low thickness that information could not be obtained from the film by analyzes performed in this work, since all results obtained for the analysis of this film were related to the hydrogenated amorphous silicon interface. However, for films without nitrogen incorporation, the change in the total gas flow showed opposite results. The increase of the flow from 30 to 40 sccm decreases the deposition rate, explained by the decrease of the average free path of the gas species with increasing gas flow. But the increase in the rate deposition for the nitrogen film to 40 sccm can be explained due to the low average free path of the species, making it difficult for nitrogen to influence the film thickness, thus forming a film thicker than the film formed with 30 sccm.
3.2. Study of nitrogen influence on a-C: H film formation
The visual analysis of the a-C:H(N) films formed in this work showed the black-colored films, such as a-C:H films, which became clearer with the increase in the percentage of nitrogen present in the treatment. The films resulted in good adhesion and uniform with the previous deposition of a hydrogenated amorphous silicon interface, as shown in table 2.
It is possible to note in figure 5 the regular growth of the film at the function of nitrogen concentration introduced in the treatment environment. Nitrogen gas added to the treatment environment decreased the film thickness produced in up to a 20% N2. For proportions of 30% and 40% N2, the film thickness increases significantly, but with a high standard deviation denoting an irregular surface. For films formed with 50% and 60% N2, a significant reduction in film thickness occurred. This behavior is described in previous research [5].
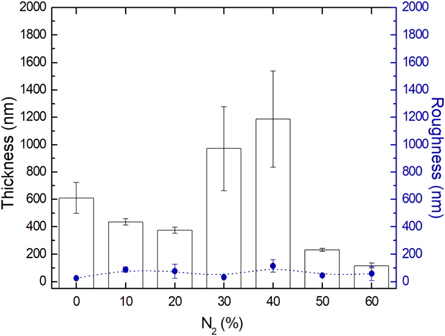
Figure 5. Average thickness and roughness of a-C:H and a-C: H (N) films with a concentration of 10 to 60% diluted nitrogen during treatment.
Download figure:
Standard image High-resolution imageAccording the analyses of the results obtained by FTIR introduced in table 5, it is possible to verify the presence of bands related to nitrogen bonds, confirming the incorporation of this element in all formed films, influencing in Raman spectra of the produced films, as shown in figure 6.
Table 5. Bonds present in a-C: H (N) films as a function of the variation of nitrogen dilution in the treatment.
| O–H | N–H | C–H2 | =C–H/N–H | C–N/C–O | |
|---|---|---|---|---|---|
| a-C:H-40_10%N2 | — | 3400 cm−1 | 2900 cm−1 | — | 1250 cm−1 |
| a-C:H-40_20%N2 | 3600 cm−1 | — | 2900 cm−1 | 1600 cm−1 | — |
| a-C:H-40_30%N2 | 3600 cm−1 | — | 2900 cm−1 | — | 1250 cm−1 |
| a-C:H-40_40%N2 | 3600 cm−1 | — | 2900 cm−1 | — | 1250 cm−1 |
| a-C:H-40_50%N2 | — | — | 2900 cm−1 | 1600 cm−1 | — |
| a-C:H-40_60%N2 | — | 3400 cm−1 | 2900 cm−1 | 1600 cm−1 | 1250 cm−1 |
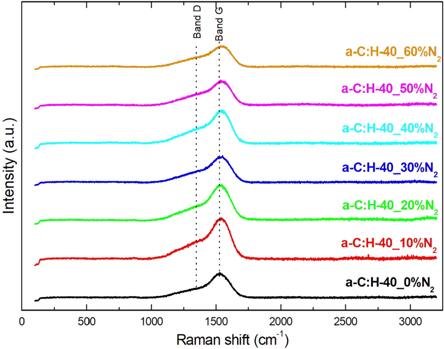
Figure 6. Raman spectrum for a-C:H film with and without nitrogen incorporation at different concentrations.
Download figure:
Standard image High-resolution imageAs reported by Ferrari et al [47], it is expected the Raman spectra to the a-C:H and a-C:H(N) films present a similar behavior due to the little difference in the region of the D and G bands caused by carbon or nitrogen atoms. In this work, the similarity of the spectra was observed in the nitrogenated formed films, but an alteration was observed in the intensity and position of the band, indicating a subtle modification in the film structure due to nitrogen incorporated in the film. It is observed that the increase of nitrogen concentration promoted the change of the position of the band G for larger wavelengths. This indicates a lower G band amorphization, or more sp2 clusters than the film formed without nitrogen (a-C:H-40_0%N2), which has the asymmetric center of its band at 1540 cm−1. These results can be seen in table 4.
The XPS curves confirm the nitrogen incorporation in the film, whose N1s peak is absent in the a-C:H-40_0%N2 film and it is observed in all nitrogenated films with the increase of the intensity due to increase in the nitrogen introduction in the treatment, reaching the maximum intensity in the a-C:H-40_60%N2 samples, representatively showed in figure 7(a). We can verrify the linear increase of the incorporation of nitrogen, in atomic percentage, in the formed film in the range of 10%–60% N2, as shown in table 4.
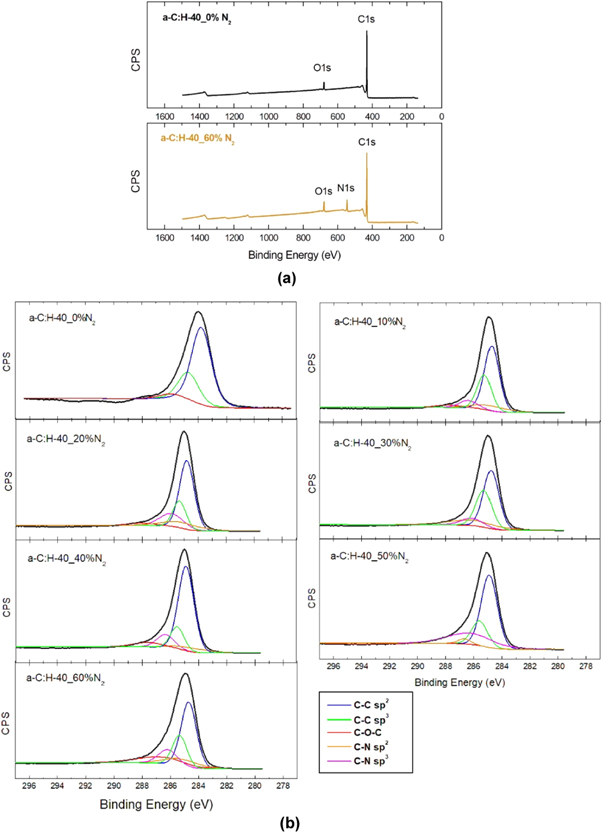
Figure 7. Curves obtained by XPS analysis (a) survey scan spectrum of the a-C:H-40_0%N2 and a-C:H-40_60%N2 films (b) spectra of C1s peak of the nitrogenated films.
Download figure:
Standard image High-resolution imageThe C1s high-resolution spectra were deconvoluted into five components corresponding to the different bonding states of carbon atoms. These spectra consist of C–C (sp2) at a binding energy 284.2 eV, C−C (sp3) at 285.2 eV, C–N (sp2) at 286.4 eV, C–N (sp3) at 287.3 eV and C–O at 289 eV [48–50], as shown in figure 7(b). It can also be seen that the incorporation of nitrogen in the film, regardless of proportion, caused a decrease in sp3 bond and an increase in the amount of sp2 bond between carbon compared to film a-C:H [51], with exception of the a-C:H-40_30%N2 film.
The wear volume of Ti6Al4V substrate, a-C:H and a-C:H(N) films can be seen in figure 8. The results show that the substrate presented lower wear resistance when compared to all treated materials, evidencing the effectiveness of the treatment performed. The a-C:H-40_40%N2 film presented higher wear volume compared to the films deposited, and lower compared to the a-C:H-40_60%N2 film, whose results are explained below.

Figure 8. Wear volume, C-C and C-N sp3percentage of the substrate, a-C:H and a-C:H(N) films obtained in the abrasive micro wear tests.
Download figure:
Standard image High-resolution imageIn figure 9 we observe the loading and unloading curves by displacement obtained in the nanohardness test for the films a-C: H and a-C: H (N). The curved shape of the unloading shows a preview of the behavior of the film, in which high curvatures of the unload indicate greater plastic deformation of the film [52]. The load and unloading curves obtained in the indentation test show that the introduction of the nitrogen causes an increase in the curvature of the unloading curve, predicting a plastic behavior of the film [53]. The elastic recovery rate (R) was determined for the films, in accordance to F. Wen et al [53], showing similar behavior of the different films formed in this work, whose value were close to 78%, indicating predominantly elastic behavior.
Figure 9. Load versus displacement curve obtained in the nanohardness test.
Download figure:
Standard image High-resolution imageThe hardness and Young Modulus to a-C:H and a-C:H(N) films are observed in figure 10. The produced films show higher hardness than the substrate. The N2 added in the treatment from 10 to 40% slightly reduced the hardness of the film compared to film without nitrogen. This can be explained by the nitrogen changes and decrease in the bonding angle between carbons [54, 55], increase the carbon sp2 bond and produce N=C bond favoring the relaxation of the structure, once this has low bond length than C–C e C=C sp3 bonds, decreasing the film hardness [56]. However, the increase in the N2 to 50% and 60% causes a slight increase in the hardness of the films, corroborating what was observed in the loading and unloading curves. The Young Modulus was most influenced by nitrogen introduction in the film, overcoming the value of the base metal on of the film a-C:H-40_60%N2.
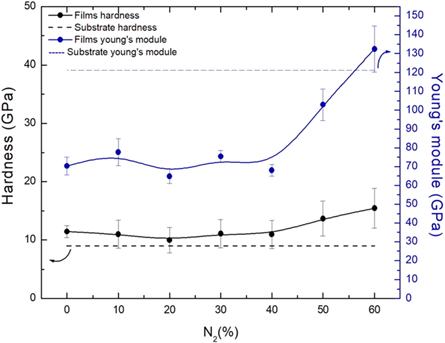
Figure 10. Hardness and Young Modulus at a function of the percentage of nitrogen addition in the deposition treatment.
Download figure:
Standard image High-resolution imageThe tribological properties are directly related to structural changes in the films. The treatments that had better wear resistance, showing low wear volume, presented the higher proportion of C–C and C–N sp3 bands (a-C:H-40_0%N2, a-C:H-40_30%N2 and a-C:H-40_50%N2), as observed in figure 8. The film without nitrogen (a-C:H-40_0%N2) obtained a lower wear volume and a better wear resistance than all studied materials, related to a higher percentage of C–C sp3 bond. The film formed with 30% of N2 presented a high proportion of C–C sp3 bond, similar to a-C:H-40_0%N2, justifying its wear resistance. However, the film formed with 50% of N2 presented a decrease in the proportion of C–C sp3 bond but the higher proportion of C–N sp3 bond, showing this formation has an influence in the hardness and wear resistance of the film. The nitrogenous film with a low percentage of C–C and C–N sp3 bonds (a-C:H-40_10%N2, a-C:H-40_20%N2 and a-C:H-40_40%N2) presented lower wear resistance than other films.
The films a-C:H-40_10%N2 and a-C:H-40_20%N2 showed hardness slightly lower than the other films. Despite this small difference, this reduction in hardness had a significant influence on the wear behavior of these materials, reducing the wear resistance of films with 10 and 20% nitrogen.
To the film a-C:H-40_40%N2, not only the film structure is influencing its tribological behavior. The higher thickness film favors the internal stress decreasing the film cohesion, and its irregular formation, as film accumulation, it is important for explaining the wear behavior of this film. The irregular accumulation points of the film a-C:H-40_40%N2 on the treated surface is observed in figure 11, as verified by the scanning electron microscopy technique, which was not verified for films produced with lower nitrogen percentage. Thus, the detachment of these particles acted as an abrasive material, increasing the test severity and the wear volume.
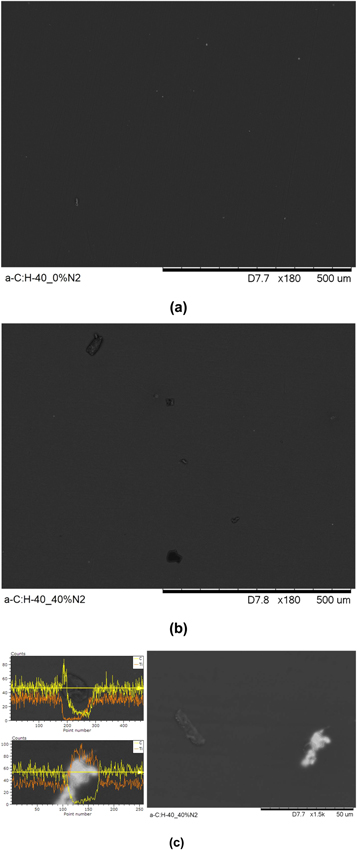
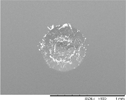
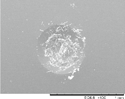
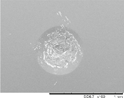
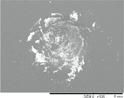
Figure 11. Film morphology obtained by MEV illustrating (a) the regular film formed at a-C:H-40_0%N2, (b) the accumulated film particles formed in a-C:H-40_40%N2 and (c) a chemical analysis by EDS of a-C:H-40_40%N2 film, showing that the black point is the film particle, rich in carbon element, and white point is defect formation characteristic of DLC film, evidencing the absence of carbon and high percentage of the titanium from the base metal.
Download figure:
Standard image High-resolution imageThe C:H-40_60%N2 film presented the worst wear resistance and the thinnest film compared to all treated materials. Despite being discussed by Khun [57], who comments that the thinner films have tendency to get low wear resistance, the high Young Modulus obtained by this film evidences its rigidity, producing cracks in the film during the wear process [58, 59], it can easily cause the film removal of the surface, increasing the severity of wear.
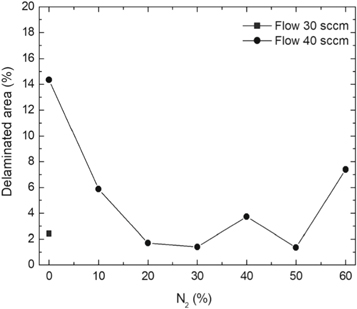
The indentation area of the a-C:H and a-C:H(N) films is observed in table 6. Delamination and cracking of the films are observed around the indentation area, particularly on the sample in which severe delamination indicates poor adhesion of the film. The delamination of the films is obtained when a critical value of the elastic energy of the film is reached, and this value is related to the thickness of the film. This behavior occurs due to the compressive stress present in the film, which is created by the expansive of the substrate surface during the deposition, caused by the ion bombardment. The shear forces between the film interface and substrate cause the delamination of the film when the elastic energy exceeds the surface fracture energy [60, 61]. It is possible to observe that the delamination and cracked area decrease gradually with the increase in the nitrogen concentration in the film. This is observed in a percentage higher than 10% of the nitrogen, in which the films showed improvement in the adhesion behavior. But the adhesion decreases with a nitrogen percentage higher than 50%. The analysis of the adhesion is demonstrated in figure 12, where the delaminated area is quantified.
Table 6. Analysis of the a-C:H and a-C:H(N) films adhesion deposited on the substrate, obtained by the Rocwell C hardness test.
| Samples | Indentation (100×) | Classification |
|---|---|---|
| a-C:H-30_90/10 |
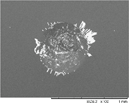
|
HF3 |
| a-C:H-40_0%N2 |
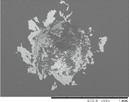
|
HF4 |
| a-C:H-40_10%N2 |
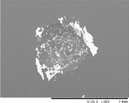
|
HF4 |
| a-C:H-40_20%N2 |
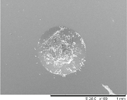
|
HF1 |
| a-C:H-40_30%N2 |
|
HF2 |
| a-C:H-40_40%N2 |
|
HF2 |
| a-C:H-40_50%N2 |
|
HF1 |
| a-C:H-40_60%N2 |
|
HF4 |
Figure 12. Percentage of the delaminated area of the film after indentation as a function of the percentage of nitrogen in the deposition of the film.
Download figure:
Standard image High-resolution image
The quantification of the delaminated area confirms the results, showing that the incorporation of nitrogen influenced directly in the adhesion of DLC films. As previously discussed in other works, the incorporation of nitrogen reduces the internal stress in the DLC films [62–65]. The nitrogen increases the Young Modulus of DLC films, indicating that the nitrogen while incorporating into the film allows the increase in the elastic energy without exceeding the surface fracture energy, leading to a smaller percentage of the delaminated area. These results were corroborated with the results found in the analyses of mechanical properties and wear resistance.
4. Conclusions
The general objective of this research was to produce a-C:H and a-C:H (N) film on Ti6Al4V substrate and to study its effects on thickness, wear resistance, hardness and adhesion properties of the studied material.
The use of a DC-pulsed power supply combined with the PECVD technique provided uniform films throughout the sample surface. When using CH4 as a precursor gas to produce a-C:H film, the amount of this gas must be higher than the argon gas used in the mixture.
For the formation of a hard a-C:H film, a high voltage, but less than 600 V, with a treatment temperature of around 115 °C should be used. Voltage below 500 V produces a very thin film while very high voltages cause delamination of the film.
The nitrogen incorporation influenced in the deposition rate of the films, being necessary to increase the total gas flow to produce the a-C: H(N) film. The thickness of the a-C:H(N) film remained constant with the introduction of N2 as a precursor of up to 20%, showing a decrease to 30 and 40% of N2, increasing with the consequent increase in gas percentage, evidencing its significant effect on the deposition rate of the studied film.
Through the FTIR technique, it was possible to verify nitrogen related bonds in the a-C:H(N) films in different N2 compositions. The Raman Spectroscopy technique showed no nitrogen bands as described in the literature. However, it was possible to verify the subtle influence of nitrogen on the displacement and intensity of the D and G bands. XPS analyses confirmed the incorporation of nitrogen in the a-C:H(N) films and the decrease in the amount of sp3 bond due to the incorporation of this element in the film. There was a linear relationship of nitrogen incorporation in the film produced by increasing the percentage of precursor gas in the treatment.
The incorporation of nitrogen influenced the tribology of the films produced, in which the films presented higher wear resistance compared to the substrate. However, in higher percentages, the films presented resistance similar to the Ti6Al4V substrate.
The behavior observed in the tribology result is also observed in the adhesion of the film on the substrate. The introduction of the intermediated amount of nitrogen reduces the sp3 bonds keeping the mechanical characteristics of the DLC film, improving the film adhesion in the metallic substrate. A high percentage of nitrogen introduced in the DLC film increases the percentage of sp3 bonds, increasing the film hardness, impairing the adhesion and the wear resistance of the material. This shows that tribology is directly related to the adhesion property of DLC films, corroborating the results.
The incorporation of nitrogen in the film causes a slight decrease in its hardness, with a subsequent increase from 40% of N2 as precursor gas, which had no direct relation with the wear results. The C–C and C–N sp3 bond, thickness, irregularities in the film and rigidity influence the wear properties of the carbon-based films.
The predominant properties that have greater influence in the structural formation of the film due to added nitrogen, directly related to the wear behavior of the material, is specific and intrinsic for each formed film. Thus, it can be concluded that nitrogen incorporation has a great effect on a-C:H film characteristics, and it is possible to use this element for the manipulation of properties for each application to amorphous carbon films.
Acknowledgments
The authors are very grateful to LNNano/CNPEM for XPS support, to Carbon Sci–Tech Labs/UNICAMP for Raman support, to LaPTec/UNESP for profilometer test, FTIR and nanohardness test support, to CAPES (code 001)and also to the financial support from the São Paulo Research Foundation FAPESP by process (2017/12288-0).