
Abstract
The corrosion behavior of E690 steel in 3.5 wt.% NaCl solution at temperatures from 20 °C to 60 °C was investigated using electrochemical test. The corrosion morphology was characterized using SEM and AFM, and the corrosion layer was characterized using EDS, Raman spectroscopy and XPS. The results showed that the corrosion rate of E690 steel improves with the increase in temperature. The corrosion layers of E690 steel are mainly composed of α-Fe2O3, α-FeOOH and γ-FeOOH. With the elevated temperature, the content of α-FeOOH in corrosion layers increases, while the content of α-Fe2O3 and γ-FeOOH decreases. The corrosion mechanisms were briefly discussed.
Export citation and abstract BibTeX RIS

Original content from this work may be used under the terms of the Creative Commons Attribution 4.0 licence. Any further distribution of this work must maintain attribution to the author(s) and the title of the work, journal citation and DOI.
1. Introduction
High-strength low-alloy (HSLA) steels have potential application to serve as a structural material in the marine environment [1, 2]. Due to the superior mechanical properties and corrosion resistance, E690 steel has been widely used for the fabrication of offshore oil platforms, marine engineering and ships [3–6]. However, the performance of part of ocean engineering equipments gradually deteriorates during active time due to severe corrosion damage [7]. Besides excellent mechanical properties, the E690 steel also exhibits a good corrosion resistance in marine environment [8]. The corrosion behavior of materials in seawater were affected by several factors, such as pH, dissolved oxygen, temperature, and so on. [9, 10]. It is no doubt that temperature has the decisive effect. The published literatures showed that temperature has significant influence on the corrosion behaviors of metallic materials [11–18]. With the increase in temperature, the concentration of oxygen and the thermal motion of molecules change greatly, which was the key factor in corrosion behavior [19]. Liu et al [20] studied the effect of temperature on the corrosion and cathodic protection behaviors of X65 steel in 3.5 wt.% NaCl solution, and found that the corrosion rate of X65 increase with the increase of temperature. That was attributed to that the high temperature promoted the activation of the steel, corrosive ions infiltrated into the steel matrix more easily and promoted the dissolution of the metal matrix. Yuan et al [21] studied the effects of temperature on the corrosion behaviors of X80 steel in 3.5 wt.% NaCl solutions, and found that raising the temperature would promote the corrosion activity and corrosion reaction kinetics, which is mainly realized by the anodic reaction, rather than cathodic reaction. In addition, the published literatures [22–25] showed that the corrosion product layer has a significant effect on the corrosion behavior of steel. Bousselmi et al [26] found the rust film of carbon steel has a structure of doubles layers, an inner compact one and an outer layer part. The corrosion rate was controlled by the oxygen diffusion. The composition and structure of corrosion products [11, 27–29] and the nature and morphology of the corrosion product layer [30] formed on steel at different temperatures are different from each other. Zhou et al [27] studied the structure and composition of corrosion product film of Q235 carbon steel in CO2 saturated solution at different temperatures and found that the corrosion rate of the studied steel was determined by the structure and the composition of corrosion product film, which were affected significantly by the solution temperature.
However, the influence of temperature on corrosion of E690 steel used in Marine engineering was seldom studied. In this paper, the influence of temperature on the corrosion behavior of E690 steel was investigated by the electrochemical measurements. The corrosion morphology, structure and composition of the rust layer of all samples were thoroughly analyzed. Based on the results obtained, the corrosion mechanism of E690 steel in 3.5 wt.% NaCl solution was discussed in detail.
2. Experimental
The material used in this work is E690 steel and the chemical composition of E690 steel is shown in table 1. The tensile strength and elongation rate of E690 steel were 799 MPa and 19%, respectively. Samples used for electrochemical test were cut into coupons with dimension of 10 mm × 5 mm × 2.5 mm and then encapsulated with a mixture of epoxy and polyamide resins and with the exposed area of 0.5 cm2. And then the specimen was gradually ground with SiC papers up to 1000 grit, then rinsed with alcohol, and finally dried with cold air. Samples used for microstructure observation was polished with a 1.5 μm alumina powder and etched with 5 vol% natal solution (5 vol% nitric acid + 95 vol% anhydrous ethanol) for 10 s.
Table 1. Chemical compositions of E690 steel (wt.%).
| C | Si | Mn | P | S | Cr | Ni | Cu | Mo | V | Al | Fe |
|---|---|---|---|---|---|---|---|---|---|---|---|
| 0.15 | 0.2 | 1.0 | 0.0058 | 0.0014 | 0.99 | 1.45 | 0.0091 | 0.37 | 0.03 | 0.036 | Bal. |
The electrochemical measurements were performed using a Reference 600 + electrochemical workstation (Gamry Instruments, Inc. USA). All electrochemical data were obtained by using a conventional three-electrode electrochemical cell, which was composed of the E690 steel electrode as the working electrode, a saturated calomel electrode (SCE) as the reference electrode and a platinum plate as the counter electrode [31, 32]. The test electrolytes was 3.5 wt.% NaCl solution. The potentiodynamic polarization test was performed at a scan rate of 0.5 mV s−1 from –500 mVSCE below the open circuit potential (OCP) to positive direction and terminated when the current density reached to 20 mA·cm–2. Electrochemical impedance spectra (EIS) were carried out with the sinusoidal voltage of 20 mV amplitude as the disturbance signal and a frequency range from 10–2 Hz to 104 Hz. All the electrochemical measurements were repeated at least three times to ensure the reproducibility. The temperature of the tested solution was 20 °C, 35 °C, 45 °C and 60 °C.
The corrosion morphologies of E690 steel after potentiodynamic polarization test were observed using scanning electron microscopy (SEM, ZEISS Merlin Compact) and atomic force microscope (AFM, ICSPI. Corp, Canada). Compositions and distributions of elements in the corrosion product layer were analyzed by energy-dispersive spectrometry (EDS) and Raman spectroscopy (Renishaw Micro-Raman, UK). Raman excitation was performed with a wave length of 532 nm, a laser power of 0.5 mW and a laser spot with the diameter of 2–3 μm. The spectrum acquisition time was 30 s and the scanning range was 100–1000 cm−1. The corrosion layer formed on the surface of E690 steel under various temperatures was analyzed using X-ray photoelectron spectroscopy (XPS) with ESCALAB 250Xi with a monochromatic Al Kα radiation source. The binding energies are defined in reference to the binding energy of the C 1 s peak at 284.8 eV.
3. Results and discussion
3.1. Microstructure characterization
Figure 1(a) shows the optical microstructure (OM) for E690 steel. The outline of the prior austenite grains (PAGs) is clearly discernible in figure 1(a). Each PAG includes several blocks that are composed of the lath and acicular bainite. The XRD pattern of E690 steel is shown in figure 1(b). The peaks in figure 1(b) corresponding to the characteristic peaks of γ phase (PAGs). It has been reported that the crystallographic orientation relationships can be maintained when austenite transforms into bainite [33, 34].
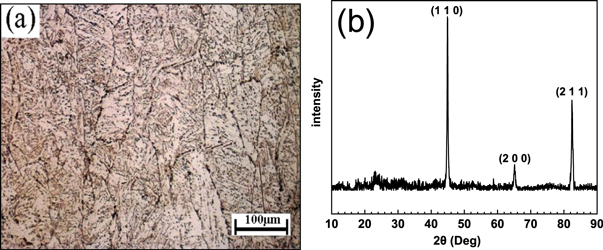
Figure 1. (a) OM and (b) XRD pattern for E690 steel.
Download figure:
Standard image High-resolution image3.2. Electrochemical response
3.2.1. OCP
The OCP curves for E690 steel in 3.5 wt.% NaCl solution at various temperatures are present in figure 2. The response of OCPs in immersion tests reflects the characteristics of the naturally formed oxides [35]. The corrosion potential (Ecorr) of the E690 steel gradually shifts to negative direction with prolonging of immersion time under each temperature condition, this is due to the instability of the corrosion layer [36]. Ecorr decreases substantially with the increase in immersion time, from –0.58 VSCE to –0.62 VSCE at the temperature of 20 °C. When the temperature increases to 35 °C, Ecorr finally reached the steady-state potential of –0.67 VSCE. The corrosion potential showed the same phenomenon when the temperature was 45 °C, and the stable potential reached –0.71 VSCE. When the temperature rises to 60 °C, Ecorr stabilizes at –0.72 VSCE when the immersion time attains 1800 s and then maintains stable. This phenomenon indicates that the corrosion of E690 steel in 3.5 wt.% NaCl solution is controlled by activation reaction [37]. The degeneration of corrosion potential is faster at elevated temperature, which can be attributed to the higher corrosion rate. With the increase in temperature, the OCP of E690 steel shifted negatively indicates the initiation of corrosion processes [38], and the gradual degradation of corrosion resistance. The corrosion rate is determined by the diffusion of oxygen to the corroding surface and the definitive factor is the concentration of dissolved oxygen in the electrolyte. The potential drop at low temperature is less pronounced, which can be attributed to relatively slow corrosion processes at low temperatures.

Figure 2. Evolution of OCP with time for E690 steel in 3.5 wt.% NaCl solution at various temperatures.
Download figure:
Standard image High-resolution image3.2.2. EIS characteristics
Figure 3 shows the Nyquist (a) and Bode (b) plots of E690 steel in 3.5 wt.% NaCl solution at various temperatures. At 20 °C and 35 °C, the Nyquist plots (figure 3(a)) exhibit a single capacitive semicircle from high to intermediate frequencies and a low frequency arc, suggesting the inductive behavior [39]. At temperatures of 20 °C and 35 °C, the ions adsorbed on the surface and the capacitive loop of the adsorption process gradually shrinks to overlap with the capacitive loop representing an electrochemical reaction, and finally presents a shrinkage capacitive loop [40]. The radius of semicircle in high frequency region decreases with the increase of temperature. However, at temperatures of 45 °C and 60 °C, the Nyquist plots contain two capacitance loops. The Bode diagram (figure 3(b)) presents a maximum phase angle, the maximum phase angle decreases and moves gradually to the high frequency range with the increase in temperature.
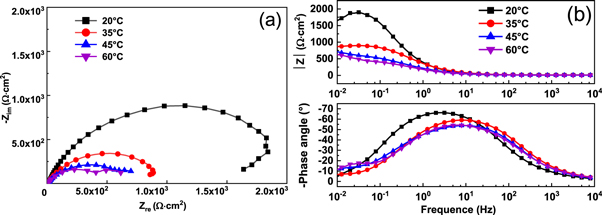
Figure 3. (a) Nyquist and (b) Bode curves for E690 steel in 3.5 wt.% NaCl solution at different temperatures.
Download figure:
Standard image High-resolution imageFigure 4 presents the electrochemical equivalent circuit used to simulate the EIS data. The EIS data obtained at temperatures of 20 °C and 35 °C can be analyzed using the equivalent electrical circuit present in figure 4(a). In which, Rs is electrolyte solution resistance. Cad and Rad are the capacitance and resistance of the adsorption process, respectively. Cd and Rr are electrochemical reaction capacitance and resistance, respectively. The feature of EIS diagrams measured at temperatures of 45 °C and 60 °C is identical, the capacitance loop at low frequencies region can be attributed to the film resistance (Rf), which may relate to the corrosion products layer [41, 42]. The EIS data obtained at 45 °C and 60 °C can be analyzed using the equivalent electrical circuit shown in figure 4(b). In which, Cf is the capacitance of corrosion layer. The equivalent circuit parameters calculated from figure 3 are listed in table 2. It can be seen that the Rr decreases from 142 to 38 Ω·cm2 as the temperature increases from 20 to 60 °C. The results showed that the deterioration in corrosion resistance of E690 steel at elevated temperature.
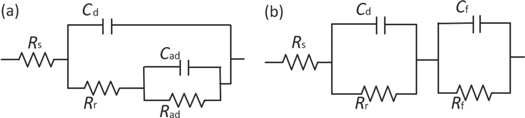
Figure 4. Electrochemical equivalent circuit used to evaluation the EIS data at (a) 25 °C and 35 °C and (b) 45 °C and 60 °C.
Download figure:
Standard image High-resolution imageTable 2. Equivalent circuit parameters for E690 steel in the 3.5 wt.% NaCl solution.
| T (°C) | Rs (Ω·cm2) | Cd (F) | Rr (Ω·cm2) | Cad (F) | Rad (Ω·cm2) | Cf (F) | Rf (Ω·cm2) |
|---|---|---|---|---|---|---|---|
| 20 | 12.7 | 1.78 × 10⁻⁴ | 142 | 2.75 × 10⁻⁴ | 1684 | — | — |
| 35 | 9.21 | 1.22 × 10⁻⁴ | 109 | 2.97 × 10⁻⁴ | 733 | — | — |
| 45 | 7.97 | 2.37 × 10⁻⁴ | 59 | — | — | 8.61 × 10⁻⁴ | 530 |
| 60 | 6.82 | 2.82 × 10⁻⁴ | 38 | — | — | 8.97 × 10⁻⁴ | 440 |
3.2.3. Potentiodynamic polarization tests
Figure 5 shows the potentiodynamic polarization curves for E690 steel at various temperatures in 3.5 wt.% NaCl solution. As is seen from figure 5, both anodic and cathodic reactions were enhanced due to the increased temperature. This suggests that the corrosion rate of E690 steel was higher with elevated temperature. The electrochemical parameters of corrosion potential (Ecorr), corrosion current density (icorr), anodic tafel slopes (ba) and cathodic tafel slopes (bc) obtained from polarization curve are listed in table 3. It can be observed from table 3, the Ecorr of E690 steel shifts to negative from −0.658 VSCE to −0.758 VSCE but icorr increases from 9.33 × 10⁻⁶ A cm−2 to 2.01 × 10⁻⁵ A cm−2 when the temperature rises from 20 to 60 °C. The icorr of E690 steel increases with the increase of temperature [43]. In addition, both ba and bc decrease with the increase of the temperature. But the influence of temperature on bc is prominent compared with that on ba, indicating that the corrosion process was controlled by the cathode reaction. In this case, the corrosion rate is determined by oxygen absorption reaction of cathodic and active dissolution of anode. With the increase in temperature, the increase of icorr decreases gradually. This means the corrosion rate of E690 steel is also determined by the properties of the corrosion layer. These findings are consistent with the results reported by Zhou et al [27], they found that the corrosion rate of the low alloy steel increased with the rise of temperature.
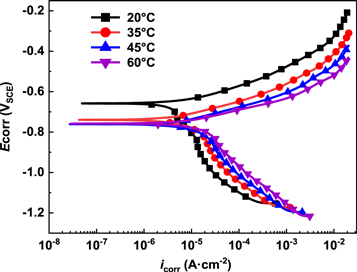
Figure 5. Potentiodynamic polarization curves for E690 steel in 3.5 wt.% NaCl at various temperatures.
Download figure:
Standard image High-resolution imageTable 3. The electrochemical parameters obtained from potentiodynamic polarization curves.
| T(°C) | icorr (A cm−2) | Ecorr (VSCE) | ba (mV dec−1) | bc (mV dec−1) |
|---|---|---|---|---|
| 20 | 9.33 ± 0.21 × 10⁻⁶ | −0.658 | 87 ± 3.0 | 432 ± 7.2 |
| 35 | 1.53 ± 0.02 × 10⁻⁵ | −0.740 | 85 ± 0.2 | 281 ± 4.9 |
| 45 | 1.86 ± 0.02 × 10⁻⁵ | −0.761 | 80 ± 1.0 | 238 ± 4.9 |
| 60 | 2.01 ± 0.02 × 10⁻⁵ | −0.758 | 65 ± 0.2 | 206 ± 1.5 |
It is general accepted that a higher temperature results in a higher corrosion rate because the electrochemical reactions are temperature-dependent for active steels. The increase of temperature increases the surface activation and promotes iron matrix dissolution, which accelerates the corrosive ions permeating into steel. The icorr can be expressed as follow [20, 44]:

Where R is the molar gas constant (8.314 J·mol−1·K−1), T is the temperature and A is a constant, Ea is the activation energy. The relationship between log(icorr) and 1/T for E690 steel in 3.5 wt.% NaCl solution is presented in figure 6. The value of Ea calculated from figure 6 was found to be 14.89 kJ·mol−1. This indicates that the corrosion process is controlled by surface reaction [44].

Figure 6. The relationship between log(icorr) and 1/T for E690 steel in 3.5 wt.% NaCl solution.
Download figure:
Standard image High-resolution image3.3. Corrosion morphology
Figure 7 shows the corrosion morphology and chemical composition of corrosion layer on E690 steel after potentiodynamic polarization tests. It can be seen that there almost no any corrosion layer can be observed at temperatures of 20 °C and 35 °C. The outline of the prior austenite grains (PAGs) and bainite can be clearly discernible. At temperature of 45 °C, the corrosion product layer is obviously formed. However, the base metal E690 steel is barely noticeable when the temperature rises to 60 °C. As can be seen from table 3, the corrosion rate increases slowly and the corrosion potential is basically unchanged. This can be attributed to two reasons. On the one hand, the contact between the base metal and the solution decreases due to the increase of the thickness and compactness of the corrosion product layer. On the other hand, the increase of temperature enhances the movement of ions, thus promoting anodic dissolution. And the latter has a greater influence on steel.
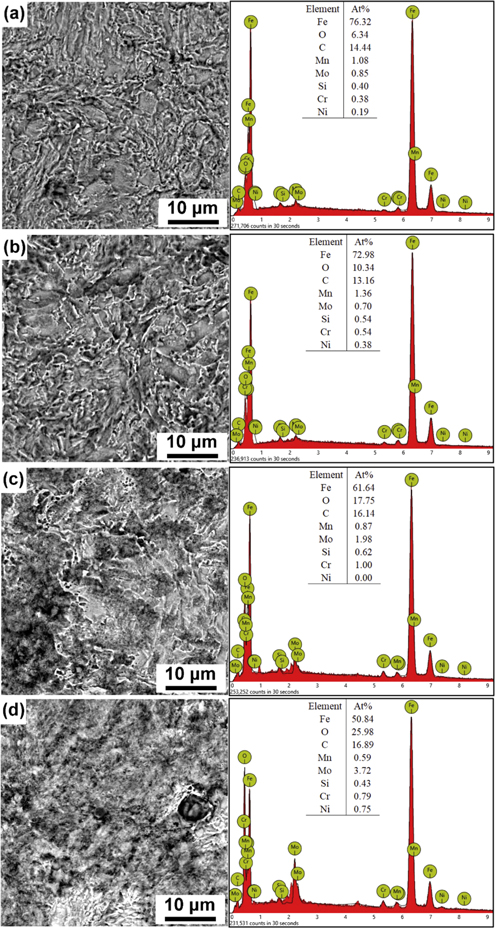
Figure 7. Morphologies observation and EDS analysis of corrosion layers formed on E690 steel at various temperatures: (a) 20 °C, (b) 35 °C, (c) 45 °C, and (d) 60 °C.
Download figure:
Standard image High-resolution imageIt can be seen that the content of the Fe and O varies greatly at different temperatures. The concentration of Fe, but the concentration O at 20 °C, 35 °C, 45 °C and 60 °C is 6.34, 10.34, 17.75 and 25.98 at.%, respectively. The precipitation rate of corrosion layer also increases with increased temperature. At temperatures below 60 °C, the corrosion product layers are generally porous and loose which leads to the increase of corrosion rate [45].
Figure 8 shows the AFM images for E690 steel after electrochemical tests in 3.5 wt.% NaCl solution at various temperatures. The AFM image of E690 steel shows a roughness of 276.5 nm at temperature of 20 °C, as shown in figure 8(a). Similarly, the surface roughness of E690 steel at 35 °C, 45 °C and 60 °C is 193.7, 155.1 and 145.2 nm, respectively. It is clear that the surface roughness is decreased with the increase of the temperature which is attributed to the formation of a thicker corrosion layer at elevated temperature. This is consistent with the results of SEM observation and EDS.
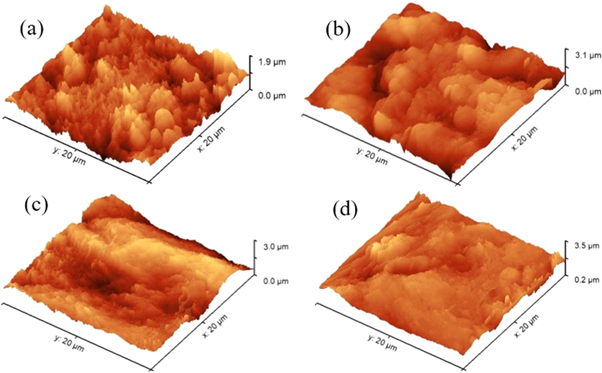
Figure 8. AFM images for E690 steel in 3.5 wt.% NaCl solution at (a) 20 °C, (b) 35 °C, (c) 45 °C and (d) 60 °C.
Download figure:
Standard image High-resolution image3.4. Analysis of corrosion layer
The chemical composition of the corrosion layer was analyzed by Raman spectroscopy, and the results are shown in figure 9. The peaks at 212, 214, 383, 386 and 485 cm−1correspond to the characteristic peaks of α-FeOOH [46–49], the peaks at 280 and 285 cm−1 correspond to the characteristic peak 295 cm−1 of α-Fe2O3 [50], and the peaks at 648, 654, 919 and 928 cm−1 represent the characteristic peaks of γ-FeOOH [48, 51, 52]. The deviation of the characteristic peaks may be due to the interaction between the characteristic peaks [53] and the influence of environmental factors on the structure of corrosion products. It can be inferred that the corrosion layers of E690 steel are mainly composed of α-Fe2O3, γ-FeOOH and α-FeOOH. At temperatures of 45 °C and 60 °C, the peaks at 919 cm−1 and 928 cm−2 corresponding to γ-FeOOH are disappearing. It gives further evidence that temperature has a significant influence on the compositions of the corrosion layers.

Figure 9. Raman spectra of the corrosion layer on E690 steel after potentiodynamic polarization test at (a) 20 °C, (b) 35 °C, (c) 45 °C and (d) 60 °C.
Download figure:
Standard image High-resolution imageFigure 10 shows the XPS spectrum of corrosion layer on E690 steel in 3.5 wt.% NaCl solution at various temperatures. There is no significant difference in XPS spectrum of samples under various temperature and the peaks at 711, 530 and 285 eV corresponding to Fe 2p, O 1 s and C 1 s, respectively.
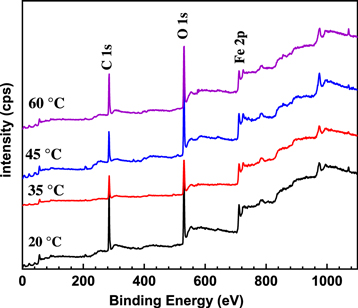
Figure 10. The XPS spectrum for E690 steel exposed to 3.5 wt.% NaCl solution at various temperatures.
Download figure:
Standard image High-resolution imageFigure 11 presents the XPS spectrum of Fe 2p for the corrosion layer formed on E690 steel. It is interesting to note that there exists the metallic Fe in the corrosion layer at temperatures of 20 and 35 °C. As shown in figure 11, α-Fe2O3, α-FeOOH and γ-FeOOH were observed in the corrosion layers, in accordance with the results reported research [27, 54–56]. This indicates that the surface of E690 steel samples has been completely covered by the corrosion layers at temperatures of 45 and 60 °C. The corrosion layers of E690 steel are mainly composed of α-Fe2O3, α-FeOOH and γ-FeOOH. The results of XPS show that the corrosion products on the surface of E690 steel are mainly composed of iron hydroxides and oxides, which is consistent with the results of Raman analysis. As the temperature increased, the contents of α-Fe2O3 and γ-FeOOH gradually decreased, while the α-FeOOH increased (figure 12), which was consistent with the results reported by Li et al for the low alloy steel in marine environment [40].

Figure 11. The detailed XPS spectrum of Fe 2p for corrosion layer formed on E690 steel formed at various temperatures: (a) 20 °C, (b) 35 °C, (c) 45 °C, and (d) 60 °C.
Download figure:
Standard image High-resolution image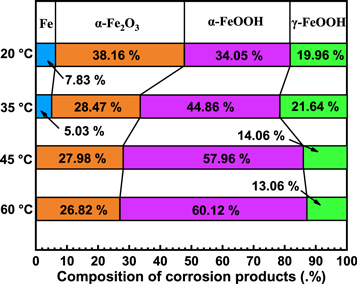
Figure 12. Compositions of the corrosion layer formed at various temperatures.
Download figure:
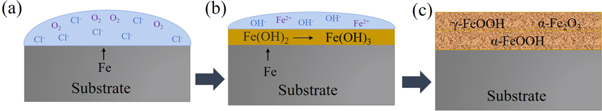
Standard image High-resolution imageIn the oxygen-saturated solution, the following cathodic reaction, which is of great importance for the corrosion behavior of low alloy steel in 3.5 wt.% NaCl solution:

The anodic reaction for E690 steel can be expressed as follow:

The Fe2+ can combines with OH− and form a insoluble compound Fe(OH)2 or combines with Cl− to form FeCl2. The reactions can be expressed as follows:


In which Fe(OH)2 is unstable and can be easily oxidized to Fe(OH)3. Subsequently, the Fe(OH)3 can transformed into γ-FeOOH. In this process, the cathodic and anodic reactions take place on the interface between the substrate and the solution, so the deposition of γ-FeOOH is usually preferentially formed on the surface of the substrate as the rust layer [57]. The reaction equation is as follows:


And then γ-FeOOH gradually transformed to α-FeOOH and α-Fe2O3. Through XPS analysis, it is clear that the fraction of α-FeOOH increases with the increase in temperature. But γ-FeOOH cannot form a compact corrosion product film due to its loose structure and strong water absorption [58], and α-FeOOH has a protective effect on steel due to its stability and compactness [59]. Therefore, with the increase in temperature, the thickness and compactness of the corrosion layer increase, the contact between the base metal and the solution decreases, and the corrosion layer slows down the corrosion. On the other hand, the increase of temperature enhances the movement of ions, thus promoting the dissolution of the substrate. The corrosion rate is determined by the combined action of the two mechanisms. Eventually, the corrosion rate of steel still shows a slowly increased trend. The corrosion mechanism of E690 steel in 3.5 wt.% NaCl solution is summarized and presented in figure 13.
Figure 13. Corrosion mechanism for E690 steel in 3.5% NaCl solution.
Download figure:
Standard image High-resolution image
4. Conclusion
The corrosion behavior of E690 steel was investigated in 3.5 wt.% of NaCl solution at temperature range of 20 °C—60 °C. The following conclusions can be drawn:
- 1)The corrosion rate of E690 steel increased with the increase in temperature.
- 2)Increasing temperature not only promoted the dissolution rate of E690 steel, but also promoted the precipitation of corrosion scale. From 20 to 35 °C, the corrosion product film was formed on parts of the steel matrix. From 45 to 60°C, the surface of steel was completely covered by corrosion products, and the corrosion product layer was compact.
- 3)The corrosion layers of E690 steel in 3.5 wt.% NaCl solution were mainly composed of α-Fe2O3, α-FeOOH and γ-FeOOH. With the increase in temperature, the fraction of α-FeOOH in corrosion layers increased, while α-Fe2O3 and γ-FeOOH decreased.
Acknowledgments
This work was financially supported by the National Natural Science Foundation of China (Nos. 51779111 and 51401092) and the Basic Scientific Research (2019414C003).
Data availability statement
The data that support the findings of this study are available upon reasonable request from the authors.