


Abstract
In recent times, catheters with integrated transducers have been extensively investigated in the field of biomedical engineering, especially for use in in vivo neonatal intensive care systems. An integral module of such systems is a blood pressure sensor that must fulfill the competing requirements of high sensitivity and small area. Typically, microelectromechanical systems-based membrane structures with integrated piezoresistors are used to realize such miniaturized blood pressure sensors. Conventionally, the electromechanical transduction of membrane deformation into an equivalent electrical signal is accomplished by piezoresistors connected in a fully active Wheatstone bridge configuration. However, such a configuration requires a large area for the placement of piezoresistors and layout of interconnects. Even though piezoresistors connected in a half-active Wheatstone bridge configuration overcome the area constraint, such an arrangement still suffers from reduced electrical sensitivity. In this paper we propose a novel three-terminal single-element piezoresistor membrane-based miniaturized blood pressure sensor for less than 1 French catheter application. Design and optimization of the sensor is performed using numerical simulations to satisfy the competing requirements of high sensitivity, low structural non-linearity and high mechanical stability. Simulations are carried out to optimize the piezoresistor position, piezoresistor doping concentration and relative dimensions of the piezoresistor and the membrane. Results depict that sensor with a die size of 175 × 150 × 50 μm3 results in an electrical sensitivity of 14.03 μA A–1 mmHg–1. Finally, a set of design guidelines are outlined for optimizing the performance of three-terminal piezoresistor-based blood pressure sensors.
Export citation and abstract BibTeX RIS
1. Introduction
Sensors based on microelectromechanical systems (MEMS) have been widely used for a variety of applications for the last four decades [1]. The MEMS market was initially propelled by the commercialization of miniaturized silicon pressure sensors followed by silicon accelerometers [2, 3]. Many other silicon and non-silicon MEMS devices have been reported after the initial phase of MEMS development. Even though silicon-based pressure sensors and accelerometers have achieved a level of maturity in terms of fabrication technology, some novel applications demand further miniaturization and better performance characteristics. An example is miniature catheters with an integrated pressure sensor for various biomedical applications [4]. Catheters are thin hollow flexible tubes that are inserted into human body during various surgical operations such as angioplasty [5], ablation [6] and glaucoma surgery [7], and are used in neonatal intensive care [8] and to measure parameters such as intracranial pressure [9] and various blood pressures the in heart [10]. The size of a catheter is specified by the French gauge system (Fr) which denotes the outer diameter (OD) of the catheter tube, where 1 Fr is 0.33 mm OD. Different categories of commercially available catheters for various applications are summarized in table 1.
Table 1. Various categories of catheters and their application.
| Catheter size | ||||
|---|---|---|---|---|
| Type of catheter | Fr | OD (mm) | ID (mm) | Various parameters measured by catheter |
| Intraventricular cathetera | 6, 9 | 2, 3 | 1.6, 2.388 | Intracranial pressure |
| Pulmonary artery catheter and continuous cardiac outputb | 5–9 | 1.67–3 | 1.194–2.388 | RAP, VP, PAP, WCP, CCO |
| Angiogram and angioplasty catheterc | 4–8 | 1.35–2.7 | 0.838–2.159 | Balloon pressure |
| Intraparenchymal cathetera | 5 | 1.67 | 1.194 | Intracranial pressure |
| Neonatal applicationd | 1–2 | 0.33–0.67 | 0.165–0.318 | Blood pressure and cardiac measurements |
Fr is the French gauge system; OD is the outer diameter of catheter; ID is the inner diameter of catheter; RAP is the right arterial pressure; VP is the ventricular pressure; PAP is the pulmonary arterial pressure; WCP is the wedge capillary pressure; CCO is the continuous cardiac output. a https://raumedic.com/fileadmin/user_upload/PDF/microchip-catheter-program.pdf. b http://ht.edwards.com/scin/edwards/eu/sitecollectionimages/products/mininvasive/cccatalogeu.pdf?update. c https://bostonscientific.com/content/dam/bostonscientific/pi/portfolio-group/resources/ProductCatalog/PI%20Product%20Catalog%20Full.pdf. d http://vygon.co.uk/pdf/upload/Vygon-Neonatal-Paediatric-Full.pdf.
There is great demand for highly miniaturized pressure sensors for catheters of 1 Fr and less for use in neonatal intensive care. The artery and vein size of neonates varies based on their weight and age. The mean diameter of neonatal blood vessels is usually in few millimeters, for example coronary artery is 1 mm [11], right pulmonary artery is 3 mm [12], internal jugular vein is 3 mm and subclavian vein is 2.9 mm [13]. In addition, smaller-diameter catheters are preferred since their use reduces blood loss, air embolism, thrombus formation, trauma, infection and recovery time compared with larger catheters [14]. Even though a few miniature pressure sensors are commercially available for 1 Fr applications, development of a high-performance sensor is still an ongoing research topic. Mikro-tip2 pressure catheters and SMI3 pressure catheters are a couple of commercially available 1 Fr pressure catheters. Several researchers have reported sensor designs for miniature catheter application by deploying different piezoresistors, membrane structures and signal conditioning circuits [15–20]. For instance, Patil et al [15] and Kalvesten et al [16] have reported polysilicon-based piezoresistive pressure sensors using quarter-active Wheatstone bridge (QWB) and half-active Wheatstone bridge (HWB) readout circuits, respectively, for 1 Fr catheter application. For less than 1 Fr catheter application, Melvas et al [17] and Usha et al [18] have reported piezoresistive pressure sensors using polysilicon and p-type single-crystal silicon materials, respectively, using HWB circuit. In the device reported by Melvas et al [17], complex structures such as leverage beams were used to improve the performance of miniature pressure sensors; however, this increased the fabrication cost with more process steps and decreased the yield.
Conventional piezoresistive sensors use a fully active Wheatstone bridge (FWB) configuration due to its benefits of high sensitivity, cancellation of temperature effects and high linearity. Typical FWB piezoresistive sensors use p-type silicon piezoresistors oriented along the 〈110〉 direction since p-type silicon has maximum piezoresistive coefficients along the 〈110〉 direction for sensing longitudinal stress. Even though FWB-based signal conditioning circuits are extensively used, they have limitations in terms of large area and more metal interconnects and terminals. In addition, on miniaturization, positioning of the piezoresistor becomes crucial since the maximum stress region is narrow. Further, the FWB configuration requires four spatially distributed equal-valued resistors that demand tight control over the process parameters. A deviation in the resistance value of the spatially distributed resistors will cause non-linearity due to offset voltage and temperature variations. For area-constrained applications, one may use either HWB or QWB configurations. However, these two configurations require off-chip resistors and their performance is inferior to the FWB in terms of linearity, temperature compensation and sensitivity.
As an alternative to Wheatstone bridge configurations, a single piezoresistor with a differential output has been reported by a few researchers. The working principle of a single-element piezoresistor (SEP) is similar to that of a Hall-effect transducer. On studying silicon-based Hall-effect sensors, Kanda [21] observed a change in the output voltage of a Hall transducer in response to an applied strain in the absence of a magnetic field. This observation led to the development of various SEPs by different researchers. Bao et al [22] reported a pressure sensor using a four-terminal SEP for square, circular and rectangular membranes. Later, Gridchen et al [23, 24] reported a new SEP with three terminals and compared its performance with a four-terminal SEP analytically. The research concluded that the voltage sensitivity of a four-terminal piezoresistor is twice that of a three-terminal piezoresistor. A three-terminal piezoresistor was used by Usha et al [18] to develop a miniature pressure sensor for similar application. Recently, a high-performance SEP was designed by Coraucci et al [25] by increasing the number of input terminals of a four-terminal SEP as a multiterminal piezoresistor. For applications with a catheter of less than 1 Fr where the overall chip size of the sensor is a major constraint, it is preferable to use a three-terminal piezoresistor rather than the other SEPs reported. A three-terminal piezoresistor has one input terminal and two output terminals. The differential stresses that prevail between the output terminals are transmuted as an output signal in proportion to the measurand. Since a three-terminal piezoresistor works on differential stress, on miniaturization a three-terminal piezoresistor is more suitable than HWB or QWB where stress on the membrane varies quite drastically. The benefits of TTP over HWB or QWB configurations are high miniaturization, better sensitivity [18], simple design and negligible offset voltage.
This paper presents a highly miniaturized piezoresistive absolute blood pressure sensor for application with catheters of less than 1 Fr. A novel three-terminal piezoresistor (TTP) is presented with better performance characteristics than the other reported SEPs. The objective of the work is to optimize the sensor design to improve the sensitivity with reduced linearity error, high mechanical stability and low temperature sensitivity. Simulations are performed using a computer-aided design (CAD) tool, IntelliSuite® version 8.7. The device is realized on a (100) single-crystalline silicon (SCS) wafer with an integrated 〈100〉-oriented p-type resistor. The resistors are diffused along the 〈100〉 orientation so as to make them more sensitive to shear stress (σs) than longitudinal and transverse stress components. A detailed graphical representation of shear stress distribution over the membrane is presented for positioning the piezoresistor at an optimal location. The piezoresistor length, width, junction depth and output terminal geometry are optimized to obtain an enhanced electrical sensitivity. Initially, a doping concentration of 1 × 1018 cm−3 is considered for the piezoresistor since this provides a high piezoresistive coefficient. Subsequently, considering the temperature effects, the doping concentration of the piezoresistor is optimized by maintaining a trade-off between the electrical sensitivity and the temperature sensitivity. Finally, a set of design guidelines are outlined to design a pressure sensor using the reported TTP for applications with catheters less than 1 Fr.
2. Device details and design parameters
The proposed pressure sensor reported in the present work consists of a thin rectangular membrane with an integrated piezoresistor, as shown in figure 1(a). The membrane edges are oriented along the 〈110〉 direction, whereas the diffused resistor is oriented along the 〈100〉 direction. In conventional piezoresistive sensors the resistors are oriented along the 〈110〉 direction to sense the difference between longitudinal and transverse stress components. However, the SEPs sense shear stress instead of longitudinal or transverse stress [22]. Thus, in the present work, the p-type silicon resistor is oriented along the 〈100〉 direction to sense the shear stress. Further, the diffused resistor is a single-element TTP with one input terminal (IN) and two output terminals (OUT1, OUT2) as shown in figure 1(a).

Figure 1. (a) A top view of the proposed piezoresistive pressure sensor with a zoomed in view of the piezoresistor. The length, width and thickness of the membrane and piezoresistor are represented as Lm, Wm, Tm and L, W, Tp, respectively. (b) A cross-sectional view of a catheter with a side-wall-mounted piezoresistive pressure sensor.
Download figure:
Standard image High-resolution imageUnlike conventional sensors integrated with spatially distributed piezoresistors, the proposed sensor with a single TTP distributes theoretically equal current through the output terminals under no-stress conditions, resulting in null offset. The overall dimensions of the sensor die are required to be less than the OD of the catheter in order to mount the sensor, as shown in figure 1(b). The sensor die is attached to stainless steel, ceramic or flexible polymer support using epoxy material [26, 27]. A biocompatible protective layer is used to encapsulate the sensor die (silicon is not a biocompatible material) and then it is integrated to the catheter by an adhesive material [28]. A polymeric layer is used as a protective layer to isolate the sensor from the environment, leaving only the membrane area exposed to the sensing environment. Recently, polymeric flip-chip bonding of the sensor die to a flexible Kapton film has been used for integrating the sensor with the catheter [29]. The lead-wire connections run through the length of the catheter to the power-up and monitoring setup at the end of the catheter.
The working principle of the proposed TTP is analogous to a Hall-effect transducer in which the output voltage varies in response to the applied magnetic field. In the TTP, with an applied pressure, the current through the output terminals varies in response to the stress generated. With no blood flow (i.e. zero pressure) the membrane remains at the null displacement position and the resistance of the two output terminals of the piezoresistor remains equal, which causes an equal current flow through the output terminals OUT1 and OUT2. The membrane will deflect from its zero position due to the blood flow and the force exerted by the impinging blood cells, resulting in the generation of a spatially distributed stress. Since the TTP is oriented along the 〈100〉 direction, the difference in the shear stress at the two output terminals of the piezoresistor results in a change in the resistance between the output terminals of the resistor, as given by equation (1)

where R1 and R2 are the resistance of the output terminals OUT1 and OUT2, respectively. In the present analysis, with an excitation current, the change in the resistance is transmuted as a change in the current, as represented by equation (2)

where I1 and I2 are the current through the output terminals OUT1 and OUT2, respectively. The performance metrics considered in the present study for designing the miniature piezoresistive sensor are
- electrical sensitivity,
- linearity,
- natural frequency.
The electrical sensitivity of the pressure sensor is the proportional change in the resistance of the piezoresistor with applied pressure. For an anisotropic material like silicon, the change in resistance of the piezoresistor depends on the stress experienced and the piezoresistive coefficient [30], which is given by equation (3)

where ΔR/R is the electrical sensitivity of the piezoresistor, πL, πT and πS are the longitudinal, transverse and shear piezoresistive coefficients, respectively, and σL, σT and σS are the longitudinal, transverse and shear stress, respectively. The magnitudes of the piezoresistive coefficients πL, πT and πS for a lightly doped p-type piezoresistor with respect to the direction of orientation are listed in table 2.
Table 2. Magnitude of the piezoresistive coefficients of p-type piezoresistor oriented along the 〈110〉 and 〈100〉 direction [30].
| Orientation | πL (×10–11 Pa−1) | πT (×10–11 Pa−1) | πS (×10–11 Pa−1) |
|---|---|---|---|
| 〈110〉 | 71.8 | −66 | 7.7 |
| 〈100〉 | 6.6 | −1.1 | 138.1 |
From table 2, for a p-type resistor, the longitudinal and the transverse piezoresistive coefficients are dominant in the 〈110〉 direction, whereas the shear piezoresistive coefficient is dominant in the 〈100〉 direction. The TTP is oriented along the 〈100〉 direction to achieve the maximum shear piezoresistive coefficient, and hence the electrical sensitivity can be expressed as

where σS1 and σS2 are the average shear stresses experienced by the output terminals OUT1 and OUT2, respectively. From equation (4) it is evident that a high electrical sensitivity is obtained by optimizing the piezoresistor position such that a large difference in the shear stress prevails between the output terminals.
Even though a larger deformation of the membrane increases sensitivity by inducing high stress, it reduces the linearity of the sensor. A trade-off is maintained by limiting the maximum displacement of the membrane to achieve high linearity and sensitivity. To ensure higher linearity, the membrane displacement at a maximum operating pressure must be very much less than the thickness of the membrane [31], as given by

where Tm is the thickness of the membrane and Dmax is the maximum displacement of the membrane. The maximum displacement of the membrane is a function of membrane shape and geometry as given by [32]

where α is a coefficient that depends on the shape and dimension of the membrane, P is the applied pressure, a is the length/radius of the membrane and E is the Young's modulus of the silicon substrate.
A thinner membrane is preferred for the design of miniature sensors in order to achieve good sensitivity. However, as the membrane thickness reduces, the stiffness/stability of the sensor also diminishes. In this regard, to ensure mechanical stability, a sensor structure with a high natural frequency is preferred [31]. In addition, since blood pressure is dynamic in nature, the natural frequency of the sensor structure is considered and the lateral dimensions of the membrane are chosen to achieve high mechanical stability along with high sensitivity and linearity. The natural frequency of a membrane is given by [33]

where K is a constant that depends on the lateral dimension of the membrane, ρ is the density of the material, υ is Poisson's ratio and A is the area of the membrane. The geometry of the membrane must be optimized to ensure higher shear stress and higher natural frequency with a smaller linearity error.
3. Simulation methodology
The pressure sensor with the integrated TTP is modeled using different modules of the finite element method (FEM)-based numerical simulation software IntelliSuite® (version 8.7). The sensor is designed in the IntelliFAB® module of the tool. To achieve computational accuracy the sensor is meshed using an adaptive mesh strategy with a higher density of mesh elements in the region where the TTP is positioned. Mesh convergence exercises are performed to optimize the meshing process and validation is done by comparing the electrical sensitivity obtained from simulation with the results reported in [25]. The material properties imparted to the sensor model include (entity properties):
- (100) n-type single-crystal silicon :
- EX = EY = 169 GPa, EZ= 130 GPa,
- υXY = 0.064, υ YZ = 0.36, υ ZX = 0.28,
- GXY = 50.9 GPa, GYZ = GZX = 79.6 GPa [34],
where the symbols E, G and υ represent the Young's modulus, shear modulus and Poisson's ratio, respectively, and
- p-type silicon piezoresistor aligned along the 〈100〉 direction:
- p = 1 × 18 cm−3,
- ρe = 0.04083 Ω cm,
- πS = 133.50 × 10⁻¹¹ Pa−1 [35],
where the symbols p, ρe and πS represent the surface doping concentration, resistivity and magnitude of the piezoresistive coefficient, respectively.
The electromechanical response of the sensor is investigated in the thermoelectromechanical (TEM®) module of the software. The sensor is applied with an input pressure ranging from 0 to 300 mmHg at the bottom of the membrane. Further, the TTP element is current excited (1 mA) and the sensor is operated at room temperature (25 °C).
4. Results and discussion
A systematic investigation was performed to analyze the effect of: (i) lateral dimensions of the membrane, (ii) position of the piezoresistor, (iii) lateral dimensions of the piezoresistor, (iv) length of the piezoresistor output terminals, (v) thickness of the piezoresistor and (vi) surface doping concentration of the piezoresistor on the performance of the sensor. Lateral dimensions of the membrane were optimized considering displacement sensitivity and linearity of the sensor. The geometrical dimensions, position and doping concentration of the piezoresistor were optimized to achieve a high electrical sensitivity and low temperature sensitivity.
4.1. Effect of the lateral dimensions of the membrane
The influence of the lateral dimensions of the membrane on the sensor performance was investigated by varying the length (Lm) and width (Wm) of the membrane for different membrane thicknesses (Tm). For application with a catheter of less than 1 Fr, the membrane dimensions must be designed such that it can be mounted within the catheter. A typical catheter length is 100 cm, therefore Lm is not limited whereas Wm is limited by the OD of the catheter. Therefore in this paper, a rectangular membrane is preferred instead of a circular or square membrane, since its dimensions suit catheter-based applications. In addition, a rectangular membrane exhibits higher stress than a square or circular membrane [32]. Bearing in mind the highly miniaturized lateral dimensions of the membrane, we considered relatively thin membranes of thickness 1.5 μm and 2 μm for the simulation analyses, as reported in [15, 17, 36–38]. Lateral dimensions of the membrane were varied to note the maximum displacement and the results are plotted in figure 2. For each Tm, five different values of Wm were considered and the Lm was varied such that the Lm/Wm ratio varied from 1 to 2.5. For instance, Wm was varied from 100 μm to 140 μm in steps of 10 μm for a membrane thickness Tm = 2 μm. Apart from the maximum displacement sensitivity, large deflection-induced structural non-linearity is considered to be a major performance factor for optimizing the membrane dimensions. The maximum membrane displacement considering the structural non-linearity constraint was computed from equation (5) and is plotted in figures 2(a) and (b) for Tm = 1.5 μm and Tm = 2 μm, respectively. From the simulation results the following observations are made: (i) for a fixed Wm, when Lm is increased, the maximum membrane displacement (Dmax) increases up to a Lm/Wm ratio of 2 and then saturates, due to the trend of coefficient α in equation (6), (ii) for both membrane thicknesses Tm, the variation in Dmax is a non-linear function of Wm; this is due to the non-linear dependence of Dmax on Wm as given in equation (6), and (iii) for a fixed Lm/Wm ratio, the thinner membrane (Tm = 1.5 μm) undergoes a higher Dmax, which results in a lower threshold for Dmax to avoid structural non-linearity. Considering the threshold of Dmax to avoid structural non-linearity, we have chosen ten membrane dimensions for Tm = 1.5 μm and Tm = 2 μm (summarized in table 3). For instance with Tm = 2 μm, five membranes with maximum displacement less than 0.2 μm are chosen to ensure high linearity and sensitivity.
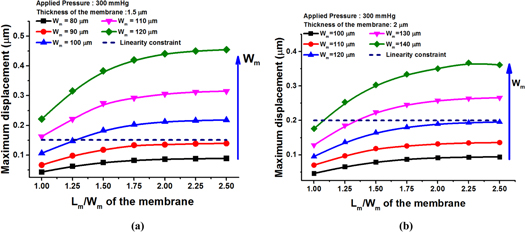
Figure 2. Variation in maximum displacement of the membrane as a function of the lateral dimensions of the membrane for two different membrane thicknesses: (a) Tm = 1.5 μm and (b) Tm = 2 μm.
Download figure:
Standard image High-resolution imageTable 3. Selected membrane dimensions, natural frequency, maximum shear stress and figure of merit (FoM).
| Tm = 1.5 μm | Tm = 2 μm | ||||||||||
|---|---|---|---|---|---|---|---|---|---|---|---|
| Parameter | Unit | M 1 | M 2 | M 3 | M 4 | M 5 | M 1 | M 2 | M 3 | M 4 | M 5 |
| Lm | μm | 157 | 180 | 202 | 225 | 125 | 210 | 240 | 270 | 163 | 140 |
| Wm | μm | 90 | 90 | 90 | 90 | 100 | 120 | 120 | 120 | 130 | 140 |
| Fn | MHz | 1.83 | 1.79 | 1.75 | 1.72 | 1.76 | 1.37 | 1.33 | 1.30 | 1.37 | 1.42 |
| σS | MPa | 13.2 | 13.06 | 13.02 | 13.0 | 14.9 | 12.59 | 12.59 | 12.56 | 13.95 | 13.77 |
| FoM | MPa (MHz)2 | 44.21 | 41.85 | 39.87 | 38.46 | 46.15 | 23.63 | 22.27 | 21.23 | 26.18 | 27.77 |
Further investigations were carried out to select the membrane dimensions with high sensitivity and mechanical stability by considering a new figure of merit (FoM). The new FoM is defined as  where σS is the maximum shear stress generated and Fn is the natural frequency of the sensor structure. We have computed the maximum shear stress (at an input pressure of 300 mmHg) and the natural frequency of the membrane. Both the magnitude of the shear stress and the natural frequency are a function of the material and geometrical dimensions of the membrane. The variation in the magnitude of shear stress, natural frequency and FoM of different membrane structures is listed in table 3. The dependence of natural frequency on the ratio of Tm/A results in a higher Fn for thinner membranes, since the area of a thinner membrane is less than that of a thicker membrane. It is observed from table 3 that for a fixed Wm, the peak magnitude of the shear stress reduces as Lm increases (i.e. surface area increases), since the shear stress is proportional to
  [33]. Furthermore, the FoM is maximum for membrane M5 with Tm = 1.5 μm. This is due to the higher shear stress and natural frequency of membrane M5 compared with the other membranes. It is concluded that, compared with other membranes, the membrane with dimensions 125 μm × 100 μm × 1.5 μm exhibits a better FoM. Therefore, for further investigation, we have fixed the membrane dimensions to 125 μm × 100 μm × 1.5 μm with a sensor die size of 175 μm (LD) × 150 μm (WD) × 50 μm (TD).
4.2. Positioning the piezoresistor
The electrical sensitivity of the sensor depends primarily on the material properties and geometry of the piezoresistor element. Apart from the aforementioned factors, the electrical sensitivity also depends on the stress experienced by the piezoresistor. To maximize the electrical sensitivity of a TTP, the following factors should be taken into account: (i) the TTP should be placed on the membrane where the magnitude of shear stress is maximum, and (ii) the output terminals should experience a maximum stress difference. In this regard, the stress distribution on the membrane is investigated to position the TTP element in the maximum shear stress region. The longitudinal (σL), transverse (σT) and shear stress (σS) profiles of the membrane with an applied pressure of 300 mmHg are shown in figures 3(a)–(c), respectively.

Figure 3. Simulated stress profiles: (a) longitudinal stress, (b) transverse stress, and (c) shear stress.
Download figure:
Standard image High-resolution imageIt is observed that unlike the longitudinal and transverse stress components that have their maximum magnitude in the central region of the membrane edges, the magnitude of the shear stress is more distributed and found to be maximum in the four quadrants of the membrane. It is also noted that: (i) the top-left and bottom-right quadrants of the membrane experience tensile shear stress, whereas the top-right and bottom-left quadrants of the membrane experience compressive shear stress, and (ii) irrespective of the type of shear stress tensor, its peak magnitude in all four quadrants is equal. To further examine the distribution of the shear stress tensor on the membrane, we have pictorially represented its variation in the top-right quadrant in figure 4. It is observed that the magnitude of shear stress is maximum (14.9 MPa) at Lm = 43 μm and Wm = 34 μm. On the other hand, its magnitude falls to 0 MPa at the center of the membrane. Therefore, it is concluded that to maximize the electrical sensitivity, the TTP should be positioned such that the output legs of the TTP experience a maximum shear stress difference.
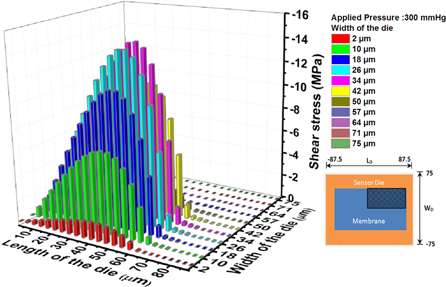
Figure 4. Pictorial representation of the shear stress distribution across the top-right quadrant of the membrane (fill pattern).
Download figure:
Standard image High-resolution image4.3. Optimization of piezoresistor lateral dimensions
4.3.1. Effect of the piezoresistor total length (L) to width (Wp) ratio
The impact of piezoresistor lateral dimensions on the electrical sensitivity was investigated by varying the ratio of L to Wp for three different values of Wp. For a fixed Wp, the ratio L/Wp is varied from 0.25 to 1 by increasing L. From the shear stress analysis, the total width W is kept constant at 55 μm; this is divided between Wo and Wp (i.e. W = 2Wo + Wp) where Wo is the width of the output terminal and Wp is the width of the piezoresistor as shown in figure 5(a). For the three different Wp values (i.e. 45 μm, 35 μm and 25 μm), Wo is considered as 5 μm, 10 μm and 15 μm, respectively, to maintain a constant W. In all the computations, the piezoresistor thickness is kept constant at 0.5 μm and Lo at 5 μm. The variation in the electrical sensitivity and the nominal resistance as a function of the ratio L/Wp for different Wp is shown in figure 5(b).
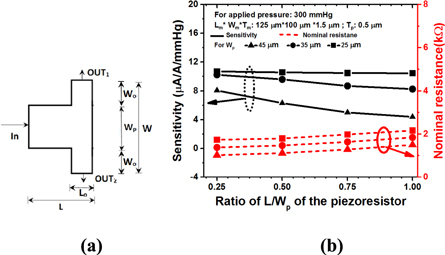
Figure 5. (a) Three-terminal piezoresistor structure and (b) variation in the electrical sensitivity and nominal resistance as a function of L/Wp for different Wp values of the piezoresistor.
Download figure:
Standard image High-resolution imageThough the TTP is an irregular-shaped resistor, it is observed from the simulation results that the nominal resistance of the TTP increases: (i) as the ratio L/Wp increases for a fixed Wp, and (ii) as the Wp decreases for a fixed L/Wp. The following observations are made: (i) for a fixed Wp, the electrical sensitivity of the sensor decreases as the ratio L/Wp increases. This is due to the fact that, as L increases, the average stress experienced by the piezoresistor decreases due to an increase in the unstressed region; (ii) similarly for a fixed L/Wp ratio, as Wp increases, the electrical sensitivity decreases due to the increase in the unstressed region of the piezoresistor; and (iii) the variation in electrical sensitivity is a non-linear function of Wp, i.e. when compared with the piezoresistor with Wp = 25 μm, the piezoresistors with Wp = 45 μm and Wp = 35 μm show a higher fall in the magnitude of the electrical sensitivity at larger L/Wp. This is due to the fact that, at larger Wp, the increase in L results in a larger unstressed region and lower average stress when compared with smaller values of Wp. As a consequence, for lower Wp, the effect of length variation on the sensitivity is also reduced. From the analysis, it is observed that lower L/Wp ratios with lower Wp result in higher sensitivity. For an L/Wp ratio of 0.25, when Wp decreases from 35 μm to 25 μm, sensitivity increases by 4.55% whereas the nominal resistance increases by 25.55%. Hence, a further reduction in Wp results in a more significant increase in the nominal resistance than in the electrical sensitivity. Therefore, for subsequent simulations we have considered the piezoresistor with width Wp = 25 μm and Wo = 15 μm.
4.3.2. Effect of the piezoresistor total length (L) and output terminal length (Lo)
The influence of the L and Lo on the nominal resistance and the electrical sensitivity was investigated by varying the L/Lo ratio for three different values of L (i.e. 6 μm, 12 μm and 18 μm). For a fixed L, the L/Lo ratio is increased from 1 to 3 by decreasing Lo. The other parameters of the piezoresistor that are fixed include: (i) Wp = 25 μm, (ii) Wo = 15 μm, and (iii) Tp = 0.5 μm. The variation in nominal resistance and electrical sensitivity as a function of L and Lo is shown in figure 6.
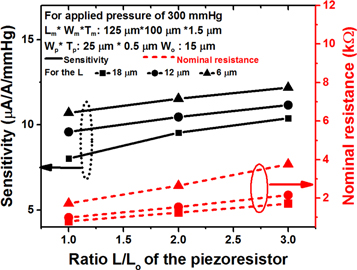
Figure 6. Variation in the electrical sensitivity and nominal resistance as a function of the L/Lo ratio for different L values of the piezoresistor.
Download figure:
Standard image High-resolution imageFor a fixed L, due to the irregular shape of the TTP, the nominal resistance of the piezoresistor increases with decrease in Lo (i.e. increase in the L/Lo ratio) since it narrows down the piezoresistor output terminals (see figure 5(a)). From the results, the nominal resistance is observed to be a non-linear function of L. This is due to the fact that, for a fixed L/Lo, as L decreases Lo also decreases to maintain the ratio L/Lo, which results in larger nominal resistance. From the simulation results, it is found that the electrical sensitivity is increased as the ratio L/Lo increases since the reduction in Lo reduces the unstressed region. Similarly, as L decreases the unstressed region becomes smaller, resulting in higher electrical sensitivity. A high electrical sensitivity is observed with higher L/Lo and lower L. From the analysis, as the ratio L/Lo increases from 2 μm to 3 μm, the electrical sensitivity increases by 5.64% whereas the nominal resistance increases by 42.09%. Therefore, subsequent increase in L/Lo results in a larger nominal resistance compared with the change in sensitivity. Hence, for the further simulations, a piezoresistor with Lo = 2 μm and L = 6 μm is chosen to achieve high sensitivity.
4.4. Effect of the thickness of the piezoresistor
The impact of piezoresistor thickness on the electrical sensitivity of the sensor is investigated by keeping the lateral dimensions of the piezoresistor and the membrane constant. Variation in the electrical sensitivity and nominal resistance of the sensor as a function the piezoresistor thickness (Tp) are shown in figure 7. The plot also contains the percentage reduction in shear stress across the thickness of the piezoresistor.

Figure 7. Variation in the electrical sensitivity, shear stress reduction and nominal resistance as a function of piezoresistor thickness.
Download figure:
Standard image High-resolution imageThe following observations are made: (i) as Tp increases, the nominal resistance value decreases due to the inverse relationship of nominal resistance and Tp; (ii) the percentage reduction of shear stress across the thickness of the piezoresistor from its peak value at the surface varies from 25% to 96% as Tp increases from 0.2 μm to 0.8 μm; and (iii) the electrical sensitivity reduces when Tp is increased. This is mainly due to the fact that across the membrane thickness, the magnitude of the shear stress falls to zero at the neutral axis, which in the present study is located at Tm/2. When Tp is increased, the average stress experienced by the piezoresistor decreases, which results in a reduction of the electrical sensitivity. Therefore it is concluded that thinner piezoresistors result in higher electrical sensitivity. However, realizing a shallow piezoresistor is a challenging process, so for further simulations we have considered Tp = 0.2 μm.
4.5. Effect of the surface doping concentration
The variation in the temperature sensitivity and electrical sensitivity of the sensor are analyzed as a function of surface doping concentration of the piezoresistor ranging from 1 × 1018 cm−3 to 1 × 1019 cm−3. For a fixed piezoresistor and membrane geometry, the variation in the aforementioned parameters as a function of surface doping concentration is shown in figure 8. Theoretically a piezoresistor provides zero temperature sensitivity and a very high electrical sensitivity. However, the microfabricated piezoresistor is sensitive to temperature as well. The temperature sensitivity of the piezoresistor can be reduced by optimizing the surface doping concentration of the piezoresistor. To optimize the surface doping concentration of the piezoresistor, a trade-off is maintained between the temperature sensitivity and electrical sensitivity; this is represented as a trade-off factor (TF). The TF is the ratio of the electrical sensitivity at 25 °C to the electrical sensitivity for temperature variation from −25 °C to 75 °C and is represented as

where, S–25, S25 and S75 represent the electrical sensitivity of the sensor at −25 °C, 25 °C and 75 °C, respectively. Based on the chosen blood pressure application, a range of temperature variation from –25 °C to 75 °C is chosen for the analysis. A high TF represents the electrical sensitivity is independent of temperature variation.
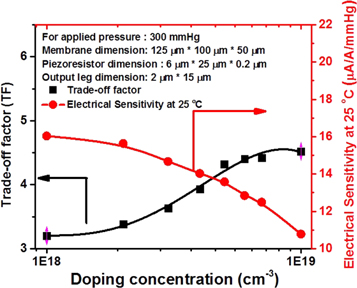
Figure 8. Variation in the electrical sensitivity and trade-off factor as a function of the surface doping concentration of the piezoresistor.
Download figure:
Standard image High-resolution imageFrom the simulation results, it is found that there is a fall in the magnitude of the electrical sensitivity when the surface doping concentration increases, which is due to the reduction in the magnitude of piezoresistive coefficients at higher surface doping concentrations. It is observed that as the surface doping concentration increases, the magnitude of TF increases. This is due to the reduction of the temperature dependence of piezoresistor at higher doping concentrations, which results in negligible variation in the electrical sensitivity of the sensor over the range of operating temperatures. A surface doping concentration of 4 × 1018 cm−3 is chosen based on the following observations: (i) the rate of fall in the magnitude of the electrical sensitivity is higher near the surface doping concentration of 1 × 1019 cm−3; (ii) the surface doping concentration, which ranges from 4 × 1018 cm−3 to 6 × 1018 cm−3, offers a minimum temperature coefficient of resistance (TCR) [39]; and (iii) the typical range of nominal resistance used in catheter-based blood pressure measurement applications4 is in the range of 1.4–7 kΩ [17, 19]. At a surface doping concentration of 4 × 1018 cm−3, the nominal resistance and the electrical sensitivity are found to be 3.9 kΩ and 14.03 μA A–1 mmHg–1, respectively.
4.6. Comparison with a single-element piezoresistor
Compared with other single-element piezoresistors reported in the literature, like a three-terminal piezoresistor [24] and multiterminal piezoresistor [25], the four-terminal piezoresistor (4TP) [23] has the highest electrical sensitivity for catheter applications. Therefore, to evaluate the performance of the proposed TTP structure, it is compared with the performance of a 4TP. The structure of a 4TP is shown in figure 9(a). For the present investigation, we have kept the position of the output terminals and the lateral dimensions of both the piezoresistors same, at W = 55 μm, Wo = 15 μm, Wp = 25 μm, Lo = 2 μm and Tp = 0.2 μm. The variation in the electrical sensitivity of a TTP and a 4TP as a function of L/Wp is shown in figure 9(b).
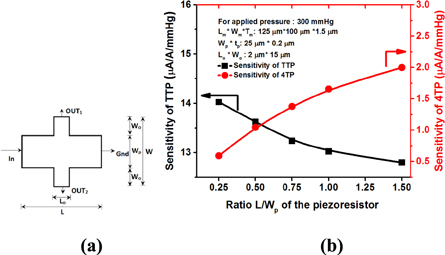
Figure 9. (a) Structure of a four-terminal piezoresistor (4TP) and (b) variation in the electrical sensitivity of TTP- and 4TP-based pressure sensors for different L/Wp ratios.
Download figure:
Standard image High-resolution imageFrom the simulation results, it is observed that the electrical sensitivity of the 4TP increases as the L/Wp ratio increases. In contrast, the electrical sensitivity of a TTP decreases as the L/Wp ratio increases. The major reasons for the change in the trend of the electrical sensitivity of the SEPs are the average stress experienced and the change in the boundary conditions. For a 4TP the excitation current is distributed to the two output terminals and the ground terminal, whereas for a TTP, the excitation current is distributed only to the output terminals. As L increases in a 4TP, the distribution of current to the output terminals is greater than towards the ground terminal due to the increase in resistance of the piezoresistor, resulting in a larger electrical sensitivity. In the case of the TTP, the electrical sensitivity decreases as length increases due to the reduction in average stress. In addition, with the same position of the output terminals, the average stress experienced by the TTP is more than for a 4TP. Therefore, it is concluded that the performance of proposed TTP is better than 4TP.
The proposed sensor design aims to achieve lower structural non-linearity and better stability for eventual use as a commercial standard sensor. Compared with the recent SEP-based pressure sensors reported in [18] and [25], the electrical sensitivity of the proposed sensor is lower. This is due to the larger membrane dimensions of the reported design than in the proposed sensor. The larger membrane design results in high shear stress which in turn results in high electrical sensitivity. However, the reported pressure sensors are not miniaturized like the proposed sensor. From the literature, Patil et al [15], Kalvesten et al [16] and Melvas et al [17] reported a pressure sensor design with similar membrane dimensions which offers an electrical sensitivity of 5.49, 2 and 5 μV V–1 mmHg–1, respectively. In comparison, the optimized pressure sensor design offers a better electrical sensitivity of 14.03 μA A–1 mmHg–1 with low structural non-linearity.
4.7. Validation with experimental results
FEM-based modeling is widely used in the design and optimization of MEMS sensors. However, performance of the fabricated sensor usually deviates from the finite element analysis due to various assumptions considered during the modeling. Major reasons for the deviation include the following: (i) assumption of a uniform doping concentration across the piezoresistor thickness; (ii) impact of metallization; (ii) variation in operating temperature; and (iv) packaging-related issues. Impact of the metal contact and bond pads on the performance of the sensor was investigated by comparing the performance of the sensor with and without metal layers, as shown in figure 10. The results of the analysis are shown in table 4. The metal interconnects are patterned on the membrane in such a way that majority of the metal layer runs outside the membrane. The material properties of silicon dioxide and aluminum metal are included, as reported in [40] and [32], respectively. From the results, a difference in sensitivity of 2.267% is observed; hence for most of the FEM modeling the effect of metallization is neglected.
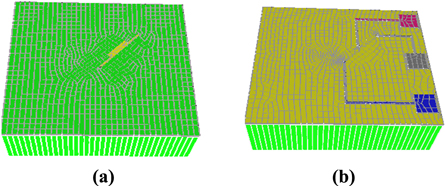
Figure 10. Top view of the proposed sensor: (a) without metal contact and bond pads and (b) with metal contact and bond pads.
Download figure:
Standard image High-resolution imageTable 4. Effect of metal contact and bond pads on the performance of the sensor.
| Sensor structure | Displacement (μm) | Shear stress (MPa) | Sensitivity (μA A–1 mmHg–1) |
|---|---|---|---|
| Without metal layer | 0.1477 | 14.9 | 14.03 |
| With metal layer | 0.1444 | 14.639 | 13.712 |
In order to estimate the possible deviation in the performance of the sensor when it is finally fabricated, we modeled three different pressure sensors using the single-element piezoresistor reported by Usha et al [18] and Coraucci et al [25] and compared the results of the model with the experimental results. The sensor design consists of a circular membrane with an implanted three-terminal piezoresistor and a square membrane sensor with an implanted four-terminal and a multiterminal SEP. The geometrical dimensions, material properties and excitation current are considered as reported in [18] and [25]. The experimental results are used to validate the modeling methodology and the results are shown in figure 11.
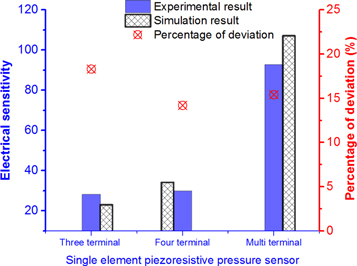
Figure 11. Performance comparison of modeled single-element piezoresistive sensor with experimental results.
Download figure:
Standard image High-resolution imageFrom the results it is seen that the deviation between experimental and simulation results ranges from 18.3% to 14.2%. The assumption of a uniform doping concentration across the piezoresistor thickness is responsible for much of the difference [41]. The larger difference of 18.3% is found since the dimension of the realized piezoresistor is quite different from the optimized design, as reported by the authors. Other researchers have shown simulation results in close approximation to the experimental results [42, 43]. With the above results, an average deviation of 15% is expected when the sensor is realized. The fabrication process flow for realizing the proposed pressure sensor design is outlined in figure 12. Fabrication of the proposed sensor is under way and the results will be communicated later.

Figure 12. Fabrication flow of the proposed sensor along the cross-section AA' with mask layouts.
Download figure:
Standard image High-resolution image
A set of design rules are suggested for the design of a membrane-based pressure sensor with an integrated TTP:
- 1.Membrane
- A wider rectangular membrane with an Lm/Wm ratio of 1.25 or less should be designed to generate maximum shear stress.
- Membrane lateral dimensions with high FoM must be chosen to satisfy the non-linearity constraint.
- 2.Piezoresistor
- The L/Wp ratio of the piezoresistor should be 0.25 or less with a lower Wp.
- A lower L with an L/Lo ratio of more than 2 should be chosen to obtain high electrical sensitivity.
- A shallow piezoresistor with a surface doping concentration of 4 × 1018 cm-3 to 6 × 1018 cm-3 should be chosen to ensure a minimum TCR and high TF.
5. Conclusion
This paper presents the design of a piezoresistive pressure sensor using a TTP for application with catheters of less than 1 Fr. The design and optimization of the sensor is carried out by using a numerical simulation tool. From the simulation results, it is found that the membrane dimensions play an important role in achieving greater stability, sensitivity and linearity. Considering the aforementioned factors the lateral dimensions of membrane is chosen as 125 μm × 100 μm × 1.5 μm. The piezoresistor is optimized to achieve high sensitivity based on geometry, doping concentration and temperature dependence. The optimized length (L) and width (W) of the piezoresistor are 6 μm and 55 μm, respectively, with output terminals of length (Lo) 2 μm and width (Wo) 15 μm. Based on the simulation results, a surface doping concentration of 4 × 1018 cm-3 is chosen by considering the trade-off between the electrical ;sensitivity, temperature sensitivity and nominal resistance. At the chosen surface doping concentration, the sensor exhibits an electrical sensitivity of 14.03 μA A–1 mmHg–1. Lastly, a set of design rules are devised for designing the TTP-based piezoresistive pressure sensor.
Acknowledgments
This work was supported by NPMASS, Government of India. The authors acknowledge the support of Professor Z C Alex of VIT University for arranging the facilities for simulation analysis. The authors acknowledge Mr Vetrivel of the School of Electronics Engineering of VIT Chennai for his help in simulation analysis.
Footnotes
- 2
Miller Instruments Inc. launched the world's smallest sensor tip in 2005 (http://millar.com/about-us/news/millar-instruments-launches-worlds-smallest-sensor-tip-pressure-catheter).
- 3
Silicon Microstructures Inc. launched the SM1120 pressure catheter in 2015 (www.si-micro.com/about-smi/about-us/news-events/smi-launches-catheter-mountable-pressure-sensor.html).
- 4
Silicon Microstructures Inc. SM5108 miniature pressure catheter with a nominal resistance of 7 kΩ (http://si-micro.com/fileadmin/00_smi_relaunch/products/die/datasheet/SM5108E_Datasheet.pdf).