


Abstract
Determining the relationship between mechanisms involved in action planning and/or execution is critical to understanding the neural bases of skilled behaviors, including tool use. Here we report findings from two fMRI studies of healthy, right-handed adults in which an event-related design was used to distinguish regions involved in planning (i.e. identifying, retrieving and preparing actions associated with a familiar tools' uses) versus executing tool use gestures with the dominant right (experiment 1) and non-dominant left (experiment 2) hands. For either limb, planning tool use actions activates a distributed network in the left cerebral hemisphere consisting of: (i) posterior superior temporal sulcus, along with proximal regions of the middle and superior temporal gyri; (ii) inferior frontal and ventral premotor cortices; (iii) two distinct parietal areas, one located in the anterior supramarginal gyrus (SMG) and another in posterior SMG and angular gyrus; and (iv) dorsolateral prefrontal cortex (DLFPC). With the exception of left DLFPC, adjacent and partially overlapping sub-regions of left parietal, frontal and temporal cortex are also engaged during action execution. We suggest that this left lateralized network constitutes a neural substrate for the interaction of semantic and motoric representations upon which meaningful skills depend.
Introduction
A defining characteristic of humans is their skillful use of complex tools to accomplish tasks that would otherwise be physically and/or mentally intractable (Ambrose, 2001). While a variety of other species fashion and use tools to solve problems, as far as we know only humans have established a technological culture in which the manufacture and use of artifacts is central (Tomasello, 1999; Povinelli, 2000). Understanding the brain mechanisms that represent tool use skills is therefore a core, yet unresolved, issue in human cognitive neuroscience (Johnson-Frey, 2003c, 2004; Maravita and Iriki, 2004).
The vast majority of what is known about the substrates of tool use derives from studies of patients with ideomotor apraxia (IM) — a disorder of skilled actions that cannot be explained by lower-level perceptual or motor deficits (Rothi and Heilman, 1997). IM patients are typically more impaired with skills involving objects (i.e. tool/utensil use) than intransitive actions (e.g. waving goodbye; Roy et al., 1991). They are particularly impaired when asked to pantomime how familiar tools are used from memory even when using the ipsilesional hand (Geschwind and Kaplan, 1962; Goldenberg, 2003; Goldenberg et al., 2003). Though typically more successful at actual tool use, IM patients are known to commit errors even under these circumstances (De Renzi et al., 1982; Clark et al., 1994; Poizner et al., 1995).
Studies of IM patients suggest a number of hypotheses concerning the nature of representations underlying acquired tool use skills, three of which are addressed in the following experiments. First, representations of tool use skills are functionally dissociable from representations of the sensorimotor transformations involved in prehension (Buxbaum, 2001; Johnson-Frey, 2003a; Johnson-Frey and Grafton, 2003). These patients are often surprisingly accurate when grasping and manipulating familiar objects on the basis of their perceptual properties, even when failing to use such objects appropriately for their learned functions (Sirigu et al., 1995; Buxbaum et al., 2003). Likewise, IM patients can infer novel objects' uses from their 3-D structural properties (Goldenberg and Hagmann, 1998).
Second, the left cerebral hemisphere appears to play a critical role in representing tool use skills. IM apraxics have lesions that overlap maximally within and adjacent to the left IPS, including both the ventral extent of SPL and extending into the IPL [supramarginal gyrus (SMG) and angular gyrus (ANG)], and/or left middle frontal gyrus (GFm) (Haaland et al., 2000).
Third, the left hemisphere supports representations that are independent of the upper limb involved in skill execution. Apraxics with left hemisphere damage (Liepmann, 1905; Goldenberg et al., 2003) or disconnection (Geschwind and Kaplan, 1962; Geschwind, 1965; Johnson-Frey et al., 2004a) are impaired when using either side.
Functional Neuroimaging Studies of Tool Knowledge and Use
Functional neuroimaging studies employing tools as stimuli consistently detect activations in three distinct regions within the left cerebral hemisphere: posterior temporal cortex, inferior-middle frontal cortex, and posterior parietal cortex (Chao et al., 1999; Chao and Martin, 2000; Kellenbach et al., 2003; Johnson-Frey, 2004). These areas include those parieto-frontal regions implicated in IM above. Yet, most neuroimaging tasks have employed perceptual/semantic tasks that do not involve explicity planning or executing tool use actions.
Left Posterior Temporal Cortex
Naming tools selectively activates posterior left superior/middle temporal gyri (STG/MTG) (Martin et al., 1996). This area is also active when generating action words (Martin et al., 1995), answering questions about tools (Chao et al., 1999) or identifying actions performed with versus without a tool (Damasio et al., 2001; Kellenbach et al., 2003). These regions respond differentially to the biological motions of human forms (STG) versus the non-biological motions associated with manipuating tools (MTG) (Beauchamp et al., 2002, 2003). Further, STG appears to integrate multi-modal (auditory and visual) attributes of objects including tools into a coherent representation (Beauchamp et al., 2004). In addition, apraxic patients who experience conceptual-level impairments (e.g. trying to eat with a toothbrush, Ochipa et al., 1989) tend to have lesions in the left hemisphere at the intersection of the temporal, parietal, and occipital cortices (De Renzi and Lucchelli, 1988), and damage to left posterior temporal cortex is associated with disruptions of action specific semantic knowledge (Tranel et al., 1997, 2003). Together with the lesion data noted above, these findings suggest an important role for left posterior temporal areas (posterior superior temporal sulcus (STS)/MTG/STG) in representing semantic information concerning manipulable objects and their associatated actions (Chao et al., 1999; Damasio et al., 2001; Kellenbach et al., 2003). This information is essential to planning appropriate tool use skills.
Perceptual and/or semantic tasks involving tools or associated actions also activate left frontal and parietal areas that are not typically associated with object recognition or semantic access, and reside outside the ventral procesing stream.
Frontal Cortex
Activation of left inferior frontal and/or ventral premotor cortex — a region associated with visuomotor transformations for grasping and manipulating objects in both macaques (Rizzolatti et al., 2002) and humans (Binkofski et al., 1999a) — is observed during tool naming (Martin et al., 1996; Chao and Martin, 2000) and viewing (Chao and Martin, 2000). In addition, left GFm is activated when identifying the actions with which tools are associated (Grabowski et al., 1998). Several studies also report activity in dorsal premotor cortex during the observation of familiar tools (Perani et al., 1995; Grafton et al., 1997; Handy et al., 2003). As noted earlier, lesions of left ventral–middle frontal cortex are also associated with IM apraxia (Heilman et al., 1982; Haaland et al., 2000).
Posterior Parietal Cortex
Finally, left SMG is also active during a variety of tasks involving tools (Grezes and Decety, 2001), including naming (Martin et al., 1996; Chao and Martin, 2000; Okada et al., 2000), action word generation (Martin et al., 1995), action semantic judgements (Kellenbach et al., 2003) and planning tool use gestures (Moll et al., 2000). This area appears to be particularly sensitive to tasks that demand explictly accessing action representations (Kellenbach et al., 2003). In macaques (Sakata et al., 1995) and humans (Binkofski et al., 1998; Culham et al., 2003; Johnson-Frey et al., 2004b), anterior SMG (putative AIP) is involved in representing sensorimotor transformations for grasping and manipulating objects. In macaques, this region is directly connected to inferior frontal cortex and forms a circuit for the representation of visually guided grasping (Luppino and Rizzolatti, 2000). Consequently, activations of inferior-ventral frontal and posterior parietal cortices in perceptual and/or semantic tasks involving tools may indicate that how these objects are manipulated is an attribute included in their representations (Chao and Martin, 2000; Martin and Chao, 2001). Nevertheless, data from apraxia patients discussed above suggest that representations of tool use skills are functionally dissociable from sensorimotor transformations necessary for their dexterous execution, and from those needed for object recognition.
In short, data from both brain-injured patients and functional neuroimaging studies of healthy adults suggest a priviledged role for a distributed network within the left cerebral hemisphere in the representation of skilled actions including tool use. An unresolved question concerns the role(s) played by areas within this network when planning tool use actions, i.e. when identifying tool stimuli for purposes of acting on them, determining associated actions and explictly accessing motor programs for skilled actions involved in their usage (Johnson-Frey, 2004). Two previous studies that attempted to isolate areas involved in planning tool use gestures report activity within left posterior parietal cortex (SMG, ANG and/or SPL) and left GFm (Moll et al., 2000; Choi et al., 2001). Of concern is the fact that both investigations also report considerable involvement of motor, premotor and sensory structures that would typically be observed during movement execution. This could reflect the limited ability of these block design experiments to differentiate between areas involved in action planning versus execution. The success of this strategy depends on there being an equivalence between the demands of executing tool use gestures and control actions such that areas involved in overt movements cancel during the subtractive comparison. If, for instance, tool use gestures place greater demands on brain regions involved in movement execution than the control condition, then these areas will survive the subtraction and falsely appear to be contributing to the planning of tool use skills. Conversely, areas that contribute equally to both gestural and control movements will be eliminated. These factors could explain several discrepencies including whether tool use planning is associated primarily with the left IPL (Moll et al., 2000) or SPL (Choi et al., 2001), the absence of left posterior temporal activity (Moll et al., 2000) and the involvement of movement-related cortical and subcortical areas (Moll et al., 2000; Choi et al., 2001).
A more effective way to distinguish between activity related to action planning versus execution is to use an event-related design. This makes it possible to insert ‘catch’ trials in which subjects are required to retrieve and plan tool use gestures, but then are not allowed to execute them (NOGO trials). In the present studies, this strategy is used to address three questions: (i) What specific brain areas are involved in planning and/or executing tool use gestures? (ii) Are there significant individual differences in the location(s) of posterior parietal activations associated with planning tool use skills? (iii) What specific areas support limb-independent representations of tool use skills?
Experiment 1: Planning and Executing Tool Use Gestures: Right Hand
In this initial experiment subjects planned and/or executed tool use gestures with their dominant right hands. Brain areas involved in action planning were isolated by contrasting results of the TOOL-NOGO condition versus CONTROL-NOGO condition, as depicted in Figure 1. On the basis of findings discussed above, we expected activity in three general regions, all within the left hemisphere: posterior temporal, inferior-middle frontal and posterior parietal cortices.
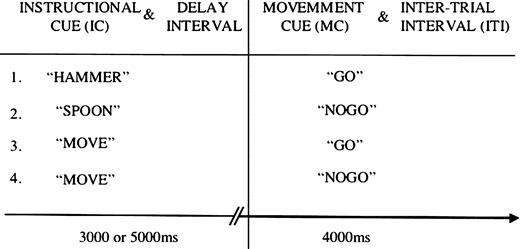
Experimental design for experiments 1 and 2. All stimuli were presented aurally and subjects' eyes remained closed throughout testing. On half of the trials the instructional cue (IC) identified a familiar tool commonly used unimanually with the dominant hand, on the remaining control trials subjects heard the word ‘move’. ICs were immediately followed by a variable duration delay interval during which the associated actions were planned. In control trials subjects prepared a non-meaningful hand movement. A movement cue (MC) instructed subjects to execute (GO) or abort (NOGO) the planned action.
Similarly, regions involved in the execution of tool use gestures were isolated by contrasting results of the TOOL-GO versus TOOL-NOGO conditions (Fig. 1). To the extent that the above-mentioned areas are involved in the production of praxis skills, we reasoned that they too should be active, along with established sensorimotor regions of frontal and parietal cortex, basal ganglia and cerebellum.
Method
Thirteen healthy adults (10 females, 3 males) participated in experiment 1. All were right hand dominant as verified by the Edinburgh Handedness Inventory (Oldfield, 1971), and none had a history of neurological or psychological illness. This protocol was approved by the Committee for the Protection of Human Subjects at Dartmouth College.
Stimuli were presented aurally via a non-commercial, MRI-compatible headphone system. Stimulus timing was controlled by a microcomputer running Presentation software (Neurobehavioral Systems, Davis, CA). Software was triggered by an external signal generated by the MRI-scanner at the onset of data acquisition. Stimuli consisted of the digitally recorded names of 30 familiar manipulable tools/utensils, whose uses are performed unimanually with the dominant hand (e.g. knife, hammer, or pencil).
Each subject performed six functional runs with their eyes closed. Runs each consisted of 60 trials and lasted 8 min. An additional 10 s of rest occurred at the beginning and 20 s rest at the end of each run. Counterbalancing of stimuli in each run was optimized so that items from any one condition had an equal probability of preceding or following items from any of the other conditions. The order of runs was counterbalanced across subjects. Each trial began with the subject's left hand resting comfortably at their side and the right hand palm down on their torso. Each trial consisted of three components: (i) an instructional cue (IC); (ii) a variable delay interval; and (iii) a movement cue (MC). Blank time was digitally added to all IC and MC stimuli to create files that were uniformly 1000 ms in length (Fig. 1).
On 50% of trials, ICs identified a familiar tool. When hearing one of these tool ICs, subjects used the delay interval to prepare to pantomime the associated action. If the subsequent MC was a GO signal, they executed the pantomime. If the MC was a NOGO signal, they relaxed until the next IC occurred. An equal number of randomly intermixed trials began with the IC ‘move.’ During the delay interval on these control trials, subjects simply prepared to move their hand in a non-meaningful fashion for ∼2 s. Subjects were encouraged not to simply repeat the exact same movement on each trial, but were otherwise unconstrained. If the MC was a GO signal, they would then execute the control movement. If it was a NO-GO signal they remained stationary and waited for the next trial to begin. Subjects were required to perform gestures such that they would be recognizable to observers. In order to minimize motion artifacts, subjects were given practice keeping the upper arm stationary while executing gestures and control movements with the hand, wrist and forearm. Following a GO, the designated action was repeated once before the hand was returned to the starting point in preparation for the next trial. Gestures were visually monitored via closed circuit television to ensure compliance throughout each study.
Magnetic Resonance Imaging
Imaging was performed with a General Electric Horizon whole-body 1.5 T MRI scanner using a standard birdcage head coil. Head movements were minimized by the use of a therma-foam pillow and padding. Prior to each functional run, four images were acquired and discarded to allow for longitudinal magnetization to approach equilibrium. Within each functional run an ultrafast echo planar gradient echo imaging sequence sensitive to blood-oxygenation-level-dependent (BOLD) contrast was used to acquire 25 slices per TR (4.5 mm thickness, 1 mm gap, in-plane resolution = 3.125 × 3.125 mm). The following parameters were used: TR = 2500 ms, TE = 35 ms, flip angle = 90°. A high-resolution, T1-weighted, axial fast spin echo sequence was used to acquire 25 contiguous slices (4.5 mm slice thickness with 1. 0 mm gap) coplanar to BOLD images: TE = min full, TR = 650 ms, echo train = 2, FOV = 24 cm. High resolution (0.94 × 0.94 × 1.2mm), whole-brain, T1-weighted structural images were also acquired using a standard GE SPGR 3-D sequence.
Image Processing
Structural and functional images were preprocessed and analyzed using SPM99 (http://www.fil.ion.ucl.ac.uk/spm). Functional data for each individual subject were corrected for differences in time of slice acquisition, and head motion. Functional and structural images were coregistered and transformed into a standardized, stereotaxic space. This resulted in 25 axial slices of isotropic, 3.125 mm3 voxels. Data were smoothed with an 8 mm FWHM, isotropic Gaussian kernel. Data were modeled as variable duration (7 or 9 s) events time-locked to the onset of the IC, using the appropriate duration boxcar convolved with the canonical hemodynamic response function in SPM99.
Group Analyses
Results of fixed effects analyses at the level of individual subjects were submitted to second-level random effects analyses with subjects as the random factor. Statistical parametric maps were constructed based on differences between trial types using a t-statistic. Clusters (K) consisting of at least eight voxels, separated by a minimum of 8 mm and having t-values of ≥2.57 (P < 0.01) were considered statistically significant. Corrections for multiple comparisons were not performed given the a priori hypotheses concerning a small number of anatomically defined regions of interest as discussed above. Results were converted to the standardized coordinate system of the Talaraich Atlas (Talairach and Tournoux, 1988) using a nonlinear transformation (http://www.mrc-cbu.cam.ac.uk/Imaging/mnispace.html), and displayed on the group mean hi-resolution T1-weighted structural image after normalization. Surface renderings were created using MRICRO software: (http://www.cla.sc.edu/psyc/faculty/rorden/render.html). Matlab 6.0 (The Mathworks, Natick, MA) was used to perform inclusive masking in order to compare results across experiments.
Region of Interest Analyses
The locations of peak activations in left frontal, parietal and temporal cortices were identified as regions of interest (ROIs) from the statistical parametric map resulting from the random effects comparison of TOOL-NOGO versus CONTROL-NOGO conditions, P < 0.01, uncorrected for multiple comparisons, K ≥ 10, minimum separation 8 mm. For each subject, BOLD response data from IC onset to 10 s (4 TRs) post-IC were extracted from all voxels located within 8 mm radius spheres centered on peak locations using the ROI Toolbox v1.7 (http://sourceforge.net/projects/spm-toolbox) and Matlab 6.0. Values ± 2 SD from the mean of each condition were considered outliers and eliminated. Repeated measures ANOVAs were then performed on individual subjects' time-averaged data, pooled across all voxels within a given ROI, with session as the random variable.
Individual Analyses
Locations of posterior parietal cortex activations in individual subjects were determined by overlaying co-registered statistical parametric maps (P < 0.001, K ≥ 10) on each subject's high resolution, T1-weighted anatomical scan and cross checking with an anatomical atlas (Duvernoy, 1991).
Results and Discussion
Gesture Planning
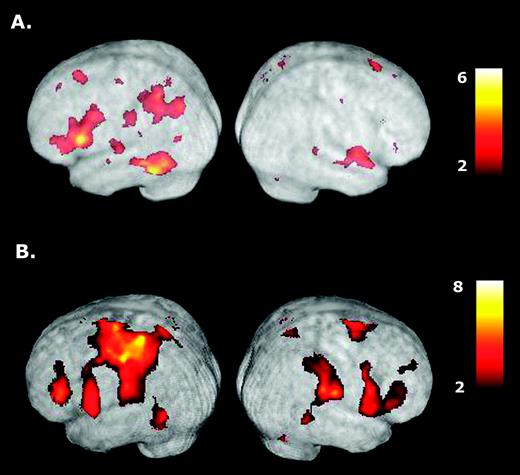
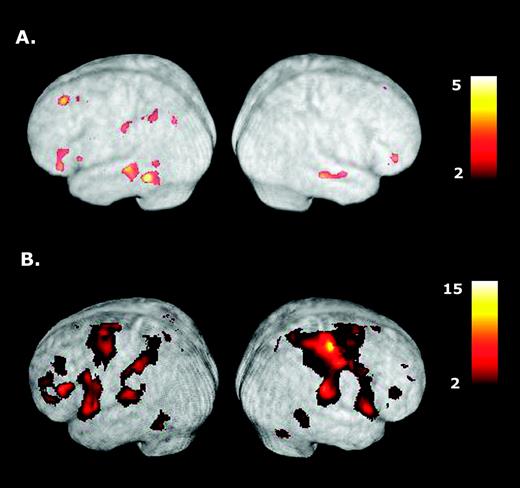
Of primary interest is identifying areas activated during the delay interval when subjects are planning a tool use gesture that is then aborted (TOOL-NOGO) versus preparing a random, non-meaningful, limb movement (CONTROL-NOGO). As shown in Figure 2A, group data indicates that conceptualizing tool use gestures primarily activates a subset of regions within the left hemisphere, most notably: (i) posterior parietal cortex within the IPS and extending ventrally into SMG, ANG and ventral SPL; (ii) posterior temporal cortex within the STS and extending ventrally into MTG and inferior temporal gyrus (ITG); (iii) inferior-middle frontal cortex; and, unexpectedly, (iv) dorsolateral prefrontal cortex (DLFPC) (see Table 1). By contrast, significant activations are absent in posterior right parietal and frontal cortices, although two small clusters in posterior STS and anterior STG did reach significance.
Activations associated with planning and executing right hand tool use gestures. (A) When compared with preparing random hand movements (CONTROL-NOGO condition), planning tool use gestures for the right hand (TOOL-NOGO) is associated with major activations in posterior parietal cortex, posterior temporal, inferior-middle frontal cortices and DLFPC all within the left cerebral hemisphere. (B) Gesture execution involves similar regions as well as a number of other cortical and subcortical structures associated with sensory and motor processes in both hemispheres. Note the strong activation present in contralateral left sensorimotor cortex. See text for details.
Cortical regions showing greater activation during planning of tool use gestures (TOOL-NOGO) versus preparation of control movements (CONTROL-NOGO) for the right hand (experiment 1)
| Cluster size (voxels) | t-value | Uncorrected P-value | Talairach coordinates | Areas within cluster | ||||||||
|---|---|---|---|---|---|---|---|---|---|---|---|---|
| x | y | z | ||||||||||
| Left hemisphere | ||||||||||||
| 1090 | 6.35 | <0.001 | −48 | −49 | −11 | Post. STS/MTG/ITG | ||||||
| 1151 | 5.05 | <0.001 | −38 | −52 | 56 | SMG/ANG/IPS | ||||||
| 1759 | 7.22 | <0.001 | −50 | 16 | 10 | BA 44/45/inf. BA 6/GFm | ||||||
| 284 | 3.49 | 0.002 | −50 | −29 | 33 | Ant. SMG | ||||||
| 119 | 3.7 | 0.002 | −58 | −23 | 10 | STG/STS | ||||||
| 174 | 4.11 | 0.001 | −10 | 30 | 51 | Sup. frontal gyrus | ||||||
| 51 | 3.77 | 0.001 | −10 | −41 | −3 | Parahippocampal gyrus | ||||||
| 40 | 3.36 | 0.003 | −33 | −13 | −18 | Fusiform gyrus/ITG | ||||||
| 27 | 2.94 | 0.006 | −38 | −8 | 0 | Insula | ||||||
| 23 | 3.74 | 0.001 | −46 | −73 | 20 | Middle occipital gyrus | ||||||
| 26 | 2.88 | 0.007 | −26 | −11 | 60 | Sup. frontal gyrus | ||||||
| 27 | 2.94 | 0.006 | −38 | −8 | 0 | Insula | ||||||
| 18 | 3.04 | 0.005 | −12 | 44 | 38 | Sup. frontal gyrus | ||||||
| 9 | 3.02 | 0.005 | −61 | −10 | −3 | Ant. STS | ||||||
| 9 | 2.88 | 0.007 | −62 | −28 | 35 | Ant. SMG (BA 40) | ||||||
| 6 | 2.95 | 0.006 | −48 | −38 | 20 | STG | ||||||
| 5 | 2.86 | 0.007 | −34 | −14 | 34 | GFm | ||||||
| 5 | 2.85 | 0.007 | −26 | −29 | 46 | Postcentral gyrus | ||||||
| 6 | 2.95 | 0.006 | −48 | −38 | 20 | STG | ||||||
| Right hemisphere | ||||||||||||
| 542 | 4.58 | <0.001 | 48 | 0 | −3 | Ant. STG/STS | ||||||
| 200 | 3.93 | 0.001 | 22 | −55 | −20 | Fusiform/ITG | ||||||
| 58 | 4.06 | 0.001 | 28 | 1 | −10 | MTG | ||||||
| 29 | 3.1 | 0.005 | 48 | −39 | 6 | STS | ||||||
| 23 | 3.49 | 0.002 | 38 | −3 | 11 | Insula | ||||||
| 12 | 3.28 | 0.003 | 54 | 31 | 2 | BA45/47 | ||||||
| 9 | 2.98 | 0.006 | 38 | −11 | 47 | Postcentral gyrus | ||||||
Bold indicates peaks within regions of interest whose hemodynamic responses are plotted below (see text for details).
On the basis of earlier findings discussed above, repeated measures ANOVAs were used to analyze data extracted from 8 mm radius spheres centered on the peak regions of activation within left posterior parietal, frontal and temporal cortices. Instructional cue (TOOL versus CONTROL) and MC (GO versus NOGO) were fixed factors. The main purpose of these ROI analyses was to ensure that the differences between experimental and control conditions reflected in the statistical parametric maps result from differences in relative BOLD activations, as opposed to deactivations.
Posterior Temporal Cortex
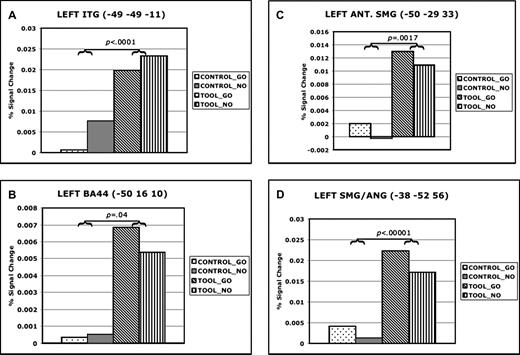
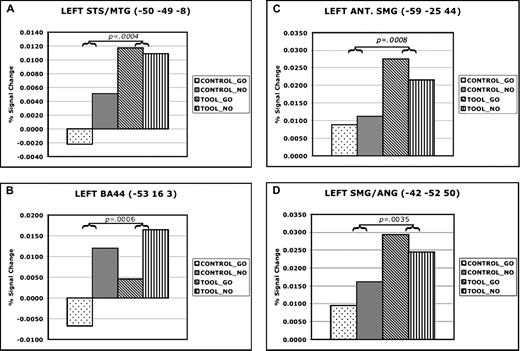
Activations in left posterior temporal cortex were observed within and adjacent to the STS with a peak in posterior MTG (−49, −49, 11; Fig. 2A). Figure 3a illustrates that IC had a main effect on responses in this region, F(1,12) = 278.0538, P < 0.0001, MSE < 0.00001. Neither the main effect of MC nor the IC × MC interaction had a significant effect, P > 0.05 in both cases. Also, responses in the conditions involving tools were unaffected by the identity of the MC, P = 0.30.
Percent signal change at locations of peak activity in temporal, frontal, and parietal areas during right hand gesture planning. Panels illustrate percent signal change for each condition in data extracted from the locations of peak activity in left posterior temporal (A), inferior frontal (B), anterior SMG (C) and posterior SMG–ANG (D). Data are averaged over a 10 s (4TR) epoch time-locked to the IC onset (see Method for details).
Activation of this area is consistent with a previous study of tool use gesture planning (Choi et al., 2001). As detailed above, activations in this region are also observed in tasks that involve observing or identifying tools and/or the actions with which they are associated (Martin et al., 1995, 1996; Chao et al., 1999; Damasio et al., 2001; Kellenbach et al., 2003), and damage here is associated with category-specific deficits in action naming (Tranel et al., 1997, 2003). Observation of this region in the present task is consistent with these results in that processing the identity of stimuli and accessing the knowledge concerning associated actions is a key component of planning tool use actions.
Frontal Cortex
Peak frontal activation was centered in left inferior frontal gyrus, specifically in pars opercularis (−50, 16, 10), and extended dorsally into the GFm and rostrally into pars triangularis (Amunts et al., 1999). As shown in Figure 3b, here too there was a greater response when subjects were instructed to prepare a tool use gesture versus a control movement, F(1,12) = 5.3052, P = 0.04, MSE = 0.0001. Main effects of MC and interactions between IC and MC were not significant (P > 0.05), and responses were again unaffected by whether or not a planned tool use gesture was subsequently executed, P = 0.60.
In addition to this peak in inferior frontal cortex, we also observed activations in ventral premotor cortex (inferior precentral gyrus), and to a lesser extent within inferior GFm. Previous studies of tool use gesture planning observed activations in GFm, but not more inferior regions of frontal cortex (Moll et al., 2000; Choi et al., 2001). As detailed earlier, left unilateral activation of all three of these frontal regions has been demonstrated during perceptual and semantic tasks involving tools (Martin et al., 1995, 1996; Grabowski et al., 1998; Chao and Martin, 2000; Damasio et al., 2001; Kellenbach et al., 2003). Involvement of these regions could reflect activation of motor representations pertaining to the manipulation of tools (Chao and Martin, 2000), as this region is also active during object grasping and manipulation (Binkofski et al., 1999a,b; Ehrsson et al., 2001).
In contrast to earlier studies (Moll et al., 2000; Choi et al., 2001), we did not detect significant activations in dorsal premotor areas. One small and unexpected activation in left DLFPC was, however, detected. A similar area has been noted in some subjects during gesture planning (Moll et al., 2000), and previous studies have identified this region as being involved in semantic working memory (Gabrieli et al., 1998; Poldrack et al., 1999; Wagner et al., 2001). As suggested by an anonymous reviewer, it seems reasonable that left DLFPC could therefore be involved in accessing, maintaining and/or manipulating representations of tool use actions that are stored in posterior temporal, inferior frontal and/or posterior parietal cortices. This is particularly crucial in the context of this delayed response task.
Posterior Parietal Cortex
Two large clusters were observed in left posterior parietal cortex along the IPS. The more anterior of these was located in the SMG along the ventral bank of the IPS (−50, −29, 33). As illustrated in Figure 3c, this region showed a greater response on trials where the IC was a tool, F(1,12) = 89.7667, P < 0.00001, MSE = 0.00001. Both the main effect of MC and the interaction between IC and MC were not significant, P > 0.05 in both cases. Likewise, a post-hoc comparison failed to detect any difference between conditions where tool use gestures were merely planned (TOOL-NOGO) versus planned and executed (TOOL-GO), P = 0.40.
The anterior SMG site is generally consistent with results of tasks involving tool observation and/or action semantic processing (Martin et al., 1995, 1996; Chao and Martin, 2000; Okada et al., 2000), processing spatial relations between objects (Damasio et al., 2001) or gesture planning (Moll et al., 2000). As will be discussed in detail below, this area is in the vicinity of a region associated with visually guided prehension and/or manipulation of objects (Binkofski et al., 1998, 1999a,b; Chao and Martin, 2000; Jancke et al., 2001; Shikata et al., 2001; Grefkes et al., 2002; Culham et al., 2003). Thus, its activation during conceptualization of tool use actions could reflect retrieval of stored attributes associated with grasping and manipulating tools (Chao and Martin, 2000), and/or the explicit retrieval of knowledge of tool use actions (Kellenbach et al., 2003).
Figure 3d shows a similar main effect of IC in the more posterior site, situated in the ventral bank of the IPS at the boundary of SMG and ANG (−38, −52, 56), F(1,12) = 16.1049, P = 0.0017, MSE = 0.0001. Again, neither the main effect of MC nor the IC × MC interaction reached significance, P > 0.05 in both cases. There was again no effect of whether prepared tool use gestures were subsequently executed or aborted, P = 0.37. Previously, activation in this more caudal region of the IPL has been observed during the planning of tool use gestures (Moll et al., 2000). As argued below in the comparison of results from experiments 1 and 2, this more caudal region appears to be activated exclusively in tasks involving explicit planning of actions. We therefore hypothesize that it is involved in representing motor programs for acquired tool use skills. This is consistent with results of lesion location studies in IM patients that show greatest overlap in posterior SMG and ANG (Haaland et al., 2000).
Individual Differences in Posterior Parietal Cortex
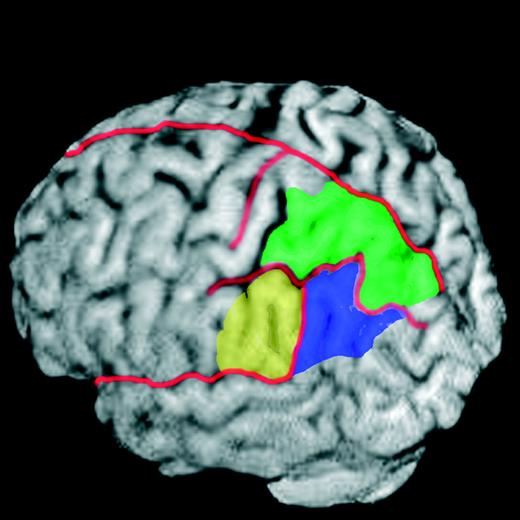
Figure 4 illustrates the relative locations of SMG, ANG, and SPL in left posterior parietal cortex on a 3-D surface rendering of a single subject's high-resolution, T1-weighted, structural MRI. These regions were identified manually in each individual in order to localize peak activation(s) in left and/or right posterior parietal cortices (Table 2). Subjects can be grouped into three categories depending on the laterality of these activations. Only one subject did not show involvement of the left posterior parietal cortex. Instead, this individual had a significant activation of the right ANG. The majority of subjects (53.8%) had left unilateral posterior parietal cortex activity. Five out of 13 (38.5%) subjects showed some degree of bilateral posterior parietal cortex activity. In all bilateral cases, however, clusters were larger in the left posterior parietal cortex. Across all subjects, left posterior parietal cortex activations were most common in SMG (84.6%), followed by SPL (46.2%) then ANG (15.3%). For those cases with right posterior parietal cortex activation, ANG (30.7%) was most frequent, followed by both SMG (23.1%) and SPL (23.1%).
Major anatomical divisions of posterior parietal cortex in an individual subject. For purposes of localizing activations in individual subjects, boundaries between SPL (green), SMG (yellow) and ANG (purple) were determined on the basis of anatomical landmarks in each subjects' high-resolution, T1-weighted, anatomical MRI scan. This is necessary due to often substantial variations in cortical topography amongst subjects. Placement of borders between parietal and temporal and occipital lobes was based on Duvernoy (1991). Major sulci are drawn in red.
Locations of posterior parietal activations in individual subjects during planning of tool use gestures for execution with the right hand
| Subject | Left hemisphere | Right hemisphere | ||||||||||||||||||||||||||||
|---|---|---|---|---|---|---|---|---|---|---|---|---|---|---|---|---|---|---|---|---|---|---|---|---|---|---|---|---|---|---|
| Talairach coordinates | t-value | K | SMG | ANG | SPL | Talairach coordinates | t-value | K | SMG | ANG | SPL | |||||||||||||||||||
| x | y | z | x | y | z | |||||||||||||||||||||||||
| 1 | −22 | −70 | 57 | 5.3 | 1849 | * | – | * | ||||||||||||||||||||||
| 2 | −49 | −52 | 50 | 6.72 | 16874 | * | * | * | – | * | * | |||||||||||||||||||
| 3 | −48 | −34 | −50 | 3.42 | 55 | * | – | – | ||||||||||||||||||||||
| 4 | −16 | −46 | 36 | 3.93 | 1264 | * | – | * | ||||||||||||||||||||||
| 5 | 54 | −63 | 31 | 3.39 | 185 | – | * | - | ||||||||||||||||||||||
| 6 | −46 | −50 | 47 | 3.37 | 652 | * | – | – | ||||||||||||||||||||||
| −69 | −26 | 29 | 3.59 | 28 | * | – | – | |||||||||||||||||||||||
| 7 | −38 | −49 | 39 | 4.3 | 239 | * | – | * | 36 | −62 | 47 | 3.40 | 16 | – | – | * | ||||||||||||||
| 8 | −47 | −22 | 47 | 3.01 | 146 | * | – | – | ||||||||||||||||||||||
| 9 | −36 | −51 | 63 | 8.7 | 23903 | 22 | −63 | 46 | – | – | * | |||||||||||||||||||
| 10 | −34 | −38 | 52 | 5.37 | 3777 | * | – | * | ||||||||||||||||||||||
| 11 | −53 | −31 | 38 | 6.4 | 1686 | * | – | – | 57 | −62 | 38 | 5.62 | 473 | * | * | - | ||||||||||||||
| 12 | −26 | −70 | 53 | 5.97 | 918 | * | * | * | 44 | −63 | 51 | 4.17 | 191 | * | * | - | ||||||||||||||
| 13 | −36 | −32 | 46 | 3.89 | 202 | * | – | – | 46 | −34 | 46 | 3.47 | 34 | * | – | - | ||||||||||||||
| Frequency (%) | 84.6 | 15.3 | 46.2 | 23.0 | 30.7 | 23.1 | ||||||||||||||||||||||||
All activations were significant at P < 0.01, uncorrected for multiple comparisons. Standardized coordinates indicate locations of peak activations. Asterisks indicate whether activations were found in supramarginal gyrus (SMG), angular gyrus (ANG) and/or the superior parietal lobule (SPL). K = number of voxels per cluster. Note that a given subject may have multiple clusters. See text for details.
The fact that left SMG was the most frequently activated region amongst subjects is consistent with the hypothesis that this region plays a key role in representing memories for skilled praxis (Heilman et al., 1982). Yet, nearly half of the subjects displayed left SPL activations, which have been reported previously in association with tool use planning (Choi et al., 2001), and are known to also be involved in the on-line control of reaching (Grafton et al., 1996). The existence of a single subject with right hemisphere representations mirrors the relatively infrequent reports in the literature of crossed apraxia in right-handers, in which bimanual praxis deficits follow right unilateral lesions (Marchetti and Della Sala, 1997; Raymer et al., 1999). Although, as noted in experiment 2, this subject shows bilateral parietal activity for left hand gesture preparation. These individual differences in the location(s) of posterior parietal cortex involvement may contribute to variation in the consequences of parietal damage for skilled praxis (Basso et al., 1980; Haaland et al., 2000; Kertesz and Ferro, 1984). In contrast to frontal lesions, there appears to be considerably more variability in the locations of maximal lesion overlap amongst parietal-damaged apraxics (Haaland et al., 2000).
Gesture Execution
Areas active during gesture execution were isolated by contrasting results of the TOOL-GO versus the TOOL-NOGO conditions (Fig. 1). Figure 2B shows that with the notable exception of left DLFPC, the general regions associated with planning are also active during gesture execution. This includes not only left posterior parietal and inferior-middle frontal regions implicated in sensorimotor transformations during limb movements, but also left posterior temporal cortex. Activation of this later region indicates that the influence of ventral stream representations of tools and/or knowledge of associated actions are also involved during the execution of tool use gestures.
Of course, these areas are in addition to a variety of cortical and subcortical (cerebellum, basal ganglia) structures known to be involved in praxis (Imamizu et al., 2000, 2003; Moll et al., 2000; Choi et al., 2001), and/or the representation of acquired motor sequences (Grafton et al., 1998; Keele et al., 2003), including: sensorimotor, dorsal and ventral premotor, supplementary motor, posterior parietal, posterior temporal, and ventral prefrontal cortices (Table 3). With the exception of contralateral activation in primary sensory motor areas, the bilateral nature of these activations is the most striking difference between activations associated with gesture execution versus planning. A more detailed analysis and discussion of the precise relationship between areas involved in these processes follows experiment 2.
Cortical regions showing greater activation during preparation and execution of tool use (TOOL-GO) gestures versus preparation (TOOL-NOGO) for the right hand (experiment 1)
| Cluster size (voxels) | t-value | Uncorrected P-value | Talairach coordinates | Areas within cluster | ||||||||
|---|---|---|---|---|---|---|---|---|---|---|---|---|
| x | y | z | ||||||||||
| Left hemisphere | ||||||||||||
| 37 607 | 8.13 | <0.0001 | −36 | −29 | 40 | M1/SMA/ant. SMG/postcentral gyrus/GFi/GFm | ||||||
| 161 | 4.66 | <0.0001 | −51 | −62 | 1.4 | MTG/ITG | ||||||
| Right hemisphere | ||||||||||||
| 1160 | 6.05 | <0.0001 | 63 | −26 | 25 | Postcentral gyrus (BA 2)/ant. SMG/GFi/GFm | ||||||
| 96 | 5.26 | <0.0001 | 32 | −46 | 8 | MTG/STG | ||||||
| 25 | 3.98 | 0.001 | 46 | −13 | −20 | ITG/fusiform gyrus | ||||||
| 44 | 3.82 | 0.001 | 59 | −54 | 0 | MTG/ITG | ||||||
| 198 | 3.63 | 0.002 | 51 | 25 | 1 | MTG/STS/STG | ||||||
Experiment 2: Planning and Executing Tool Use Gestures: Left Hand
A limitation of the initial experiment is that subjects always planned and executed gestures with their dominant right hands. Although this is the natural way for these subjects to perform unimanual tool use skills, it raises at least two alternative explanations of the left-lateralized activations we report in association with planning tool use actions. On the one hand, they may indeed reflect a left hemisphere specialization for the representation of tool use skills for either limb (Johnson-Frey et al., 2004a). This is predicted by the association of left hemisphere lesions with IM manifest in both upper limbs. It is also consistent with results of functional neuroimaging studies that consistently show left unilateral activations during perceptual and semantic tasks (Johnson-Frey, 2004). Alternatively, it is also possible that, at least in part, tool use skills are represented bilaterally, with each hemisphere supporting acquired motor plans for tool use actions involving the contralateral limb.
To disambiguate these interpretations, we undertook a second experiment in which subjects performed the same task, but using their non-dominant left hands. We reasoned that if components within the left lateralized network detailed above are specialized for planning (i.e. recognition of tools, determination of associated actions and retrieval of motor plans for skills) at a limb-independent level, then requiring subjects to prepare tool use gestures for execution with the left hand should have no effect on the observed cerebral asymmetry. However, to the extent that skill representations are bilaterally organized, preparing gestures for the left hand might be associated with a shift in one or more of these components to homotopic areas within the right cerebral hemisphere, i.e. right inferior-middle frontal, posterior parietal and posterior temporal cortices, and DLFPC.
Eleven healthy adults (seven females, four males) participated in experiment 2. All were right hand dominant according to the Edinburgh Handedness Inventory (Oldfield, 1971) and had no history of psychiatric or neurological illness. Except that tool use skills were planned and/or executed with the left limb, all other aspects of the method were identical to experiment 1. Subjects 1–8 (Tables 2 and 5) also participated in the previous experiment.
Results and Discussion
Action Planning
Consistent with the hypothesized left hemisphere specialization for planning tool use actions independent of the limb involved, contrasting TOOL-NOGO versus CONTROL-NOGO conditions yielded results highly consistent with those of experiment 1 (Table 4). Figure 5A shows two separate clusters located within the IPL, one in anterior SMG and the other at the posterior boundary of SMG and ANG. Likewise, left inferior frontal and ventral premotor regions were again significantly activated during gesture planning. Conspicuously absent, however, is activation of left GFm. This is surprising given that damage to this area is associated with bilateral apraxic deficits (Haaland et al., 2000). This difference between results of experiments 1 and 2 suggests that GFm may contribute more heavily to conceptualizing tool use actions that involve the dominant right limb. There was also an unanticipated activation in right inferior frontal cortex (BA45) that was not present when planning tool use gestures for the right hand (experiment 1). Tentatively, this may reflect activation of a contralaterally organized premotor hand representation. The presence of bilateral activity in this region when planning gestures involving the right hand implies that there may be separate representations in inferior frontal cortex related to tool use skills: one that is left lateralized regardless of the limb involved and another that is contralateral to the involved effector.
Activations associated with planning and executing left hand tool use gestures. (A) Consistent with the results of experiment 1, planning tool use gestures for the left hand (TOOL-NOGO versus CONTROL-NOGO comparison) is associated with major activations in left posterior temporal, inferior frontal and posterior parietal cortices, as well as DLFPC. (B) Gesture execution involves similar regions as well as a number of cortical and subcortical structures in both the right and left cerebral hemispheres. Note the strong contralateral activation in right sensorimotor cortex when gestures are planned for execution with the left hand. See text for details.
Cortical regions showing greater activation during planning of tool use gestures (TOOL-NOGO) versus planning of control movements (CONTROL-NOGO) for the left hand (experiment 2)
| Cluster size (voxels) | t-value | Uncorrected P-value | Talairach coordinates | Areas within cluster | ||||
|---|---|---|---|---|---|---|---|---|
| x | y | z | ||||||
| Left hemisphere | ||||||||
| 220 | 5.65 | <0.001 | −50 | −49 | −8 | Post. STS/MTG | ||
| 225 | 4.12 | 0.001 | −44 | 34 | −12 | Inferior frontal gyrus(BA 47) | ||
| 179 | 4.64 | <0.001 | −59 | −33 | 5 | Post. STS | ||
| 69 | 4.82 | <0.001 | −12 | 41 | 37 | Sup./dorsal frontal gyrus | ||
| 58 | 3.21 | 0.005 | −42 | −52 | 50 | Post. SMG/ANG/IPS | ||
| 50 | 3.68 | 0.002 | −42 | −2 | −2 | STG | ||
| 46 | 3.7 | 0.002 | −59 | −25 | 44 | Ant. SMG | ||
| 22 | 4.03 | 0.001 | −34 | −70 | 46 | |||
| 20 | 4.19 | 0.001 | −53 | 16 | 3 | Inferior frontal gyrus (BA 44) | ||
| 16 | 2.95 | 0.007 | −24 | 26 | 48 | GFM (BA 8) | ||
| 8 | 3.06 | 0.006 | −30 | −42 | 45 | BA 7/IPS/BA 40 | ||
| Right hemisphere | ||||||||
| 128 | 4.44 | 0.001 | 61 | −29 | −4 | Ant. MTG/STS | ||
| 46 | 4.01 | 0.001 | 42 | 42 | −5 | GFm (BA 10/46) | ||
Bold indicates peaks within regions of interest whose hemodynamic responses are plotted below (see text for details).
Consistent with experiment 1, there was again a highly focal activation in left DLFPC that could reflect contributions of semantic working memory (Gabrieli et al., 1998; Poldrack et al., 1999; Wagner et al., 2001). Likewise, left posterior temporal cortex in and adjacent to the posterior STS, including STG and MTG was also activated.
As in experiment 1, data were again extracted from 8 mm radius spheres centered on regions of peak activation within left parietal, frontal and temporal cortices. These data were scrutinized further within a repeated measures ANOVA with IC and MC as fixed factors.
Posterior Temporal Cortex
The peak in temporal cortex was again located in posterior MTG along the STS (−50, −49, 8). Figure 6a shows that responses in this region were greater in conditions involving tool ICs [F(1,10) = 26.6068, P = 0.0004, MSE < 0.00001]. Responses were unaffected by whether the gesture was subsequently executed, P = 0.85. The interpretation of the interaction between IC × MC [F(1,10) = 11.3559, P = 0.0071, MSE < 0.0001] is complicated by a modest deactivation in the CONTROL-GO condition.
Percent signal change at locations of peak activity in temporal, frontal and parietal areas during left hand gesture planning. Panels show percent signal change for each condition in data extracted from regions of peak activity in left posterior temporal (A), inferior frontal (B) and posterior parietal cortices (C, D). The same procedure as described in Figure 3 was used.
As described above, previous neuroimaging (Chao et al., 1999; Damasio et al., 2001; Martin et al., 1996) and patient (Tranel et al., 1997) studies implicate this region in action specific semantic representations. Thus, activation of this region could be associated with processes involved in identifying the stimulus tool and/or the action with which it is associated.
Frontal Cortex
As in experiment 1, activation in left inferior cortex had a peak in pars opercularis (−53, 16, 3). Figure 6b shows that this area evidenced a greater response on trials where the IC named a tool, F(1,10) = 30.3253, P = 0.0003, MSE < 0.0001. In contrast to other regions, greater responses were also observed when planning gestures or control movements was followed by their execution, F(1,10) = 24.0422, P = 0.0006. Responses were greater when tool use gestures were planned and then aborted (TOOL-NOGO), t(10) = 3.3769, P = 0.007. The unanticipated IC × MC interaction [F(1,10) = 16.9495, P = 0.0021, MSE < 0.0001] is again difficult to interpret due to the relative deactivation in the CONTROL-GO condition.
As detailed earlier, these frontal areas are often observed during perceptual and semantic tasks, which has been interpreted as evidence that how tools are manipulated is part of these objects' representations (Chao and Martin, 2000). The fact that these regions are active during gesture planning is consistent with this view.
Posterior Parietal Cortex
There were again two large clusters in left IPL with peaks located along the ventral bank IPS. As evidenced by the significant main effect of IC, Figure 6c shows that the anterior SMG region (−59, −25, 44) was more responsive on trials involving tools, F(1,10) = 22.50, P = 0.0008, MSE = 0.0001. While the main effect of MC was non-significant, there was an IC × MC interaction, F(1,10) =5.6959, P = 0.0382, MSE ≤ 0.0001. This unexpected effect is difficult to interpret, however, because of the relative deactivation in the CONTROL-GO condition. A post-hoc comparison showed that responses in this region were unaffected by whether a prepared tool use gesture was subsequently executed or not, P = 0.40. Likewise, Figure 6d illustrates that in the more posterior SMG/ANG region (−42, −52, 50) there was again a greater response in conditions involving tools [F(1,10) = 14.4212, P = 0.0035, MSE = 0.0002]. The unexpected IC × MC interaction was significant, F(1,10) = 5.5900, P = 0.0397, MSE = 0.0001. Again, whether a prepared tool use gesture was executed or not had no effect, P = 0.67.
Consistent with experiment 1, the anterior SMG region may be involved in representing attributes associated with grasping and manipulating tools (Chao and Martin, 2000), as it is active during perceptual and semantic tasks involving tools (Chao and Martin, 2000; Grezes and Decety, 2001; Martin and Chao, 2001; Kellenbach et al., 2003). By contrast, the more caudal location involving posterior SMG and ANG has been detected in an earlier study involving tool use gestures (Moll et al., 2000), and therefore may be specifically involved in representing motor programs for tool use skills. Further analysis of this distinction appears below in the comparison of results from experiments 1 and 2.
Individual Differences in Posterior Parietal Cortex
All 11 individuals showed left posterior parietal cortex activation (Table 5). As in experiment 1, the majority (69.2%) had activation in left SMG, followed by SPL (46.2%), and ANG (38.5%). No one showed right unilateral posterior parietal cortex activity. A slightly higher percentage (54.5%) of subjects in the present experiment had bilateral posterior parietal cortex activations. Among these individuals, right SPL (30.8%) was most frequently activated, followed by SMG (23.1%) and lastly ANG (15.4%).
Locations of posterior parietal activations in individual subjects during planning of tool use gestures for execution with the left hand
| Subject | Left hemisphere | Right hemisphere | ||||||||||||||||||||||||||||
|---|---|---|---|---|---|---|---|---|---|---|---|---|---|---|---|---|---|---|---|---|---|---|---|---|---|---|---|---|---|---|
| Talairach coordinates | t-value | K | SMG | ANG | SPL | Talairach coordinates | t-value | K | SMG | ANG | SPL | |||||||||||||||||||
| x | y | z | x | y | z | |||||||||||||||||||||||||
| 1 | −28 | −73 | 52 | 6.02 | 185 | – | – | * | ||||||||||||||||||||||
| −32 | −45 | 37 | 4.91 | 206 | * | – | – | |||||||||||||||||||||||
| −57 | −31 | 44 | 4.56 | 199 | * | – | – | |||||||||||||||||||||||
| 2 | −50 | −58 | 43 | 6.28 | 5547 | * | * | * | 55 | −54 | 36 | 6.49 | 504 | * | * | – | ||||||||||||||
| 26 | −60 | 58 | 3.57 | 80 | – | – | * | |||||||||||||||||||||||
| 3 | −38 | 46 | 48 | 8.5 | 2650 | * | * | * | 38 | −62 | 49 | 4.71 | 458 | – | – | * | ||||||||||||||
| 4 | −48 | −64 | 31 | 3.13 | 185 | – | * | – | 34 | −46 | 34 | 3.07 | 55 | * | – | – | ||||||||||||||
| −42 | −30 | 35 | 3.30 | 319 | * | – | – | |||||||||||||||||||||||
| 5 | −34 | −56 | 43 | 3.16 | 214 | * | – | * | 46 | −60 | 45 | 3.44 | 194 | * | – | * | ||||||||||||||
| 6 | −36 | −43 | 39 | 6.02 | 384 | * | – | – | ||||||||||||||||||||||
| 7 | −48 | −35 | 44 | 4.64 | 607 | * | – | – | 20 | −50 | 50 | 3.83 | 303 | – | – | * | ||||||||||||||
| −12 | −55 | 56 | 4.29 | 201 | – | – | * | |||||||||||||||||||||||
| −12 | −35 | 42 | 4.08 | 317 | * | – | – | |||||||||||||||||||||||
| 8 | −44 | −72 | 16 | 3.06 | 78 | – | * | – | ||||||||||||||||||||||
| 9 | −46 | −31 | 38 | 5.27 | 532 | * | – | * | ||||||||||||||||||||||
| 10 | −50 | −70 | 33 | 5.18 | 285 | – | * | – | 55 | −58 | 40 | 3.36 | 19 | – | * | – | ||||||||||||||
| 11 | −57 | −33 | 33 | 2.56 | 24 | * | – | – | ||||||||||||||||||||||
| Frequency (%) | 69.2 | 38.5 | 46.2 | 23.1 | 15.4 | 30.8 | ||||||||||||||||||||||||
All activations were significant at P < 0.01, uncorrected for multiple comparisons. Standardized coordinates indicate locations of peak activations. Asterisks indicate whether activations were found in supramarginal gyrus (SMG), angular gyrus (ANG) and/or the superior parietal lobule (SPL). K = number of voxels per cluster. Note that a given subject may have multiple clusters. See text for details.
Gesture Execution
Figure 5b shows that, with the exception of contralaterally organized sensorimotor areas of parietal-frontal cortex, contrasting results of the TOOL-GO condition versus TOOL-NOGO condition yielded results similar to those observed in experiment 1. With the exception of DLFPC, the general areas within the left hemisphere active during planning are also active during execution. Moreover, activations are generally bilateral, and include a variety of cortical and subcortical (cerebellum, basal ganglia) regions involved in praxis (Choi et al., 2001; Imamizu et al., 2000, 2003; Moll et al., 2000) and/or the representation of acquired motor sequences (Grafton et al., 1998; Keele et al., 2003). These include dorsal and ventral premotor, posterior temporal, prefrontal and supplementary motor cortices (Table 6). Although also involving common regions, these largely bilateral activations contrast with the predominantly left hemisphere areas associated with gesture planning.
Cortical regions showing greater activation during preparation and execution of tool use (TOOL-GO) gestures versus preparation (TOOL-NOGO) for the left hand (experiment 2)
| Cluster size (voxels) | t-value | Uncorrected P-value | Talairach coordinates | Areas within cluster | ||||
|---|---|---|---|---|---|---|---|---|
| x | y | z | ||||||
| Left hemisphere | ||||||||
| 371 | 9.74 | <0.0001 | −44 | 37 | 9 | GFi (BA 45/46) | ||
| 1048 | 7.6 | <0.0001 | −40 | −31 | 33 | Ant. SMG/postcentral gyrus (BA 2)/M1 | ||
| 14 | 5.51 | <0.0001 | −4 | −43 | −40 | bs | ||
| 26 | 5.11 | <0.0001 | −44 | −37 | −15 | Gti/fusiform | ||
| 113 | 4.98 | <0.0001 | −30 | 53 | 8 | GFm (BA 46)/GFs(BA 10) | ||
| 29 | 4.81 | <0.0001 | 64 | −52 | 5 | GTm | ||
| 195 | 4.79 | <0.0001 | −8 | −66 | 48 | Precuneus (BA 7) | ||
| 54 | 4.79 | <0.0001 | −44 | 49 | −1 | GFm (BA 10)/GFi (BA 47) | ||
| 51 | 4.49 | 0.001 | −51 | −61 | −9 | ITG | ||
| 26 | 3.62 | 0.003 | −32 | 42 | 33 | GFs(BA 9) | ||
| 10 | 3.01 | 0.007 | −30 | 46 | 22 | GFs(BA 10) | ||
| Right hemisphere | ||||||||
| 28034 | 16.84 | <0.0001 | 39 | −18 | 62 | M1/SMA/postcentral gyrus (BA 2)/ant. SMG | ||
| 50 | 3.76 | 0.002 | 44 | 37 | 6 | GFi (BA 45/46) | ||
Lastly, both action planning and execution with the non-dominant hand were associated with higher percent signal change and therefore greater maximal values of the t-statistic (cf. Figs 2 and 5). Previous work has demonstrated non-symmetrical patterns of activity in association with movements of the dominant versus non-dominant limbs (Dassonville et al., 1997). The present differences could also reflect subjects finding it more demanding to plan and/or execute tool use actions with their non-dominant limbs.
Common Activations across Experiments 1 and 2
The previous section discussed similarities in the patterns of activations associated with planning versus executing gestures with the right or left hands. In order to identify those regions precisely, and to provide a coherent framework for discussing the main findings, the results of experiment 2 were inclusively masked with those of experiment 1. This allowed us to specify which particular voxels are activated significantly in both studies in association with gesture planning, gesture execution, or both processes.
Gesture Planning
As illustrated in red in Figure 7, there is considerable overlap between areas activated significantly when planning tool use gestures (TOOL-NOGO) versus control movements (CONTROL-NOGO) for both the right (experiment 1) and left (experiment 2) hands (see Table 7). With the sole exception of a small area in the right STS, all limb-independent regions are located in the left cerebral hemisphere.
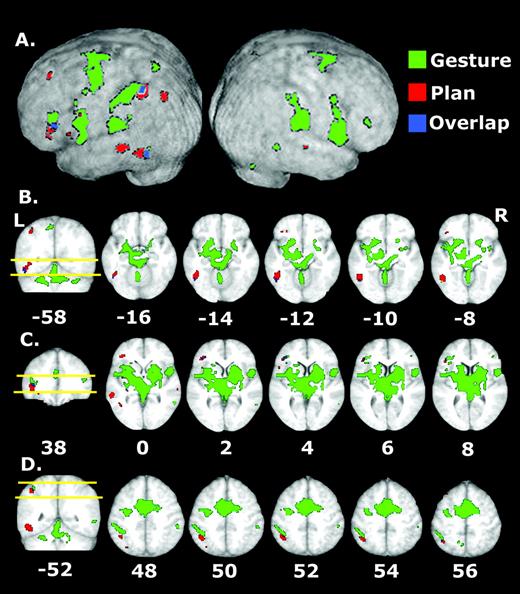
Areas activated when planning and/or executing tool use gestures with the right (experiment 1) and left (experiment 2) hands. Green areas were significantly activated (P < 0.01, K ≥ 10 voxels in both experiments 1 and 2) when executing tool use gestures the right and left hands (TOOL-GO, TOOL-NOGO). Red areas were activated when planning tool use gestures for both the right and left hands (TOOL-NOGO, CONTROL-NOGO). Blue areas were activated when planning and executing tool use gestures with the left and right hands. While bilateral regions of frontal, parietal and temporal cortex are all involved in gesture execution, planning is associated primarily with activations in the left cerebral hemisphere (A). There is both segregation and some degree of overlap amongst regions in left inferior frontal, inferior parietal and posterior temporal cortex that contribute to planning and execution of tool use gestures. Left DLFPC and right STS activity is only observed during gesture planning. Yellow lines on coronal slices (left) indicate dorso-ventral locations (z) of axial slices through key regions contributing to gesture planning and/or execution: posterior temporal cortex (B), inferior frontal cortex (C) and posterior parietal cortex (D). Numbers below coronal slices indicate slice positions along the rostro-caudal (y) axis and those beneath axial slices indicate slice positions along the dorso-ventral (z) axis.
Standardized coordinates of centroids of clusters activated during gesture planning (TOOL-NOGO, CONTROL-NOGO) for both the right (experiment 1) and left (experiment 2) hands
| Talairach coordinates | Areas within cluster | ||||
|---|---|---|---|---|---|
| x | y | z | |||
| Left hemisphere | |||||
| Parietal | |||||
| −42 | −51 | 50 | SMG (BA40)/Ventral bank IPS | ||
| −32 | −69 | 44 | SMG/ANG | ||
| Frontal | |||||
| −42 | 35 | 1 | Inf. frontal gyrus (BA 46/47) | ||
| −39 | 34 | −11 | Inf. frontal gyrus (BA 47) | ||
| −30 | 35 | −12 | Inf. frontal gyrus (BA 47) | ||
| −50 | 7 | 24 | Inf. frontal gyrus (BA 44) | ||
| −10 | 44 | 38 | Sup. frontal gyrus (BA 9) | ||
| −42 | 36 | 1 | Inf. frontal gyrus (BA 45) | ||
| −51 | 19 | 3 | Inf. frontal gyrus (BA 45) | ||
| Temporal | |||||
| −49 | −53 | −6 | Post. STG/MTG/ITG/fusiform | ||
| −59 | −36 | 1 | Post. MTG/STS/STG | ||
| −32 | −29 | 1 | Medial MTG/STS | ||
| Other | |||||
| −40 | −3 | 0 | Insula | ||
| Right hemisphere | |||||
| 65 | −25 | 1 | Ant. STS(BA 22) | ||
| 27 | 2 | 10 | Putamen | ||
Included voxels exceeded an uncorrected cutoff of P < 0.01 in random effects analyses of both experiments (see Method section).
Posterior Temporal Cortex
In left posterior temporal cortex a large area of overlap extends from the MTG ventrally into the inferior temporal gyrus. Immediately dorsal are two smaller clusters in the STS extending superiorly into the STG. Previously it has been demonstrated that left posterior temporal cortex is activated in a variety of tasks involving tools that do not explicity demand action planning or production, including naming (Martin et al., 1996) or observing tools (Chao et al., 1999), generating action words (Martin et al., 1995), and performing action (Kellenbach et al., 2003) or spatial (Damasio et al., 2001) judgements. Lesions in this region are associated with action specific semantic impairments (Tranel et al., 1997, 2003). Together, these findings suggest an important role for left posterior temporal areas (STS/MTG/STG) in representing semantic information concerning tools and associtated actions (Martin et al., 1995, 1996; Chao et al., 1999; Damasio et al., 2001; Kellenbach et al., 2003). In the present task, this region may be primarily involved in identifying the stimulus tool and determining the action with which it is associated. Only a small portion of this region was active exclusively during gesture production (Fig. 7, green), a more substantial area remained active during both planning and execution (Fig. 7, blue).
Frontal Cortex
Limb-independent conceptual processing involved three distinct frontal regions in the left hemisphere: inferior frontal, ventral premotor cortices and DLPFC. As detailed earlier, these regions are also active during a variety of perceptual and semantic tasks involving tools (Martin et al., 1995, 1996; Grafton et al., 1997; Grabowski et al., 1998; Chao and Martin, 2000; Kellenbach et al., 2003), and may represent attributes associated with the manipulation of these objects (Chao and Martin, 2000). On the basis of similarities in cytoarchitecture and functionality, pars opercularis — the site of peak inferior frontal activations in both experiments — is a likely homologue of area F5 in macaques (Petrides and Pandya, 1984; Preuss et al., 1996). Area F5 is a major recipient of afferent projections from the IPL (AIP, PF, PFG; Godschalk et al., 1984; Petrides and Pandya, 1984; Preuss et al., 1996; Luppino et al., 1999), and appears to support a ‘vocabulary of hand actions’, or ‘motor prototypes’ underlying specific acts involved in grasping and manipulating objects (Rizzolatti et al., 1988). Human inferior frontal cortex displays similar properties (Binkofski et al., 1999a,b; Ehrsson et al., 2000, 2001; Johnson-Frey, 2003b). The similarity between these and the current results suggests that both object prehension and tool use skills might be composed from this same set of stored motor primitives (Leiguarda and Marsden, 2000).
One possibility that cannot be ruled out is that activations in left inferior frontal cortex reflect subvocalization, as this region overlaps largely with Broca's area (Amunts et al., 1999; Tomaiuolo et al., 1999). This potential confound is unfortunately endemic to using familiar, nameable tools and actions. If true, however, it would then be unclear why the two earlier investigations of tool use gesture that also did not control for this possibility failed to detect significant left inferior frontal involvement (Moll et al., 2000; Choi et al., 2001). This view is bolstered by the fact that inferior frontal cortex was also activated during gesture production (Fig. 2B).
The focal activation in left DLFPC was unexpected both on the basis of earlier neuroimaging and patient-based studies. This is the only region in the left hemisphere that was exclusively active across both studies during action planning and not execution. As suggested by an anonymous reviewer, this area may be involved in the access and/or maintenance of information in semantic working memory (Gabrieli et al., 1998; Poldrack et al., 1999; Wagner et al., 2001) during the delay interval prior to the movement cue. In the macaque this region is connected directly with the IPL (Luppino and Rizzolatti, 2000), which could provide direct access to information represented there.
Posterior Parietal Cortex
In both studies we observed activation in anterior and more posterior regions of left IPL. The location of the anterior SMG site (−42, −51, 50) is generally consistent with results of tasks involving tools as stimuli (Grezes and Decety, 2001), including naming (Martin et al., 1996; Chao and Martin, 2000; Okada et al., 2000), action word generation (Martin et al., 1995), action semantic judgements (Kellenbach et al., 2003) and gesture planning (Moll et al., 2000). As suggested earlier, this anterior site may represent stored attributes associated with grasping and manipulating tools (Chao and Martin, 2000) as it lies close to an area activated during object prehension (putative homologue of macaque area AIP), located near the junction of the IPS and postcentral gyrus. As in macaques, this region appears to be involved in computing the sensorimotor transformations necessary to map hand posture onto object shape during prehension (Binkofski et al., 1998; Culham et al., 2003; Johnson-Frey et al., 2004b). However, it is worth noting that location of this activation peak is situated somewhat superior and posterior to 95% confidence intervals computed around those of putative AIP in eight published neuroimaging studies involving humans (Binkofski et al., 1998, 1999a,b; Chao and Martin, 2000; Jancke et al., 2001; Shikata et al., 2001; Grefkes et al., 2002; Culham et al., 2003): x = −35 to −42, y = −38 to −44, z = 39 to 47. This raises the possibility that representations of properties associated with tool manipulation are stored in a separate region adjacent to the area involved in computing sensorimotor transformations during grasping (i.e. putative AIP).
Alternatively, an argument can be made that left anterior parietal activations reflect motor attention processes. This interpretation has been given to activations in left SMG (−62, −26, 36) during similar delayed response paradigms in which subjects prepare manual responses with either limb (Rushworth et al., 2001a,b). However, this seems unlikely as the anterior SMG site detected in both experiments 1 and 2 is considerably superior and posterior to this region. We did observe activations in two more anterior SMG sites consistent with the area implicated in motor attention. However, inconsistent with the motor attention hypothesis, the locations of activation peaks differed depending on the hand involved: right (x = −50, y = −29, z = 33) and left (x = −59, y = −25, z = 44). These areas do not appear in Figure 7 because <10 significantly activated voxels (P < 0.01) overlapped.
The more posterior parietal site is centered along the IPS (−32, −69, 44) and involves both posterior SMG and ANG. This site is caudal to those reported in perceptual and semantic studies involving tools (Chao and Martin, 2000; Grezes and Decety, 2001; Martin and Chao, 2001; Kellenbach et al., 2003). Yet this location is consistent with activations reported in an earlier study of tool use gesture (Moll et al., 2000) and coincides with the area of maximal lesion overlap in IM patients with parietal damage (Haaland et al., 1999). We hypothesize that this area is specifically involved in the representation of motor programs for acquired tool use skills that dictate how objects' are engaged and manipulated during learned action sequences (Johnson-Frey, 2003a; Johnson-Frey and Grafton, 2003). On the basis of data from IM patients, Heilman and colleagues have proposed a similar idea in which left SMG is said to represent ‘visuokinesthetic engrams’, necessary for manual skills (Heilman et al., 1982).
This segregation of parietal mechanisms involved in grasping and manipulation of objects (i.e. putative AIP) versus the representation of skills that are planned in accordance with past experience is consistent with observations showing that IM patients often can grasp and manipulate items with reasonable dexterity on the basis of their perceptual attributes (Goldenberg and Hagmann, 1998; Buxbaum et al., 2003), even when failing to use the same tools appropriately (Sirigu et al., 1995). Likewise, some apraxics can also infer novel tools' uses on the basis of their 3-D structural properties (Goldenberg and Hagmann, 1998). This segregation may explain why IM patients typically perform better when actually using tools as opposed to gesturing, i.e. they may be able to compensate for difficulties accessing representations of skills by relying more heavily on spared anterior parietal mechanisms involved in visually guided prehension. Conversely, lesions that include both the anterior and posterior IPL may account in part for the fact that some IM patients display kinematic abnormalities (Haaland et al., 1999; Poizner et al., 1995). Similar distinctions between semantic versus perceptual routes for using tools have been made previously on the basis of IM patient data (Schwartz, 1997; Goldenberg and Hagmann, 1998; Buxbaum, 2001).
Gesture Execution
Green areas in Figure 7 represent those voxels significantly activated in the contrast of the TOOL-GO versus TOOL-NOGO conditions regardless of the limb involved (i.e. during both experiments 1 and 2). There are two noteworthy findings here. First, in contrast to gesture planning, activity is largely bilateral and includes dorsal and ventral premotor, posterior temporal, and inferior frontal cortices, as well as cerebelum and basal ganglia. The one execption is a small activation in left SPL. Second, there appears to be partial segregation between areas involved in action conceptualization (red) versus execution (green) within left posterior temporal, inferior parietal and inferior frontal cortices. Areas depicted in blue are active during both planning and execution. Put differently, within the left hemisphere temporo-parieto-frontal praxis network there are subregions involved exclusively in the limb-independent skill planning, execution, or both.
Conclusions
While dissociations between cognitive and sensorimotor processes have garnered considerable attention (Bridgeman et al., 1979, 1997; Goodale et al., 1991), many everyday actions, including tool use, require an interaction between these systems. A growing number of behavioral studies provide evidence for such interactions (Creem and Proffitt, 2001; Ellis and Tucker, 2000; Gentilucci, 2003; Glover et al., 2004). A critical task for future research is determining the specific neural mechanisms that make this possible. This project represents an initial step in this direction. Our findings demonstrate that sites in the left inferior frontal, inferior parietal, and posterior temporal cortices are involved in planning tool use actions regardless of the upper-limb involved. With one important exception, these sites have been shown to be active in earlier perceptual and/or semantic tasks involving tools, as expected if representations of these objects include attributes associated with grasping and manipulation (Chao and Martin, 2000; Martin and Chao, 2001). Activation in left posterior SMG and ANG, by contrast, appears to be present only in tasks that involve planning or executing acquired tool use actions, and not during perceptual or semantic tasks (Chao and Martin, 2000; Grezes and Decety, 2001; Martin and Chao, 2001; Kellenbach et al., 2003). Along with the fact that this area coincides with the location of maximal lesion overlap in parietal-injured IM patients (Haaland et al., 2000), this result motivates the hypothesis that this region is specifically involved in representing stored motor programs for tool use skills. Additional work will be required to determine if this network is specific to tool use or whether it is also involved in representing other acquired manual skills.
This paper is dedicated to the memory of George L. Frey and was supported by grants from NIMH (K01 MH002022-01) and the James S. McDonnell Foundation to the first author. The authors wish to thank Alex Martin, Steve Keele, Valerie E. Gerry and anonymous reviewers for helpful comments on this project.
References
Amunts K, Schleicher A, Burgel U, Mohlberg H, Uylings HB, Zilles K (
Basso A, Luzzatti C, Spinnler H (
Beauchamp MS, Lee KE, Haxby JV, Martin A (
Beauchamp MS, Lee KE, Haxby JV, Martin A (
Beauchamp MS, Lee KE, Argall BD, Martin A (
Binkofski F, Dohle C, Posse S, Stephan KM, Hefter H, Seitz RJ, Freund HJ (
Binkofski F, Buccino G, Posse S, Seitz RJ, Rizzolatti G, Freund H (
Binkofski F, Buccino G, Stephan KM, Rizzolatti G, Seitz RJ, Freund HJ (
Bridgeman B, Lewis S, Heit G, Nagle M (
Bridgeman B, Peery S, Anand S (
Buxbaum LJ, Sirigu A, Schwartz MF, Klatzky R (
Chao LL, Martin A (
Chao LL, Haxby JV, Martin A (
Choi SH, Na DL, Kang E, Lee KM, Lee SW, Na DG (
Clark MA, Merians AS, Kothari A, Poizner H, Macauley B, Gonzalez Rothi LJ, Heilman KM (
Creem SH, Proffitt DR (
Culham JC, Danckert SL, DeSouza JF, Gati JS, Menon RS, Goodale MA (
Damasio H, Grabowski TJ, Tranel D, Ponto LL, Hichwa RD, Damasio AR (
Dassonville P, Zhu XH, Uurbil K, Kim SG, Ashe J (
De Renzi E, Faglioni P, Sorgato P (
Duvernoy HM (
Ehrsson HH, Fagergren A, Jonsson T, Westling G, Johansson RS, Forssberg H (
Ehrsson HH, Fagergren E, Forssberg H (
Ellis R, Tucker M (
Gabrieli JD, Poldrack RA, Desmond JE (
Gentilucci M (
Glover S, Rosenbaum DA, Graham J, Dixon P (
Godschalk M, Lemon RN, Kuypers HG, Ronday HK (
Goldenberg G, Hagmann S (
Goldenberg G, Hartmann K, Schlott I (
Goodale MA, Milner AD, Jakobson LS, Carey DP (
Grabowski TJ, Damasio H, Damasio AR (
Grafton ST, Fagg AH, Woods RP, Arbib MA (
Grafton ST, Fadiga L, Arbib MA, Rizzolatti G (
Grafton ST, Hazeltine E, Ivry RB (
Grefkes C, Weiss PH, Zilles K, Fink GR (
Grezes J, Decety J (
Haaland KY, Harrington DL, Knight RT (
Haaland KY, Harrington DL, Knight RT (
Handy TC, Grafton ST, Shroff NM, Ketay S, Gazzaniga MS (
Imamizu H, Miyauchi S, Tamada T, Sasaki Y, Takino R, Putz B, Yoshioka T, Kawato M (
Imamizu H, Kuroda T, Miyauchi S, Yoshioka T, Kawato M (
Jancke L, Kleinschmidt A, Mirzazade S, Shah NJ, Freund HJ (
Johnson-Frey SH (
Johnson-Frey SH (
Johnson-Frey SH, Grafton ST (
Johnson-Frey SH, Funnell MG, Gerry VE, Gazzaniga MS (
Johnson-Frey VD, Norlund RN, Grafton SG (
Keele SW, Ivry R, Mayr U, Hazeltine E, Heuer H (
Kellenbach ML, Brett M, Patterson K (
Leiguarda RC, Marsden CD (
Liepmann HM (
Luppino G, Rizzolatti G (
Luppino G, Murata A, Govoni P, Matelli M (
Marchetti C, Della Sala S (
Martin A, Chao LL (
Martin A, Haxby JV, Lalonde FM, Wiggs CL, Ungerleider LG (
Martin A, Wiggs CL, Ungerleider LG, Haxby JV (
Moll J, de Oliveira-Souza R, Passman LJ, Cunha FC, Souza-Lima F, Andreiuolo PA (
Ochipa C, Rothi LJ, Heilman KM (
Okada T, Tanaka S, Nakai T, Nishizawa S, Inui T, Sadato N, Yonekura Y, Konishi J (
Oldfield RC (
Perani D, Cappa SF, Bettinardi V, Bressi S, Gorno-Tempini M, Matarrese M, Fazio F (
Petrides M, Pandya DN (
Poizner H, Clark MA, Merians AS, Macauley B, Gonzalez Rothi LJ, Heilman KM (
Poldrack RA, Wagner AD, Prull MW, Desmond JE, Glover GH, Gabrieli JD (
Povinelli DJ (
Preuss TM, Stepniewska I, Kaas JH (
Raymer AM, Merians AS, Adair JC, Schwartz RL, Williamson DJ, Rothi LJ, Poizner H, Heilman KM (
Rizzolatti G, Camarda R, Fogassi L, Gentilucci M, Luppino G, Matelli M (
Rizzolatti G, Fogassi L, Gallese V (
Roy EA, Square-Storer P, Hogg S, Adams S (
Rushworth MF, Krams M, Passingham RE (
Rushworth MF, Paus T, Sipila PK (
Sakata H, Taira M, Murata A, Mine S (
Schwartz MFB, L.J (
Shikata E, Hamzei F, Glauche V, Knab R, Dettmers C, Weiller C, Buchel C (
Sirigu A, Cohen L, Duhamel JR, Pillon B, Dubois B, Agid Y (
Tomaiuolo F, MacDonald JD, Caramanos Z, Posner G, Chiavaras M, Evans AC, Petrides M (
Tomasello M (
Tranel D, Damasio H, Damasio AR (
Tranel D, Kemmerer D, Adolphs R, Damasio H, Damasio AR (
Author notes
1Department of Psychology, University of Oregon, Eugene, OR 97403-1227, USA and 2Center for Cognitive Neuroscience, Dartmouth College, Hanover, NH 03755-3569, USA