


Abstract
Purpose: Many older adults consider driving vital to maintaining their preferred lifestyle and engagement with society, yet it is normative for individuals to eventually stop driving. This study examined the impact of driving cessation on older adults’ productive and social engagement and whether their mental and physical health mediated this relationship. Design and Methods: Multilevel modeling was used to analyze longitudinal data (N = 4,788 adults age 65 and over) from the Health and Retirement Study (1998–2010). Results: Productive engagement (paid work, formal volunteering, and informal volunteering) was negatively affected when older adults stopped driving, but social engagement was not immediately compromised by their transition to nondriver status. The role of physical health and mental health as mediators in explaining this relationship was negligible. Implications: The results suggest that interventions aimed at maintaining nondrivers’ participation in productive roles should focus on factors other than enhancement of health and well-being to spur greater engagement (e.g., availability of and barriers to use of public transportation). Also important in the intervention process is planning for mobility transitions. Future research should test for geographic (e.g., urban vs. rural) differences in the impact of driving cessation on productive and social engagement.
Driving is a critical component of autonomy, freedom of choice, and engagement for older adults, just as it is for younger people. As individuals age, it is normative to eventually stop driving. Foley, Heimovitz, Guralnik, and Brock (2002) estimate that men can expect to live 7 years and women 10 years, beyond their ability to drive safely. Yet, driving cessation is known to negatively affect older adults’ well-being, and it is reasonable to expect that it affects other dimensions of life as well. This study examines the impact of driving cessation on older adults’ productive and social engagement over time because these activities are critical to sustained well-being in later life (Matz-Costa, Besen, James, & Pitt-Catsouphes, 2012).
Despite its normative nature, few plan to stop driving (Adler, 2010), perhaps because the transition can be unexpected, as in response to a crisis medical condition (e.g., stroke; Staplin, Lococo, Martell, & Stutts, 2012). Some older adults stop driving due to medical impairments (King et al., 2011) or feelings of poor health (Dellinger, Sehgal, Sleet, & Barrett-Connor, 2001). Others stop driving due to finances or personal choice (Adler & Rottunda, 2006). For many, driving cessation is a process that occurs for several months or years (Dickerson et al., 2007), even when conditions that affect safety exist (e.g., dementia; Croston, Meuser, Berg-Weger, Grant, & Carr, 2009). The data analyzed in this study capture driving transitions occurring over time and their time varying impact on productive and social engagement.
Longitudinal results demonstrate that driving cessation predicts poor outcomes for older adults. For example, former drivers can expect poorer health trajectories (Edwards, Lunsman, Perkins, Rebok, & Roth, 2009), increased rates of depression (Fonda, Wallace, & Herzog, 2001), institutionalization (Freeman, Gange, Muñoz, & West, 2006) and mortality (Edwards, Perkins, Ross, & Reynolds, 2009), and decreased out-of-home activities (Marottoli et al., 2000) compared with older drivers. To rule out declining health, rather than driving cessation, as the primary contributor to these outcomes, these studies controlled for health status. Thus, the evidence suggests that driving cessation itself leads to challenges in later life rather than the alternative explanation that those experiencing challenges are simply more likely to cease driving.
Beyond the established impact of driving cessation on a variety of health outcomes, less is known about how cessation influences engagement in later life. Anecdotally, older adults expect their lives to change for the worse once they stop driving. Yet, limited evidence exists regarding how engagement—specifically, trajectories of work and social involvement—is affected by driving cessation. Buys and Carpenter (2002) found mixed outcomes in their qualitative data from a metropolitan sample. Whereas some older adults reported maintenance of work and volunteer roles after driving cessation, others considered driving necessary to continue working. One European study found that retirement from a job often precipitates driving cessation for older adults (Raitanen, Tormakangas, Mollenkopf, & Marcellini, 2003), but how driving cessation affects work was not reported. Similar to paid employment, volunteering may be affected by driving status. Given that adults are more likely to stop than start volunteering in older age (Butrica, Johnson, & Zedlewski, 2009), driving cessation also may limit volunteering in late life. Informal volunteering, such as giving help to relatives or friends, also may be reduced by driving cessation, especially if social networks are spread over greater distance.
Social engagement also appears highly contingent on driving. In one qualitative study, older women who had stopped driving reported less involvement in social activities, largely due to transportation difficulties (Bryanton, Weeks, & Lees, 2010). In terms of friendship network size, a 50% reduction was observed after persons ceased driving (controlling for self-rated health) in a longitudinal investigation conducted with an urban sample (Mezuk & Rebok, 2008). Both poor mental and physical health are tied to low social engagement and perceived isolation (Cornwell & Waite, 2009); thus, their role in the link between driving and social engagement cannot be ignored.
Evidence suggests that income may modify the association between driving cessation and engagement. Poverty research indicates that not owning or driving a car limits access to employment (Grengs, 2010), and for many, driving is associated with a lifestyle that is difficult to achieve through other means. Among wealthier suburbanites, driving appears especially important for maintaining social activity (Farber & Páez, 2009). Indeed, Ragland, Satariano, and MacLeod (2004) found that low income was a predictor of avoiding or limiting driving in a sample of older adults. Having greater income may expand transportation options once driving ceases, thereby buffering effects on engagement for the nondriver. Therefore, income is an important moderator to test in the association between driving cessation and engagement.
Given the known impact of health on driving cessation, and the demonstrated consequences of cessation for physical and mental health, it is informative to study driving cessation with longitudinal data that allow for consideration of both pre- and post-driving health assessments. This approach can reveal whether poor physical and mental health account for the association between cessation and engagement or if other factors explain this association. Determining whether health and mental health mediate the relationship between driving cessation and engagement may inform the development of interventions for older former drivers as this information may help dictate the nature, scope, and timing of cessation-related interventions. Finally, a longitudinal design is valuable for addressing how the impact of driving cessation shifts over time. Fonda and colleagues (2001) suggest that cessation may be most disruptive immediately following the driving transition, with outcomes possibly attenuating over time as nondrivers adapt. Using multiple data points, we can address this question of potential adaptation to driving cessation or intensified negative consequences over time.
Why Cessation Affects Engagement
A parsimonious explanation for why change in an individual’s mobility affects engagement arises from theories that explain person-environment transactions. Fuller’s Task Capability Interface (TCI; Fuller, 2005) model connects outcomes to the difficulty of a task and the level of an individual’s ability. Changes in the person (e.g., driving ability) or environment (e.g., route to work) determine an outcome depending upon the individual’s ability to adapt to the change. Although a vehicle collision is the typical outcome of interest when using Fuller’s model, it can be applied to an individual’s general mobility. For example, if volunteering becomes difficult when driving ceases, the model suggests that volunteering will be reduced. If the individual can adapt to driving cessation (e.g., through finding alternative transportation), then a loss or decline in volunteerism would be circumvented. In this study, we hypothesize that driving cessation results in increased mobility challenges and therefore negatively affects engagement outcomes. Thus, Fuller’s TCI model (Fuller, 2005) can be used to understand why driving cessation may affect engagement in later life from a mobility perspective.
The Present Study
The primary goal of this study is to examine whether driving cessation leads to prospective changes in productive and social engagement for adults aged 65 and older. A secondary aim is to determine whether mental and physical health mediate the association between driving cessation and engagement. Using longitudinal data from a nationally representative sample, we test the following hypotheses:
Driving cessation will reduce the likelihood of productive engagement, specifically paid employment, formal volunteering, and informal volunteering.
Driving cessation will reduce social engagement.
Given the established link between driving cessation and health, mental and physical health will mediate the association between driving cessation and engagement changes.
Higher income will moderate the negative impact of driving cessation on engagement.
Controlling for factors associated with driving cessation and engagement is necessary in an analysis of change over time. Predictors of engagement in later life include age, income, education, gender, marital status (Matz-Costa et al., 2012), and minority status (Tang, Copeland, & Wexler, 2012). Many of these same background factors have been linked to driving cessation: age (Foley et al., 2002), gender (Chipman, Payne, & McDonough, 1998), marital status (Chipman et al., 1998), and income (Ragland et al., 2004).
Design and Methods
Data
We employed longitudinal data from seven waves (each collected about two years apart, from 1998 to 2010) of the Health and Retirement Study (HRS). This is a nationally representative study of noninstitutionalized adults aged 50 and older, together with their spouses/partners regardless of age, with oversamples of Blacks, Hispanics, and Florida residents (Heeringa & Connor, 1995). The RAND Corporation prepared data files that facilitate longitudinal data analyses; we used RAND’s version L file (St. Clair et al., 2011), merged with the raw variables on driving cessation from HRS.
For inclusion in this study, respondents had to meet these criteria:
interviewed in 1998 (excluded 9,287 respondents);
aged 65 or older (excluded 10,599), as the driving cessation variables were only asked of older adults;
primary HRS respondents (excluded 3,504), to meet the statistical assumption of independent observations;
reported being able to drive at baseline (excluded 5,098);
person-level analysis weight greater than zero at baseline (excluded 27; St. Clair et al., 2011); and
nonmissing and nonproxy responses (persons with missing data or proxy responses were excluded for that wave only; excluded 283 at baseline).
These criteria resulted in a final unweighted sample of 4,788 individuals.
Measures
Dependent Variables.
Four outcome variables were assessed. Paid employment was created from RAND’s labor force status variable, which included seven groups: working full time, working part time, unemployed, partly retired, retired, disabled, or not in the labor force. Respondents were coded as employed (1) if they were working full time, part time, or were partly retired; otherwise paid employment was coded as 0. For formal volunteering, respondents were asked “Have you spent any time in the past 12 months doing volunteer work for religious, educational, health-related or other charitable organizations?” (1 = yes, 0 = no). For informal volunteering, respondents were asked “Altogether, about how many hours did you spend in the past 12 months helping friends, neighbors, or relatives who did not live with you and did not pay you for the help?” Any hours greater than zero were coded 1, otherwise informal volunteering was coded 0. For social engagement, respondents were asked “How often do you get together with any of your neighbors (or people in or near your facility) just for a chat or for a social visit?” and a follow-up question about the unit of time (i.e., per day, per week, and so forth) for their response. Based on the number of contacts reported, we standardized these reports by calculating a variable indicating days of social contact per week, with a range of 0-7.
Independent Variables.
To determine driving status, respondents were asked “Are you able to drive?” We recoded responses as 1 = no longer able to drive and 0 = still able to drive. In addition, a variable was created to indicate how many waves had passed since the first driving cessation that occurred during the study (coded 0, 1, 2, etc., to be consistent with the measurement of time). Time was indexed with the wave of data collection (0, 1, 2, etc.). Demographic controls were coded as gender (1 = female; 0 = male), race (1 = non-White; 0 = White), years of education (0-17+ years) at baseline, age at baseline, marital status (1 = married/partnered; 0 = single), and annual household income (computed by RAND based on all sources of income for the last calendar year for the respondent and spouse/partner). An interaction term was also created between “not able to drive” and “household income” to test Hypothesis 4.
Depressive symptomatology was measured at each wave using the eight-item Centers for Epidemiologic Studies Depression (CES-D) scale (Radloff, 1977). For each symptom, respondents reported if they had felt it “much of the time” during the past week (1 = yes, 0 = no); responses were summed to form a scale with a 0–8 range, indicating number of depressive symptoms (Cronbach’s α = 0.71 at baseline). Cognitive ability was based on word recall, and ability to count backwards, to identify an object by its description, to give the date, and to name the U.S. president and vice president. Scores were summed to form the total cognitive ability score, ranging from 0 to 35, with higher numbers indicating greater cognitive functioning. For chronic conditions, respondents reported if they had ever been diagnosed by a physician with any of the seven major conditions (high blood pressure, diabetes, cancer, chronic lung disease, heart problems, stroke, or arthritis). Reported conditions were summed, with a range of 0-7. Respondents also were asked if they had any limitations with three instrumental activities of daily living (IADLs): using the telephone, managing money, and taking medications. “Yes” responses were summed, with a range of 0-3, with higher numbers indicating more IADL limitations. Self-rated health was based on the question “Would you say your health is excellent, very good, good, fair, or poor?” (0–4 range; higher = better health).
For the multivariate analyses, education, age, cognitive function, and income were transformed to aid in model convergence and intercept interpretation. Education and total cognitive ability were grand mean centered. Age was centered by subtracting the minimum age (65 years, due to sample selection criteria) from all values. Because data were skewed, household income was transformed by adding 100 to all values and then taking the natural log transformation; this logged variable was then centered on the sample mean of 10.32.
Data Analysis
Data were analyzed using multilevel modeling with Hierarchical Linear Modeling 6.08 software (Raudenbush, Bryk, & Congdon, 2009), with full maximum likelihood estimation and HRS-provided person-level weights (based on Current Population Survey demographics). Multilevel modeling is appropriate given the hierarchical nature of longitudinal data (repeated observations within persons). This method requires respondents to have complete data within a wave, but data at every wave are not necessary to be included in the analyses. This approach also permits modeling of both fixed/average effects of predictors on the outcome and random effects (which give information about the variability around the fixed effect). For the analyses, the distribution of social engagement was treated as continuous, whereas paid employment, formal volunteering, and informal volunteering were all estimated as Bernoulli (dichotomous, 0 or 1) outcomes.
This study utilized nested models, starting with a baseline model consisting of the intercept and time slope, which were entered as fixed and random effects. Subsequent models contained all the predictors of the previous model plus additional predictors. The second model addressed Hypotheses 1 and 2 by adding the driving cessation variables (not able to drive and waves since driving cessation) as fixed and random effects, plus the demographic control variables (gender, race, education, age, marital status, and household income), which were entered as fixed effects. The third model (Model 3) added the physical and mental health variables as fixed effects to test the mediating effects of health factors on driving cessation’s impact on engagement (Hypothesis 3). Model 4 added the interaction term between driving cessation and income to test Hypothesis 4. A significant interaction term would indicate that the effects of driving cessation on a given outcome vary by income level. All the predictors were entered in the models as time varying, with the exception of gender, race, education, and age.
Results
Table 1 presents weighted and unweighted descriptive statistics for the study variables at baseline. On average, respondents indicated few depressive symptoms, chronic conditions, and IADL limitations (M = 1.47, 1.70, and 0.05, respectively). Most respondents (59%) were engaged in informal volunteering, whereas a substantial minority was engaged in formal volunteering (35%) or paid employment (21%). For social engagement, respondents reported social contact with friends or neighbors about two days per week at baseline (M = 2.07).
Distribution of Study Variables at Baseline, Unweighted (N = 4,788) and Weighted
| Study variables | Unweighted M (SD) | Weighted M (SD) |
|---|---|---|
| Gender (1 = female) | 48.3% | 50.5% |
| Race (1 = non-White) | 12.5% | 9.1% |
| Marital status (1 = married/partnered) | 54.2% | 49.6% |
| Education (0–17 and more years) | 12.18 (3.19) | 12.29 (3.06) |
| Age (65–97 years) | 73.75 (6.47) | 73.74 (6.22) |
| Household income (annual) | 37,645 (49,678) | 37,801 (53,223) |
| Depressive symptomatology (CES-D; 0–8) | 1.47 (1.76) | 1.45 (1.76) |
| Chronic conditions (0–7) | 1.70 (1.23) | 1.70 (1.23) |
| Self-rated health (0–4) | 2.12 (1.12) | 2.14 (1.21) |
| IADL limitations (0–3) | 0.05 (0.26) | 0.05 (0.25) |
| Cognitive ability (0–35) | 22.40 (4.89) | 22.57 (4.77) |
| Paid employment (1 = working) | 20.8% | 20.8% |
| Formal volunteering (1 = yes) | 34.6% | 34.7% |
| Informal volunteering (1 = yes) | 59.2% | 59.2% |
| Social engagement (d/wk; 0–7) | 2.07 (2.55) | 2.07 (2.54) |
Notes: CES-D = Center for Epidemiologic Studies Depression scale; IADL = instrumental activities of daily living.
Multivariate models estimating the impact of driving cessation on productive and social engagement are presented in Tables 2 and 3. Table 2 shows results from multivariate models estimating two of the outcomes of interest, formal volunteering and informal volunteering (outcomes “a” and “b,” respectively), and Table 3 presents those for paid employment and social engagement (outcomes “c” and “d,” respectively). The likelihood of older adults engaging in each of the four outcomes declined over time as indicated by the significant coefficients (all with odds < 1.00) for the time variables in Model 1. The significant coefficients for driving cessation (i.e., not able to drive) in Model 2 support Hypothesis 1 by indicating that driving cessation further reduces productive engagement in older age, beyond the effects of time. The likelihood of formal and informal volunteering drops by 68% and 70%, respectively, after individuals report no longer driving. The likelihood of employment decreases approximately 79% for individuals who report no longer driving, controlling for demographic variables. Moreover, the variable indicating length of time since reporting driving cessation was significant for both formal and informal volunteering, indicating that those who stop driving experience a faster decline in volunteering over time than those who do not. Once physical and mental health were included (Model 3), this relationship was no longer significant for informal volunteering.
Multilevel Model Results (Odds Ratios) Predicting Formal and Informal Volunteering From Driving Cessation and Other Factors
| Formal volunteering | Informal volunteering | |||||||
|---|---|---|---|---|---|---|---|---|
| Model 1a | Model 2a | Model 3a | Model 4a | Model 1b | Model 2b | Model 3b | Model 4b | |
| Fixed effects | ||||||||
| Intercept | 0.48** | 0.44** | 0.33** | 0.33** | 1.59** | 3.23** | 2.07** | 2.07** |
| Time (waves) since baseline | 0.85** | 0.89** | 0.94** | 0.94** | 0.75** | 0.78** | 0.81** | 0.81** |
| Not able to drive (1 = yes) | 0.32** | 0.41** | 0.41** | 0.30** | 0.39** | 0.40** | ||
| Waves since driving cessation | 0.79** | 0.83** | 0.83** | 0.88* | 0.93 | 0.93 | ||
| Gender (1 = female) | 1.60** | 1.49** | 1.49** | 0.82** | 0.76** | 0.76** | ||
| Race (1 = non-White) | 1.41** | 1.61** | 1.61** | 1.03 | 1.17 | 1.17* | ||
| Education (0–17 and more years)a | 1.15** | 1.11** | 1.11** | 1.08** | 1.04** | 1.04** | ||
| Age at baselinea | 0.97** | 0.99** | 0.99** | 0.94** | 0.95** | 0.95** | ||
| Marital status (1 = married/partnered) | 1.07 | 1.03 | 1.03 | 0.91 | 0.89* | 0.89* | ||
| Household income (annual, logged)a | 1.24** | 1.19** | 1.18** | 1.14** | 1.07** | 1.07* | ||
| CES-D (depressive symptoms; 0–8) | 0.93** | 0.93** | 0.95** | 0.95** | ||||
| Chronic conditions (0–7) | 0.96 | 0.96 | 0.96* | 0.96* | ||||
| Self-rated health (0–4) | 1.20** | 1.20** | 1.28** | 1.28** | ||||
| IADL limitations (0–3) | 0.83** | 0.83** | 0.84** | 0.84** | ||||
| Cognitive ability (0–35)a | 1.04** | 1.04** | 1.03** | 1.03** | ||||
| Not Able to Drive × Income | 1.04 | 1.07 | ||||||
| Random effects | ||||||||
| Intercept | 3.18** | 3.07** | 3.02** | 3.02** | 1.34** | 1.25** | 1.17** | 1.17** |
| Time slope | 0.04 | 0.03 | 0.03 | 0.03 | 0.02 | 0.02 | 0.02 | 0.02 |
| Not able to drive (1 = yes) | 0.15 | 0.16 | 0.16 | 0.10 | 0.08 | 0.08 | ||
| Waves since driving cessation | 0.07 | 0.06 | 0.06 | 0.11 | 0.08 | 0.08 | ||
Notes: CES-D = Center for Epidemiologic Studies Depression scale; IADL = instrumental activities of daily living.
Convergence criterion = 0.000001; full maximum likelihood estimation. N = 4,788.
aCentered.
*p < .05. **p < .01.
Multilevel Model Results Predicting Paid Employment and Social Engagement From Driving Cessation and Other Factors
| Paid employment (odds ratios) | Social engagement (event rate ratios) | |||||||
|---|---|---|---|---|---|---|---|---|
| Model 1c | Model 2c | Model 3c | Model 4c | Model 1d | Model 2d | Model 3d | Model 4d | |
| Fixed effects | ||||||||
| Intercept | 0.21** | 0.85 | 0.63** | 0.63** | 1.60** | 1.67** | 1.52** | 1.52** |
| Time (waves) since baseline | 0.62** | 0.63** | 0.67** | 0.67** | 0.97** | 0.97** | 0.98** | 0.98** |
| Not able to drive (1 = yes) | 0.21** | 0.30** | 0.24** | 0.95 | 1.01 | 0.99 | ||
| Waves since driving cessation | 0.94 | 1.02 | 1.03 | 0.87** | 0.89** | 0.89** | ||
| Gender (1 = female) | 0.60** | 0.55** | 0.55** | 0.99 | 0.98 | 0.98 | ||
| Race (1 = non-White) | 1.21 | 1.36* | 1.37* | 1.08 | 1.11* | 1.11* | ||
| Education (0–17 and more years)a | 0.99 | 0.96* | 0.96* | 1.00 | 0.99 | 0.99 | ||
| Age at baselinea | 0.88** | 0.89** | 0.89** | 1.01** | 1.01** | 1.01** | ||
| Marital status (1 = married/partnered) | 0.59** | 0.57** | 0.57** | 0.78** | 0.77** | 0.77** | ||
| Household income (annual, logged)a | 2.29** | 2.20** | 2.17** | 0.98 | 0.97 | 0.98 | ||
| CES-D (depressive symptoms; 0–8) | 0.96* | 0.96* | 0.98** | 0.98** | ||||
| Chronic conditions (0–7) | 0.88** | 0.88** | 1.02 | 1.02 | ||||
| Self-rated health (0–4) | 1.27** | 1.27** | 1.04** | 1.04** | ||||
| IADL limitations (0–3) | 0.80 | 0.80 | 0.94* | 0.94* | ||||
| Cognitive ability (0–35)a | 1.03** | 1.03** | 1.01** | 1.01** | ||||
| Not Able to Drive × Income | 1.63* | 0.92 | ||||||
| Random effects | ||||||||
| Intercept | 3.35** | 3.46 | 3.49 | 3.49 | 0.96** | 0.92** | 0.92** | 0.92** |
| Time slope | 0.04 | 0.04 | 0.03 | 0.03 | 0.06** | 0.05** | 0.05** | 0.05** |
| Not able to drive (1 = yes) | 0.30 | 0.28 | 0.26 | 1.05** | 1.05** | 1.05** | ||
| Waves since driving cessation | 0.26 | 0.22 | 0.21 | 0.36** | 0.36** | 0.35** | ||
Notes: CES-D = Center for Epidemiologic Studies Depression scale; IADL = instrumental activities of daily living.
Convergence criterion = 0.0001; full maximum likelihood estimation. N = 4,788.
aCentered.
*p < .05. **p < .01.
Contrary to Hypothesis 2, reported driving cessation did not predict frequency of social engagement (Model 2d, Table 3). However, length of time since driving cessation was statistically significant in this model, demonstrating that declines in social engagement over time were more pronounced for those who ceased driving than for those who did not.
Although several aspects of well-being also were associated with productive and social engagement, support for Hypothesis 3 was not found. Health factors did not mediate the association between driving cessation and the outcome variables as evidenced by the fact that the coefficients for driving cessation remained significant (and strong) after inclusion of the health and mental health variables in Models 3a, 3b, and 3c. Not surprisingly, self-rated health and cognitive ability contributed to the likelihood of employment and both kinds of volunteering and were related to higher levels of social engagement. Alternatively, greater depressive symptomatology reduced the likelihood of employment and both types of volunteering and was related to less frequent social engagement. More chronic conditions reduced the odds of employment and informal volunteering but were not associated with formal volunteering or social engagement. IADL limitations predicted reduced odds of formal and informal volunteering, and lower levels of social engagement, but were unrelated to employment. Thus, health status is clearly linked to productive and social engagement in later life, but its role as a mediator in explaining the effects of driving cessation on productive and social engagement for older adults is negligible.
Hypothesis 4 is tested with Model 4 in Tables 2 and 3. The interaction term for driving cessation and income at the bottom of each table indicates limited support for Hypothesis 4. Only with regard to employment (Model 4c) is the interaction significant. The significant positive coefficient indicates that for persons who are unable to drive, higher income contributes to the likelihood of continued paid employment.
Graphs shown in Figure 1 illustrate the expected productive and social engagement of older adults over time, based on final multivariate models for each outcome. These graphs compare the trajectories of engagement for those who can still drive and for those unable to drive as of 2002. Because driving cessation has both a short- and long-term impact on productive and social engagement, we set the occurrence of driving cessation early enough in the time series to capture both effects.
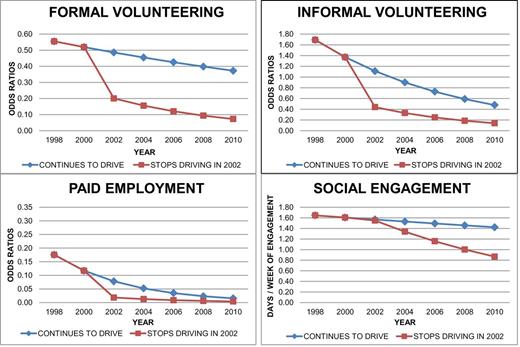
Differences in trajectories of drivers versus nondrivers for productive and social engagement.
As illustrated, driving cessation reported at Wave 3 (2002) has an immediate marked affect on the likelihood of employment and on both formal and informal volunteering. For both types of volunteering, differences remain between those who ceased driving and those with continued driving ability at the end of the study period, even though both groups reported declines in engagement over time. For employment, in contrast, the difference between the two groups by the last wave appears negligible because the effect of driving cessation is immediate and most people eventually stop working. The graph for social engagement shows a slightly different pattern of results than the other outcomes. Although reports of driving status do not distinguish social engagement at Wave 3, declines in social involvement over the course of the study are more pronounced for those who have lost the ability to drive compared with those who still are able.
Discussion
Many older adults consider driving vital to maintaining their preferred lifestyle and engagement with society, yet limited empirical evidence exists regarding the effects of driving cessation on productive and social engagement. To advance such inquiry, we used nationally representative longitudinal data to examine the impact of driving cessation on older adults’ employment, formal and informal volunteering, and social engagement over time. Additionally, we tested the mediating role of health factors and the moderating role of income in the connection between driving cessation and changes in engagement.
Our results indicate that employment, formal volunteering, and informal volunteering are all negatively affected when older adults stop driving. Older adults’ employment was affected most by this transition, perhaps due to the challenges nondrivers face finding accessible and convenient jobs. These results support Fuller’s model in that adaptation is difficult when the most common form of transportation is no longer an option for older adults. Driving cessation’s impact on employment generalizes beyond metropolitan areas—as studied by Buys and Carpenter (2002). Whether such effects on employment vary by geographic locale, however, remains unknown. Future research should use geocodes to test whether driving cessation affects employment most severely in nonmetro areas where public transportation and employment options are likely limited.
Formal and informal volunteering also declined when driving stopped, yet these changes were less dramatic than those related to employment. Unlike most paid work, volunteering can be performed with another person, making it possible to continue this activity even after driving has ceased, especially if married to a spouse who also volunteers (Rotolo & Wilson, 2006). Such a strategy whereby one volunteers with a spouse or friend would be considered successful adaptation in Fuller’s model.
The notion that newly transitioned nondrivers may adapt to cessation by depending on rides from significant others should be further studied with dyadic research designs. Like most driving research, a limitation of this study is that it focused on individuals rather than on couple dyads. Thus, our analyses controlled for the respondents’ marital status but did not consider how driving status of the spouse/partner, or transitions in the partner’s driving status, affected the respondents’ engagement. Though Fonda and colleagues (2001) found that having a spouse who drives did not buffer the impact of driving cessation on heightened depression for new nondrivers, we expect that cessation’s negative impact on engagement would be eased by having a driving spouse with whom productive and social activities, other than paid work, can be shared.
Informal helping may be affected less by driving cessation than paid work because older adults can help others without going far from home. For example, grandparents may offer drop-in childcare for nonresident grandchildren (Luo, LaPierre, Hughes, & Waite, 2012). Nevertheless, even informal volunteering declined when driving ceased. Thus, being a driver facilitates helping others.
Unlike paid work, formal volunteering, and informal volunteering, social engagement was not immediately compromised when adults transitioned to nondriver status. Though prior evidence suggested that driving cessation inhibited out-of-home activities (Marottoli et al., 2000), our use of a more precise measure of social engagement (distinct from other out-of-home activities) clarified outcome differences based on the type of out-of-home activity. Still, the HRS data analyzed herein restricted social involvement to contacts with neighbors and persons living nearby. Surely neighborly connections are less dependent on driving than are social relationships outside one’s proximate environment, which is an issue for future research to consider. Although one possibility is that reduced mobility may lead to less interaction with more distant network members for persons who stop driving, an alternative scenario is that family and friends compensate for this mobility restriction by becoming more attentive and involved (perhaps by telephone) with a newly transitioned nondriver. Furthermore, getting rides from others may create opportunities for increased interpersonal interaction. Thus, driving cessation need not invariably reduce social interactions and may even enhance social engagement for some older adults (Freund & Vine, 2010).
The longitudinal perspective applied in this study allowed assessment of both immediate changes in engagement associated with driving cessation and protracted effects. The results revealed that, over time, formal volunteering and social engagement both declined more sharply for former drivers than for current drivers, controlling for health and other factors. This drop-in engagement could occur if the alternatives to driving that new nondrivers initially use, such as receiving rides from others, become less desirable or available over time. Indeed, some nondrivers in Bryanton and colleagues’ (2010) qualitative study reported feeling like a nuisance when they repeatedly asked for rides from others. Such concerns may become more common over time if the willingness of family and friends to transport former drivers wanes.
Our extended longitudinal approach also revealed that changes in social engagement for nondrivers occurred despite no immediate effect of driving cessation on social contact. The marked reduction in social engagement with nearby network members that nondrivers experienced over time, relative to drivers, may be a consequence of a related relocation. Studies indicate that driving cessation often leads to changes in living arrangements (Adler, 2010; Myers, Janssen-Grieve, Crizzle, & Brown, 2012), which may put older nondrivers at a disadvantage for socializing even in their near environments, resulting in isolation and dissatisfaction with their social contacts (Dupuis-Blanchard, Neufeld, & Strang, 2009).
Also examined was whether the effects of driving cessation on engagement were moderated by household income. A significant interaction occurred for paid employment only, with greater income buffering the negative impact of driving cessation on likelihood of work. Perhaps higher paid workers have greater workplace flexibility (Tang & MacDermid Wadsworth, 2010), making driving status less relevant for them, or higher income workers may have greater incentive and ability to continue working and thus use their resources to find alternative ways to stay productively engaged despite no longer driving.
This analysis assessed whether physical and mental health changes previously associated with driving cessation mediated the effects of cessation on engagement. That is, do reductions in employment, volunteering, informal assistance, and social engagement following driving cessation primarily result because of associated increases in health problems and depression? Our analysis indicates that the answer is “no.” After including physical, cognitive, and mental health indicators into our models, the influence of driving cessation on employment, formal volunteering, and informal volunteering remained statistically significant and relatively unchanged. Thus, it is not the case that driving cessation deters productive engagement through its negative impact on either physical health or depression. Yet, preventive efforts aimed at maintaining physical and cognitive health cannot be overlooked given the significant impact of these factors on driving cessation (Staplin et al., 2012).
Our results corroborate previous findings revealing the significant negative impact of driving cessation on older adults’ lives (Edwards et al., 2009; Freeman et al., 2006) and extended this research to productive and social engagement. The serious consequences of driving cessation for older adults are crucial to impart during the training of health and social services professionals who will routinely encounter issues of mobility when serving older patients and clients. Education should acknowledge the critical impact of driving cessation on older person’s lives and emphasize ways in which the transition from driving can be postponed as long as possible. Moreover, when professionals come in contact with older people to conduct assessments and develop care plans, it is critical to discuss driving transition planning. Normalizing the process of driving cessation and making it a routine topic of late-life planning are key to ensuring that viable pathways exist to maintaining engagement after giving up the keys.
Policy implications also stem from our findings. The maintenance of accessible, affordable, and desirable transportation alternatives is needed. Additionally, reimbursement for health care activities that help people to identify the appropriate time for driving cessation or extend the years of safe driving, such as Certified Driver Rehabilitation Specialist programs, is important to prevent reduced engagement among older persons. Contrary to these suggestions, Stav, Weidley, and Love (2011) report a recent precipitous decline in the number of programs oriented toward maintaining driving ability among older adults. Finally, the flexibility of workplace policies may also require review if employers want to ensure the continued contributions of valued older workers, some of whom may be unable to drive.
The persistent, direct effect of driving cessation on productive engagement suggests that interventions aimed at maintaining nondrivers’ participation in productive roles should focus on factors other than enhancement of health and well-being. Person-centered approaches that emphasize planning for driving cessation should be used in interventions (Berg-Weger, Meuser, & Stowe, in press). Our results suggest that if employment and volunteering are expected and desired in later life, efforts should be made to maintain driving or some alternative form of mobility. Early intervention surrounding mobility transitions could optimize adaptation and enhance opportunities for continued engagement of older nondrivers.
Acknowledgment
An earlier version of this article was presented at the annual meeting of the Gerontological Society of America, San Diego, November, 2012.
References
Author notes
Decision Editor: Rachel Pruchno, PhD

