


Abstract
The authors study whether leisure participation is an independent predictor of survival over 20 years. Of the nationally representative sample of 8000 adult Finns (Mini-Finland Health Survey), aged ≥30 years, the cohort of 30–59 years (n 5087) was chosen for the Cox proportional survival analyses. The sum score of leisure participation was divided in quartiles (the lowest quartile = scarce = 0–6), two intermediate quartiles = 7–11 and the highest quartile = abundant = 12–21). Adjusted for statistically significant covariates (age, tobacco smoking, alcohol consumption, obesity, self-rated health and diagnosed chronic diseases), and with scarce participation as the reference, the hazard ratios and 95% confidence intervals (CIs) for the risk of death were 0.80, 0.67–0.95 (intermediate) and 0.66, 0.52–0.84 (abundant) for men. The association was insignificant in women with good health. The results show that leisure participation predicts survival in middle-aged Finnish men and its effect is independent of demographic features, of health status and of several other health-related factors. The beneficial effect emphasizes the significance of leisure activities for the promotion of men's health.
INTRODUCTION
Previous studies have shown that social participation, in terms of attendance at meetings and the possibility to influence decisions in organized groups and associations (Dalgard and Håheim, 1998), in terms of attendance at (some) cultural events (Bygren et al., 1996; Konlaan et al., 2002), in terms of engagement in social and productive activities (Glass et al., 1999; Sundquist et al., 2004), or in terms of religious participation (Lutgendorf et al., 2004), predicts survival. Also, social ties in American men (Eng et al., 2003) have been shown to predict survival. Berkman and her co-workers have presented a conceptual model for the impact of social integration, participation and engagement on health in community (Berkman et al., 2000).
Recently, we showed in community studies that active social participation associates with self-rated good health in Finland (Hyyppä and Mäki, 2001a; Hyyppä and Mäki, 2003). Cultural and social participatory activities seem to be associated with individuals' health in different ways in culturally dissimilar communities, e.g. the Swedish-speaking minority Finns living intermingled with the Finnish-speaking majority are more active in community participation and in singing in choir than the Finnish-speaking majority Finns (Hyyppä and Mäki, 2001a). We have suggested that a great deal of the substantially longer active life expectancy among the Swedish-speaking Finns than among the Finnish-speaking Finns (Hyyppä and Mäki, 2001b) can be explained by differences in leisure cultural and social participation and in stock of social capital (Hyyppä and Mäki 2001a; Hyyppä and Mäki, 2003).
Together epidemiological studies substantiate the idea of a strong link between cultural and social participation and survival. Social participation in informal and formal leisure activities is an element of social capital that has also been linked with survival (e.g. Kawachi et al., 1997; Skrabski et al., 2003). The concept of social capital was defined by Pierre Bourdieu (Bourdieu, 1980; Bourdieu, 1986) and by James Coleman (Coleman, 1988) as an attribute of individuals, and by Robert D. Putnam (Putnam, 1993) as an attribute of communities. Following Bourdieu's treatment of social capital (Bourdieu, 1980), Alejandro Portes refers to the capacity of individuals and to their ability to secure benefits through memberships in networks and other social structures (Portes, 1998; Portes, 2000). Both micro-social (individual) level and macro-social (collective) level measures of social capital have been proposed for use in explaining health outcomes within a complex social context (Macinko and Starfield, 2001; Baum and Ziersch, 2003; Fassin, 2003; Kawachi et al., 2004; Szreter and Woolcock, 2004).
Few longitudinal prospective studies of the association between leisure participation and survival have been accomplished in a representative population of a whole country (Sundquist et al., 2004). Keeping in mind the conceptual framework of micro- or individual-level social capital, we chose data on leisure social, cultural and religious participation from the Mini-Finland Health Survey carried out in late 1970s and designed to examine the general health status and its determinants among adult population in Finland (Aromaa et al., 1989). Since the baseline examination, mortality among the survey participants has been followed up for over 20 years. Using the baseline data covering several health-related factors as covariates, we studied whether leisure participation is independent predictor of survival.
METHODS
Study population
The study population for the Mini-Finland Health Survey was a two-stage cluster sample of 8000 people drawn from the national population register and stratified to represent adult Finns, aged 30 years or over (Aromaa et al., 1989). Regarding the distribution of gender, age and level of education, the participants corresponded closely to the whole Finnish population (Aromaa et al., 1989).
In brief, 7217 subjects (90% of the sample) participated in a comprehensive health examination. The examinations were carried out by the Mobile Clinic of the Social Insurance Institution in 40 study areas throughout the country. Information was elicited about health status and morbidity, and about various factors related to these, including risk factors, symptoms, health habits, lifestyles, and social and other living conditions. Information was also obtained through questionnaires checked and interviews performed by specially trained nurses, by medical examinations, and by means of biochemical, functional and anthropometric measurements (Aromaa et al., 1989). Of the 7217 participants, 5461 subjects (2805 women and 2656 men) aged 30–59, and of them, 5087 (93.2%) (2623 women, 2464 men) constituted the study population of the present study.
Variables
Information collected through questionnaires and interviews covered demographic and health-related data as follows: age, gender, native tongue (Finnish or Swedish), migration (migration from another municipality to the current home municipality; yes or no), residential stability (longer than 1 year in the current home municipality or less), type of residence (urban or rural), marital status (married/cohabiting or single), socio-economic status (white or blue collar/other, including housewives, unemployed and pensioners), household income (income quintiles), level of education (high school or less than high school), years of education (0–8, 9–12 or >12 years), employment status (employed or unemployed), family size (n), close friends (n), marital relations (satisfactory or unsatisfactory), trust in family relations (‘Are you satisfied with the trustful relationships with your family relations?’; yes or no), trust in close friends (‘Are you satisfied with the trustful relationships with your close friends?’; yes or no), alcohol consumption (calculated as quantity of absolute alcohol per week; 0–94 g or >94 g equaling two bottles of wine per week), tobacco smoking (yes or no), leisure physical activity (frequently or less/none), mental health status according to the General Health Questionnaire (GHQ) (0–4 or >4) (Goldberg, 1972), self-reported chronic diseases reducing working capacity (yes or no), self-rated functional disability (yes or no), medication (yes or no), self-rated physical fitness (good or poor) and self-rated health (good or fairly good = good; moderate, rather poor, or poor = poor). Weight and height were measured for body mass index (kg/m2) and used for obesity with the cut-off point of 30 kg/m2 (Table 1).
Baseline characteristics of the participants
| Characteristic | All | Women | Men |
|---|---|---|---|
| n = 5087 | n = 2623 | n = 2464 | |
| Mean age (years) | 43.8 | 44.1 | 43.6 |
| Body mass index (kg/m2) | 25.6 | 25.4 | 25.8 |
| Rural residence (%) | 21.9 | 21.2 | 22.6 |
| Married/cohabiting (%) | 81.2 | 79.4 | 83.2 |
| High school education (%) | 17.7 | 15.2 | 20.3 |
| Socio-economic status (white collar) (%) | 56.1 | 52.5 | 59.9 |
| Unemployed (%) | 10.6 | 11.1 | 10.1 |
| Tobacco smoking (%) | 20.8 | 10.0 | 32.3 |
| Alcohol consumption (>94 g/week) (%) | 15.3 | 3.7 | 27.5 |
| Frequent leisure physical activity (%) | 17.8 | 15.5 | 20.2 |
| Good self-rated health (%) | 55.7 | 56.8 | 54.6 |
| Mental health status (GHQ score >4) (%) | 27.0 | 28.7 | 25.1 |
Information on the extent of leisure participation was elicited with a questionnaire. Engagement in clubs and voluntary societies, cultural and sports attendance (visiting theatre, cinema, concerts, art exhibitions, sports events or similar), religious engagement (church attendance, other religious events), outdoor and productive activity (hiking, hunting, fishing, gardening or similar), studying, cultural interests (reading books, listening to recorded music) and hobby activity (drama, singing, photography, painting, collecting, handicraft or similar) were recorded. For responses, the frequency options were once or more every week = 3, once or a couple times every month = 2, once or occasionally every year = 1, less frequently or never = 0. A sum score of leisure participation (minimum = 0, maximum = 21) was constructed by multiplying the number of activity classes (0–7) with the frequency score (0–3).
Follow-up
Because of the Finnish population register, the sampling procedure and follow-up are simple, since each individual in Finland has a personal identification number recorded in all registers (Statistics Finland, 2005). That identification number was used for record linkages in the follow-up. Mortality data were derived from the Finnish National Registry for Cause of Death, which has 100% coverage (Statistics Finland, 2005). Mortality of the survey participants has been followed up since the baseline examination in 1978–1980. Of the cohort (n 5087), 962 subjects (632 men and 330 women) died during the 20 follow-up time.
Data analysis
First, we divided the population in three groups according to the quartiles of sum score in leisure participation (the lowest quartile = scarce = 0–6), two intermediate quartiles = 7–11 and the highest quartile = abundant = 12–21). Secondly, we applied multivariate Cox proportional hazard models for survival to identify and to control for relevant health-related covariates and their interactions with leisure participation measures. Thirdly, controlling for the health-related variables that significantly predicted survival and/or confounded the relationship between leisure participation scores and survival, we calculated hazard ratios with 95% confidence intervals (CIs). The SAS® procedures (PHREG, LIFETEST) were applied for statistical calculations.
RESULTS
At the end of the follow-up, 68.5% of the subjects with scarce leisure participation and 84.6% of the subjects with intermediate and abundant participation were alive. Table 2 shows the survival analysis in the unadjusted model, in the adjusted model and in the adjusted model with exclusion of death cases during the first 3 years. Compared with scarce leisure participation, the hazard ratios of the risk of death for intermediate or abundant participation were significant, even after adjustments for the statistically significant covariates, i.e. age, (gender), tobacco smoking, alcohol use, obesity, self-rated health and diagnosed chronic disease. Inclusion of the death cases occurring only after a 3-year follow-up did not notably alter the association in men but reduced the association in women.
Hazard ratios and 95% CIs for the risk of death, comparing individuals with scarce (lowest quartile) leisure participation. (Intermediate = two middle quartiles, abundant = highest quartile)
| Adjustment | Hazard ratio, 95% CIs | |||||
|---|---|---|---|---|---|---|
| All | Women | Men | ||||
| n = 5087 | n = 2623 | n = 2464 | ||||
| Model 1 | ||||||
| Intermediate | 0.52, 0.45–0.60 | 0.51, 0.40–0.60 | 0.55, 0.46–0.65 | |||
| Abundant | 0.36, 0.30–0.44 | 0.40, 0.29–0.54 | 0.37, 0.29–0.47 | |||
| Model 2 | ||||||
| Intermediate | 0.77, 0.67–0.89 | 0.75, 0.58–0.98 | 0.80, 0.67–0.95 | |||
| Abundant | 0.64, 0.53–0.78 | 0.64, 0.47–0.88 | 0.66, 0.52–0.84 | |||
| Model 3 | ||||||
| Intermediate | 0.83, 0.71–0.96 | 0.84, 0.65–1.09 | 0.82, 0.69–0.99 | |||
| Abundant | 0.71, 0.58–0.86 | 0.71, 0.51–0.99 | 0.71, 0.55–0.92 | |||
Model 1 = unadjusted model, follow-up of 20 years.
Model 2 = adjusted for (gender), age, tobacco smoking, alcohol consumption, self-rated health, diagnosed chronic disease and obesity, follow-up of 20 years. Test of Model 2: Wald χ2 23.65, df 2, P < 0.0001 (all); Wald χ2 8.22, df 2, P = 0.016 (women); Wald χ2 12.61, df 2, P = 0.0018 (men).
Model 3 = Model 2, excluding 3 first years of follow-up. Test of Model 3: Wald χ2 12.54, df 2, P = 0.0019 (all); Wald χ2 4.24, df 2, P = 0.12 (women); Wald χ2 8.13, df 2, P = 0.017 (men).
In men and women, age, tobacco smoking, chronic disease and obesity were predictive of survival (or mortality). In men, but not in women, alcohol use and self-rated good health were also associated with survival. In addition, self-rated health was identified as an effect-modifying factor in women. Among the women with good health, the hazard ratios for the risk of death were insignificant: 0.83, 0.50–1.37 (intermediate) and 0.97, 0.57–1.64 (abundant).
Entering native tongue, type of residence, migration, marital status, household income, employment status, socio-economic status, education level, number of close friends, trustful relations and mental health status score to the adjusted models, or deleting outdoor and productive activity and studying from the sum score of the leisure participation did not significantly alter the hazard ratios.
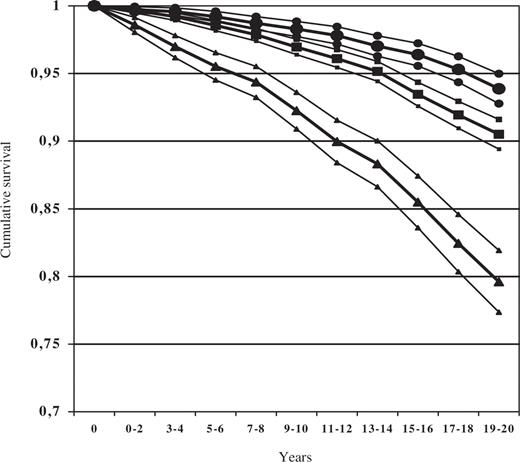
Cumulative survival of the subjects with scarce, intermediate and abundant leisure participation is shown in Figure 1. Adjusted for statistically significant covariates (age, gender, obesity, tobacco smoking, alcohol use, self-rated health and diagnosed chronic disease) in the Cox survival model, the subjects with abundant (the highest quartile) leisure participation survived significantly better than the subjects in the intermediate quartiles. The latter, furthermore, survived significantly better than the subjects with scarce (the lowest quartile) leisure participation.
Cumulative survival (bold line)±95% confidence bands (between thin lines) for abundant (•), intermediate (▪) and scarce (▴) leisure participation.
DISCUSSION
In a representative sample of middle-aged Finns, we found a clear association between leisure participation and survival. Abundant leisure participation predicts survival, whereas scarce leisure participation is associated with higher risk of death. The relative risk of death for the group with abundant participation is two-thirds of that for the reference group with scarce participation. Also, compared with the reference group, people with intermediate leisure participation have significantly better chances to survive. However, there is a gender-related deviation in the link between leisure participation and survival since the association is lacking in healthy women.
Adjusted for all statistically significant covariates (age, gender, obesity, tobacco smoking, alcohol use, self-rated health and diagnosed chronic disease) in the Cox survival model over 20 years, the subjects who belonged to the highest quartile of leisure participation score survived significantly better than the subjects who belonged to the intermediate quartiles. The latter survived significantly better than the subjects who belonged to the lowest quartile of leisure participation score. In plain words, people who are actively engaged in clubs, voluntary societies, hobbies or in cultural, recreational and civic activities seem to live longer than people with moderate leisure participation, and people with no or little leisure participation live the shortest life. Conventional health-related risk factors do not explain these associations.
Previous longitudinal surveys have shown that social participation, either in terms of taking actively part in organized groups and associations (Dalgard and Håheim, 1998; Glass et al., 1999; Lutgendorf et al., 2004; Sundquist et al., 2004) or in terms of any general leisure activity (Bygren et al. 1996; Konlaan et al., 2002) is of importance as a predictor of survival. Social and productive activities were as effective as fitness activities in lowering the risk of death in an American elderly community sample (Glass et al., 1999). Based on the Berkman–Syme social network index (including marital status, sociability, religious group affiliation and membership in social or community organizations), Eng and co-workers were able to prove that religious service attendance and social group participation were protective against all-cause mortality in men (Eng et al., 2002).
These surveys show that individuals' social participation or cultural participation per se has a strong positive effect on their survival, whereas social support has a lesser impact, and the surveys corroborate the potential benefits of social capital for health.
The authors of the previous longitudinal surveys seem to substantiate their empirical studies on the theory of social support (House and Landis, 1988) rather than on the theory of social capital (Macinko and Starfield, 2001; Baum and Ziersch, 2003; Fassin, 2003; Kawachi et al., 2004; Szreter and Woolcock, 2004). However, Glass and co-workers suggest that social and productive activities reinforce relationships, as well as norms of reciprocity and mutuality (Glass et al., 1999).
Strengths and limitations
This longitudinal survey is one of the first studies on the topic based on a representative population of a whole country. The sample of the Mini-Finland Health Survey is representative of the Finnish adult (30 years or over) population (Aromaa et al., 1989). Mortality of the survey population has been systematically followed up since the baseline examination in 1978–1980. Information was obtained from the central statistical office, Statistics Finland (Statistics Finland, 2005), and this report covers the all-cause deaths between 1978 and 2002. However, the long follow-up period can also be a limitation in our study. Some covariates are time dependent (e.g. tobacco smoking and alcohol consumption) but no interim information about the participants was available after the baseline interview and examinations. It must also be pointed out that the economic depression in Finland during the 1990s may have influenced the living conditions and social networks in a way that cannot be traced in this survey. In our study, measures of leisure participation were assessed to a sufficient extent (Hanson et al., 1997), but so far we know, the long-term stability of leisure participation measures has not yet been reported.
Partly, we followed the theoretical guidelines of Bourdieu (Bourdieu, 1980; Bourdieu, 1986) and Portes (Portes, 1998; Portes, 2000) who view social capital as an individual characteristic that can be measured with activities in networks and individuals' participation. Lindström has recently discussed different definitions of social participation in relation to the theory of social capital and defended the use of individual-level measures of social participation (Lindström, 2005). According to Portes (Portes, 2000), social capital is defined as a source of social control, a source of family-mediated benefits, and a source of resources mediated by non-family networks. One might ask how outdoor and productive activity, studying, cultural activities and hobbies are related to non-family networks and social interactions. In Finland they are, in fact, because these leisure voluntary activities are commonly performed together with fellow citizens. Studying on one's leisure time takes place in study groups at adult education institutes. Reading books and listening to recorded music reflect the significance of public libraries for social participation and social capital (Goulding, 2004).
Our survey started with a comprehensive health examination of each participant. As expected, self-reported and self-rated health predicts survival and modifies leisure engagement but the significant protective effect of the leisure activity endures. Although our findings suggest causality from leisure participation towards health, this does not rule out that leisure participation in itself may be a component of health. Especially in women, this reservation is warranted due to the reduced association after the inclusion of death cases only after a 3-year follow-up. In addition, an effect-modifying interaction was found between self-rated health and leisure participation score in women, i.e. leisure participation was associated with survival in unhealthy women but not in healthy women.
Leisure participation and survival
The sum score of leisure participation seemingly includes features of conventional health-related factors that might per se explain the survival rates. For example, leisure physical activity, which is an explanatory factor for socio-economic differences in mortality (Lindström et al., 2001), may have been concealed in the leisure participation score that includes outdoor activities, e.g. hunting and hiking. We found, however, that even with the outdoor and productive items excluded, the sum score of leisure activities predicts survival significantly and independently. Other studies have also found a link between survival and leisure participation that entail no physical exertion (Bygren et al., 1996; Glass et al., 1999; Konlaan et al., 2002).
In a cross-sectional study, the level of education was strongly related to the level of individual civic participation (Baum et al., 2000). When added to the Cox survival model, neither socio-economic status nor education changed the survival rates in our study. This is important since socio-economic status is known to strongly predict survival.
In conclusion, leisure participation in social, cultural and religious activities predicts survival (or the risk of death) in middle-aged Finns, especially in men. Gender-related effects of leisure participation on survival warrant further studies on the quality and effects of leisure activities separately for men and women. Health promotion programmes should not only focus on conventional health risk factors but also lower threshold of leisure participation in social, cultural and religious activities. Public policy actions that reduce barriers to leisure participation would be important interventions for elderly people and for people in institutions.
The online version of this article has been published under an open access model. Users are entitled to use, reproduce, disseminate, or display the open access version of this article for non-commercial purposes provided that: the original authorship is properly and fully attributed; the Journal and Oxford University Press are attributed as the original place of publication with the correct citation details given; if an article is subsequently reproduced or disseminated not in its entirety but only in part or as a derivative work this must be clearly indicated. For commercial re-use, please contact journals.permissions@oxfordjournals.org
Funding to pay the Open Access publication charges for this article was provided by National Public Health Institute of Finland.
REFERENCES
Aromaa, A., Heliövaara, M., Impivaara, O., Knekt, P., Maatela, J., Joukamaa, M. et al. (
Baum, F. E., Bush, R. A., Modra, C. C., Murray, C. J., Cox, E. M., Alexander, K. M., et al. (
Baum, F. E. and Ziersch, A. M. (
Berkman, L. F., Glass, T., Brissette, I. and Seeman, T. E. (
Bourdieu, P. (
Bourdieu, P. (
Bygren, L. O., Benson, B. and Johansson, S.-E. (
Coleman, J. (
Dalgard, O. S. and Håheim, L. L. (
Eng, P. M., Rimm, E. B., Fitzmaurice, G. and Kawachi, I. (
Fassin, D. (
Glass, T. A., Mendes de Leon, C., Marottoli, R. A. and Berkman, L. F. (
Goldberg, D. (
Goulding, A. (
Hanson, B. S., Östergren, P.-O., Elmståhl, S., Isacsson, S.-O. and Ranstam, J. (
House, J. S., Landis, K. R. and Umberson, D. (
Hyyppä, M. T. and Mäki, J. (
Hyyppä, M. T. and Mäki, J. (
Hyyppä, M. T. and Mäki, J. (
Kawachi, I., Kennedy, B. P. and Glass, R. (
Kawachi, I., Kim, D., Coutts, A. and Subramanian, S. V. (
Kawachi, I., Kennedy, B. P., Lochner, K. and Prothrow-Stith, D. (
Konlaan, B. B., Theobald, H. and Bygren, L.-O. (
Lindström, M., Hanson, B. S. and Östergren, P.-O. (
Lindström, M. (
Lutgendorf, S. K., Russell, D., Ullrich, P., Harris, T. B. and Wallace, R. (
Macinko, J. and Starfield, B. (
Portes, A. (
Putnam, R. D. (
Skrabski, Á., Kopp, M. and Kawachi, I. (
Sundquist, K., Lindström, M., Malmström, M., Johansson, S.-E. and Sundquist, J. (