


Abstract
Background The hypothesis that economic growth has been the principal source of mortality decline during the 20th century in the United States is investigated. This hypothesis is consistent with the large epidemiological literature showing socioeconomic status to be inversely related to health status and unemployment associated with elevated morbidity and mortality rates. Despite evidence over many years showing economic growth, over at least a decade, to be fundamental to mortality rate declines and unemployment rates showing lagged, cumulative effects on mortality rate increases, a recent paper argues that the impact of economic growth is to increase the mortality rate.
Methods This study utilizes age-adjusted mortality rates over 1901–2000 in the United States as the outcome measure, while independent variables include real GDP per capita in purchasing power parity, the unemployment rate, and the employment to population ratio. A basic interaction model is constructed whereby (i) real GDP per capita, (ii) the unemployment rate, and (iii) the multiplicative interaction between real GDP per capita and the unemployment rate are analysed in relation to age-adjusted mortality rates. The Shiller procedure is used to estimate the distributed lag relations over at least a decade for variables (i), (ii), and (iii). The error correction method is used to examine these relations for both levels and annual changes in independent and dependent variables.
Results While GDP per capita, over the medium- to long-term, is strongly inversely related to mortality rates during 1901–2000, in the very short term—i.e. within the first few months—rapid economic growth is occasionally associated with increased mortality rates estimated in annual changes. With respect to the unemployment rate, the first year (without lag) will frequently be associated with a decrease in mortality, but thereafter, and at least for the following decade, the effect is to increase the mortality rate. Thus, the net effect of increased unemployment is a substantial increase in mortality. This is also reflected in the entirely negative relation between the cumulative effects of the employment to population ratio and mortality rates over a decade.
Conclusions Economic growth, cumulatively over at least a decade, has been the central factor in mortality rate decline in the US over the 20th century. The volatility of rapid economic growth as it departs from its major trend, has a very short-term effect (within a year) to increase mortality—partly owing to adaptation to new technology and the adjustment of the formerly unemployed to new jobs, social status, and organizational structures.
Socioeconomic status, unemployment, and health
It is now among the firmest of epidemiological findings, across industrialized societies, that socioeconomic status is inversely related to health status. In particular, higher income has been routinely shown to be a significant inverse predictor of morbidity and mortality.1–10 Similarly, the large and growing literature on unemployment and health is highly consistent in demonstrating elevated morbidity and mortality associated with unemployment and withdrawal from the labour force.11–18 It follows that economic growth, the major source of socioeconomic status improvement, should lead to lower morbidity and mortality rates, whereas economic decline—especially in conjunction with high unemployment—should increase mortality rates.
The macro level
At the macro, i.e. national, level Thomas McKeown has demonstrated the fundamental importance of economic development to the decline—and near disappearance—of the classic infectious and childhood diseases as significant causes of death from the second half of the 19th century to the Second World War in England and Wales.19,20 Over 1860–1950, the importance of economic growth to mortality decline is substantially owing to improvements in nutrition, sanitary engineering, and housing construction. Subsequently, it has been observed since at least the 1970s that the long-term effect of economic growth is a central source of mortality reduction, even after the Second World War in the US, the UK and the other 14 original EU countries, Canada, and Japan.21–25 It has also been repeatedly shown at the national level that unemployment is a significant predictor of higher mortality rates over a period of at least a decade in many industrialized countries.21–29
How then are we to understand findings reported by Tapia Granados30 that ‘economic expansions’ are related to higher mortality? Many epidemiologists may find this report incomprehensible on the grounds that the findings are incoherent—i.e. entirely inconsistent with the large epidemiological literature on low socioeconomic status and poor health, on the one hand, and on the relationship of unemployment and diminished health, on the other. The estimates by Tapia Granados are presented in simple correlations, without regard to lag estimation or the usual multivariable controls for confounding and interaction, or the standard econometric tests including those for residual autocorrelation and unit roots, and even without capitation of GDP itself.
Beyond these inconsistencies and methodological omissions, per capita economic growth over the 20th century cannot be positively related to increased mortality rates (age-adjusted), since these two trend-like variables are strongly inversely related to each other as is easily observed (Figure 1). In comparison, economic growth rates on an annual basis, without any lag, show a very weak, but positive relation to age-adjusted mortality rates (Figure 2). Furthermore, economic expansions cannot really be related to mortality increases over the 20th century because, during both expansion and recession years, age-adjusted mortality rates have, on average, fallen. During the 20th century, 72 years, or nearly three-quarters of the century, have been represented by economic growth (‘expansions’). If economic growth literally caused mortality to rise, then age-adjusted mortality rates would have shown an increased trend over the 20th century rather than a rapid and massive decline.
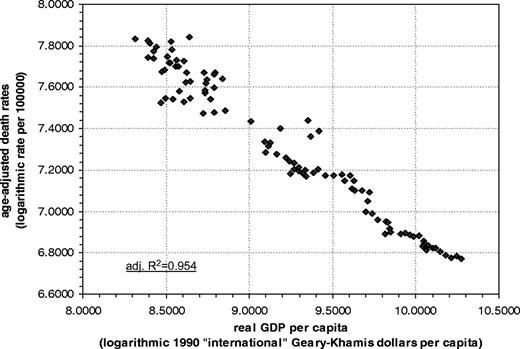
Relation of real GDP per capita to age-adjusted death rates, US 1900–2000 (natural logarithms)
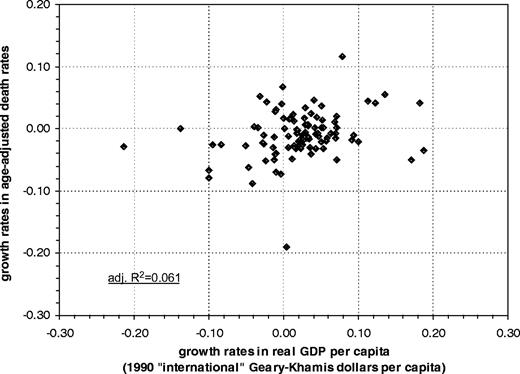
Relation of growth rates in real GDP per capita to growth rates in age-adjusted death rates, US 1901–2000
Long-term impact of economic growth on mortality decline
What is the basis for the statement that economic growth is the ‘central’ precursor of mortality decline in the 20th century? Many would immediately turn their attention to the fundamental contributions of economic growth to the reduction of poverty—through the elevation of real incomes via basic earnings and government and employer contributions to the ‘social safety net’. For a broader view, it is important to keep in mind investment in the sciences and industrial technologies that directly minimize harm to health, including improved ergonomics, injury control, and reduction of toxic emissions. Of enormous importance is the considerable investment in new medicines, types of surgery and prosthetics, structure of care and hospital facilities and ambulance services.
Additionally, there is the considerable investment, during the last 30 years, in facilities catering to the requirements of the disabled and an older (and in the long-term more frail) population; these include housing, transportation access, and working conditions. More recently, we have had investment in the information produced by epidemiological researchers on the importance of ‘lifestyle’, including various aspects of consumption (calories, fats, vegetables, and fruits), as well as alcohol and tobacco use and exercise—all involving changes that have become staples of western industrialized culture. In summary, the capacity for investment in new technologies, health sciences, and education have made it possible to create a civilization in which health and life-expectancy outcomes become increasingly predictable.
Growth in GDP and mortality rates
Despite considerable evidence of the fundamental importance of economic growth to the increased health and life expectancy of industrialized country populations, is it likely that a positive relationship exists between GDP growth rates and mortality growth rates? When answering this question, it is important to bear in mind that the association reported by Tapia Granados refers to an extremely short-term relation—i.e. without lag and without any trends—that connotes a nearly simultaneous occurrence of higher GDP growth rates and higher mortality rates increasing during the same year, but without reference to long-term or even medium-term relations. The epidemiologist would have considerable difficulty interpreting such a relationship, because essential to the inference of causal relations is the time precedence criterion—i.e. the occurrence of the independent variable prior to that of the dependent variable.
Since the long-term relationship (i.e. over at least 10 years) between GDP per capita and declining mortality rates has been observed several times,21–23,31 and is essential to the long-term trends in mortality reduction, it is clear that economic growth is inversely related to mortality. Under these conditions, is it likely that the zero-lag relation between GDP and mortality rates is actually positive? It is possible that these two observations are consistent with each other and this hypothesis has been published by the present author.21,23,31 The underlying concept is that while medium- to long-term economic growth is the central source of improvement in life expectancy, the earliest phase of that growth—i.e. within the first year—can actually require increased adaptation.
This phenomenon has been referred to as the distinction between the trends in economic growth vs ‘rapid’ economic growth.23,31 These were not the first citations of the positive relation between economic upturns at lag zero and increased mortality. The initial observation was by Dorothy Thomas,31 utilizing the GDP national accounting method, which had recently been created by her colleague Simon Kuznets. Thomas reported the relationship without attempting an explanation. The original interpretation offered by the present author was based on the idea that while the long-term trend of GDP per capita was the fundamental source of increased life expectation, the volatility of changes in that growth were—in the very short term—a source of increased mortality.23 In other words, it is the extent of unpredictable change itself, as compared with sustained growth—or, in classical economic terms ‘trend growth’—that contributes to mortality in the very short term. This formulation was built on Durkheim's concept of anomie as related to economic fluctuations, with both rapid economic growth and recession producing mental distress.32
Since 1979, the paradox of a positive relationship between GDP per capita and age-adjusted mortality rates in the US has undergone further exploration. Potentially, the most relevant and powerful explanation lies in Schumpeter's identification of the capacity for ‘creative destruction’ that is the source of economic growth—namely, innovations. Innovations are the basis of improvement in both productivity and the quality of goods and services,33 but they are also the source of stress in social change. Schumpeter's destructive element lies in the elimination of jobs and termination of businesses that are unable to compete with more up-to-date innovations and procedures. Such innovations are introduced by way of investment, especially during periods of the most rapid economic growth—i.e. economic upturns. Thus, in the very short term, the introduction of new technologies within firms or the establishment of new firms that embody the newer technologies will impose on employees the learning curves or ‘growing pains’ of organizational adjustment. This will mean adaptation to new ways of working and the acquisition of new skills as well as the threat of loss-of-job status and income in a changing social hierarchy. At the same time, this period of rapid economic growth is the time at which the speed, intensity, and volume of production will be at it's highest since aggregate demand is at a maximum. The issue of work intensity is now prominent in the literature on work stress as pertains to injuries and cardiovascular illness.34,35
The intensity and overall workload (productivity per worker) also increases during the economic upturn for another important reason. The unemployment rate is known as a ‘lagging’ business cycle indicator. This means that it continues to increase or at least remain high after recession is over—i.e. in the upturn phase of the business cycle. Unemployment remains high at this time because employers are still reluctant to hire, or rehire former, employees since they do not yet have an indication that economic growth will be sustainable. The implication is that, despite rising orders for work, new employees will not be brought on very rapidly and the work staff will be assigned a greater volume of work despite potentially increasing stress levels.36 Tapia Granados30 also follows Ruhm37 in proposing that economic upturns lead to elevated consumption of alcohol, tobacco, calories, etc. It is true that such consumption patterns have been shown to influence chronic disease mortality—but they do so over a minimal lag period of 5–10 years and are not specifically related to economic upturns.38–43
Long-term significance of unemployment
In considering the potential impact in the US of unemployment on ill health, attention should be directed to the duration of unemployment. In particular, since the Second World War in the US ∼50% of the unemployed remain so for <5 weeks. This means that for a very large proportion of the unemployed, the return to employment—whether or not to the same firm—occurs in little more than a month. It would not seem that these short-term unemployed would be under major stress owing to loss of income, social status, or social relationships as to be at considerably greater risk for poor health or mortality. It is plausible that the stress of job change—i.e. adaptation to the requirements of a new position—could involve additional health risks.
Of substantially greater importance for health is unemployment lasting at least 6 months and certainly more than 1 or 2 years. The presumption is that these longer-term unemployed suffer considerable loss-of-job status, skills, income, social insurance and are at risk for long-term poverty. The evidence indicates that the longer-term unemployed are at major risk for downward social mobility, i.e. a substantial decline in socioeconomic status. The basic epidemiological literature informs us that a considerable reduction in the level of socioeconomic status is a significant risk to health and life expectancy. The literature on the long-term unemployed also shows increased exposure to alcoholism and use of other psychotropic substances such as tobacco and less expensive/nutritious foods. Equally important, the long-term unemployed are especially at risk for damaged family and friendship relations, quite apart from the social isolation induced by the loss of employment itself. Therefore, a time lag of at least a decade for increased health risk among the long-term unemployed is plausible and has been demonstrated for the UK.23,44,45
Interaction between unemployment and economic growth
The economist Okun has formulated a principle (Okun's ‘law’)46 which specifies the potential reduction in the unemployment rate that would result from a prior specified increase in economic growth. This intrinsic relationship between economic growth and unemployment means that the experience of recession in a population is a joint function of income and employment loss.
If we are to represent the combined influence of economic growth and unemployment on subsequent mortality, we require a model that will include the (multiplicative) interaction of these two variables. In the unemployment–economic-growth situation, the population is most at risk for health damage when GDP per capita is low and unemployment is simultaneously high. This result is partly owing to the fact that two damaging health risks are interactively more harmful than one and, as indicated above, the first few months of a period of economic growth can carry health risks owing to the introduction of innovations, high work pressure on employees and the reintegration of the formerly unemployed.
Time-series model
This is the first century-long model of mortality rates based essentially on economic factors. It is nevertheless a preliminary model in that it consists of only three principal independent variables: (i) the long-term effects of economic growth over 0–11 years, (ii) the long-term effects of unemployment over 0–11 years, and (iii) the interactive effect of unemployment and GDP per capita over 0–11 years. For variables (i) and (iii) we hypothesize a negative sign, and for variable (ii) a positive sign. This model, where all variables are logarithmically transformed, is examined in relation to age-adjusted mortality for the US over the period 1901–2000. Dummy variables are used to deal with potential external shocks to the mortality rate and to the economy owing to the First and Second World Wars, identifying the years 1918 and 1945 as those with the largest numbers of military personnel on active duty. (1918 is also the peak year of the influenza pandemic.) We utilize the error correction method47 by which are estimated both a set of relationships between the levels of the independent variables and levels of mortality rates, and a first difference (annual change) model for the independent and dependent variables which includes the residual term from the initial level model. While the level model accounts for the fundamental non-linear, trend-like, and large oscillating movements in the age-adjusted mortality rate, the same variables explain nearly 60% of the annual changes in mortality rates (see Table 1 and Figures 3 and 4).
Multivariable relations between macroeconomic factors and age-adjusted mortality rates in the US, 1901–2000 (all variables in logarithmic form)
| Constant | Time trend | Age-adjusted mortality (lag 1 year) | Dummy 1918 | Dummy 1945 | Interaction GDP * UR (lags 0–11 years) | Unempl. rate (lags 0–11 years) | GDP per capita (lags 0–11 years) | Residual from level model (lag 1 year) | R bar square | Durbin-Watson | ||||||||||||
|---|---|---|---|---|---|---|---|---|---|---|---|---|---|---|---|---|---|---|---|---|---|---|
| Model 1 | ||||||||||||||||||||||
| Level | ||||||||||||||||||||||
| Coefficient (P-value) | 7.557 (<0.001)*** | −0.007 (0.776) | 0.098 (<0.001)*** | −0.067 (0.004)** | −0.517 (<0.001)*** | 0.468*** | 0.994 | 2.240 | ||||||||||||||
| First difference | ||||||||||||||||||||||
| Coefficient (P-value) | 0.002 (0.524) | 0.093 (<0.001)*** | 20.057 (0.007)*** | 20.604 (<0.001)*** | 0.547 (,0.001)*** | 20.575 (<0.001)*** | 0.548 | 2.276 | ||||||||||||||
| Model 2 | ||||||||||||||||||||||
| Level | ||||||||||||||||||||||
| Coefficient (P-value) | 8.44 (<0.001)*** | −0.112 (0.118) | 0.098 (<0.001)*** | −0.080 (<0.001)*** | −0.335 (0.004)** | 0.280 (0.016)* | −0.247 (0.019)* | 0.994 | 2.262 | |||||||||||||
| First difference | ||||||||||||||||||||||
| Coefficient (P-value) | 0.002 (0.601) | 0.097 (<0.001)*** | 20.068 (0.001)** | 20.311 (0.012)* | 0.251 (0.038)* | 20.277 (0.001)** | 20.566 (<0.001)*** | 0.571 | 2.270 | |||||||||||||
P < 0.05
P < 0.01
P < 0.001.
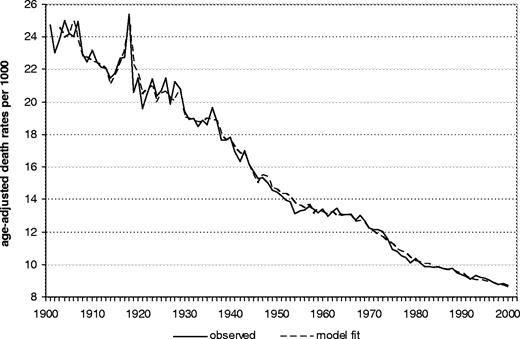
Multivariate relations between macroeconomic factors and age-adjusted mortality rates in the US, 1901–2000, level model
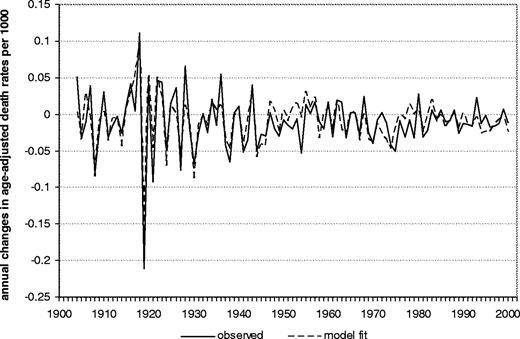
Multivariate relations between macroeconomic factors and age-adjusted mortality rates in the US, 1904–2000, first difference model
The weighted sums of the lagged variables—estimated by the Shiller procedure48—of the three variables distributed over 0–11 years (GDP per capita, unemployment rate, interaction of GDP per capita and the unemployment rate), are taken to represent their cumulated impact. It is found that the 0–11 year cumulative impact of GDP per capita is significantly inversely related to mortality; and the 0–11 year cumulative impact of the unemployment rate is significantly positively related to mortality. Similarly, as hypothesized, the multiplicative interaction of GDP per capita and unemployment cumulated over 0–11 years shows a significant negative sign (see Table 1).
Conclusions
Economic growth, cumulatively over at least a decade, is the central factor in mortality rate decline in the US over the 20th century. However, in the very short term—i.e. within the first few months of that decade—rapid economic growth is associated with increased mortality, probably owing to the initial stresses of adaptation to new technology in combination with greater work volume, speed, and duration. This very short-term effect disappears within a year and the medium- to long-term lagged effect of economic growth is entirely related to mortality decline.
Similarly, with respect to the unemployment rate in the US, the first year (without lag) will frequently show a negative sign in relation to mortality, but thereafter, and at least for the following decade, the effect is to increase the mortality rate. Thus, the net effect of increased unemployment is a substantial increase in mortality. But even the apparent short-term mortality rate increase related to reemployment is probably owing to the stresses of adaptation to new employment in the face of rapid economic growth. It can be argued that this need to adapt to new work by the formerly unemployed—owing to their having been made unemployed as a result of the previous recession—is an intrinsic part of the health damage attributable to unemployment. Thus, unemployment over a cumulative time period is strongly positively related to mortality increases.
To argue that economic expansions increase mortality is to emphasize peripheral effects to the exclusion of the main health effects of economic growth. It is analogous to pointing out the side-effects of antibiotics or surgery without mentioning their primary life-saving properties. An even closer analogy might be to claim that increased hospital, school, or home construction brings increased death without comprehending the life-sustaining effects of health care, education, or housing. Thus, it is crucial to place the health impact of the small oscillations represented by annual changes in economic growth into the broader context of the principal medium- and long-term trends of economic development.
Data sources
Age-adjusted death rates 1900–1999: Centers for Disease Control. National Vital Statistics Reports, Vol. 49, No. 9, pp. 3–4; September 2001.
Age-adjusted death rates 2000: Centers for Disease Control. National Vital Statistics Reports, Vol. 50, No. 15, Deaths: Final Data for 2000, Table 1, p. 18; September 2002.
GDP: Maddison A., OECD Development Centre Studies: The World Economy: Historical Statistics. OECD, Paris; 2003. Updated by: Maddison A., University of Groningen, Faculty of Economics. Available at: http://www.eco.rug.nl/~Maddison/ (Accessed January 22, 2004).
Unemployment 1890–1946: Mitchell BR. International Historical Statistics, The Americas 1750–2000. 5th ed. New York: Palgrave Macmillan; 2003.
Unemployment 1947–2003: Bureau of Labor Statistics. Labor Force Statistics from the Current Population Survey. UNEMP. RATE—Civilian labor force, Series ID: LFU21000000 (1). Available at: http://www.bls.gov/cps/home.htm (Accessed December 10, 2004).
Employment 1900–1938: U.S. Department of Commerce. Historical Statistics of the United States, Colonial Times to 1970. Part 1, Series D127, p. 137. U.S. Department of Commerce, Bureau of the Census. Washington D.C.: U.S. Government Printing Office; 1975.
Employment 1939–2002: Bureau of Labor Statistics. Current Population Survey. total nonfarm employment, Series Id: CEU0000000001. Available at: http://www.bls.gov/ces/home.htm#data (Accessed March 20, 2005).
Population 1900–1999: U.S. Census Bureau, Population Division, Population Estimates Program, Internet Release Date: April 11, 2000, Revised date: June 28, 2000. Available from: URL: http://eire.census.gov/popest/archives/pre1980.php (Accessed January 30, 2004).
Population 2000: Table ‘annual population estimates by state’, Available at: http://eire.census.gov/popest/data/states/tables/NST-EST2003-01. php (Accessed January 30, 2004).
References
Sorlie P, Rogot E, Anderson R, Johnson NJ, Backlund E. Black–white mortality differences by family income.
Tresserras R, Canela J, Alvarez J, Sentis J, Salleras L. Infant mortality, per capita income, and adult illiteracy: an ecological approach.
Backlund E, Sorlie PD, Johnson NJ. The shape of the relationship between income and mortality in the United States. Evidence from the National Longitudinal Mortality Study.
Gornick ME, Eggers PW, Reilly TW et al. Effects of race and income on mortality and use of services among Medicare beneficiaries.
McDonough P, Duncan GJ, Williams D, House J. Income dynamics and adult mortality in the United States, 1972 through 1989.
Davey-Smith G, Neaton JD, Wentworth D, Stamler R, Stamler J. Mortality differences between black and white men in the USA: contribution of income and other risk factors among men screened for the MRFIT. MRFIT Research Group. Multiple Risk Factor Intervention Trial.
Schalick LM, Hadden WC, Pamuk E, Navarro V, Pappas G. The widening gap in death rates among income groups in the United States from 1967 to 1986.
Martikainen P, Makela P, Koskinen S, Valkonen T. Income differences in mortality: a register-based follow-up study of three million men and women.
Singh GK, Siahpush M. Increasing inequalities in all-cause and cardiovascular mortality among US adults aged 25–64 years by area socioeconomic status, 1969–1998.
Tausky C, Piedmont EB. The meaning of work and unemployment: implications for mental health.
Anda R, Williamson D, Jones D, Macera C, Eaker ED, Glassman A et al. Depressed affect, hopelessness, and the risk of ischaemic heart disease in a cohort of US adults.
Dooley D, Catalano R, Wilson G. Depression and unemployment: panel findings from the Epidemiologic Catchment Area study.
Hallsten L, Grossi G, Westerlund H. Unemployment, labour market policy and health in Sweden during years of crisis in the 1990's.
Hammarstrom A, Janlert U, Winefield AH. Unemployment and health behaviour after leaving school: the influence of unemployment level. In: Sivik T, Byrne D, Lipsitt DR, Christodoulou CN, Dienstfrey H (eds), Psycho- Neuro- Endocrino- Immunology (PNEI), Proceedings of the 16th World Congress on Psychosomatic Medicine, Göteborg, Sweden, 24–29 August
Kasl SV, Jones BA. The impact of job loss and retirement on health. In: Berkman LF and Kawachi I (eds). Social Epidemiology. New York: Oxford University Press,
Bartley M, Plewis I. Accumulated labour market disadvantage and limiting long-term illness: data from the 1971–1991 Office for National Statistics' Longitudinal Study.
McKeown T. The Role of Medicine—Dream, Mirage or Nemesis. London: Nuffield Provincial Hospital Trust,
Brenner MH. Estimating the Social Costs of National Economic Policy: Implications for Mental and Physical Health and Criminal Aggression. Joint Economic Committee of the U.S. Congress. Washington, DC: US Government Printing Office,
Brenner MH. Estimating the Effects of Economic Change on National Health and Social Well-Being. Joint Economic Committee of the U.S. Congress. Washington, DC: Government Printing Office,
Brenner MH. Mortality and the National Economy: a review and the experience of England and Wales, 1936–1976.
Brenner MH. Mortality and economic instability: detailed analyses for Britain and comparative analyses for selected industrialized countries.
Brenner MH. Estimating the social cost of unemployment in the European Union and the United States. European Commission, Employment and Social Affairs,
Brenner MH, Mooney A. Economic change and sex-specific cardiovascular mortality in Britain 1955–1976.
Brenner MH. Unemployment, Employment and Public Health. European Commission, Employment and Social Affairs,
Tapia Granados JA. Increasing mortality during the expansions of the US economy,
Brenner MH. Industrialization and Economic Growth: estimates of their effect on the health of populations. In Brenner MH, Mooney A, Nagy TJ (eds). Assessing the Contributions of the Social Sciences to Health, 65–115. AAAS Symposium 26, Boulder, Colorado: Westview Press,
Schumpeter JA. Capitalism, Socialism and Democracy. New York: Harper,
Karasek R, Theorell T. Healthy work: stress, productivity, and the reconstruction of working life. New York
Siegrist J, Peter R. The effort-reward imbalance model. The workplace and cardiovascular disease.
Baumol WJ, Blackman SAB, Wolff EN. Productivity and American Leadership: The Long View. Cambridge MA: MIT Press, pp. 66–67.
Ruhm CJ. Healthy living in hard times. Cambridge, MA: National Bureau of Economic Research,
Doll R. Major epidemics of the 20th century: from coronary thrombosis to AIDS.
Brenner MH. Trends in alcohol consumption and associated illnesses: some effects of economic changes.
Brenner MH, Mooney A. Economic change and sex-specific cardiovascular mortality in Britain 1955–1976.
Brenner MH. Economic Change and Mortality by Cause in Selected European Countries: Special Reference to Behavioral health Risks, Emphasizing Alcohol Consumption. World Health Organization for Europe, Health Policy in Relation to Unemployment in the Community, World Health Organization,
Brenner MH. Economic instability, unemployment rates, behavioral risks, and mortality rates in Scotland, 1952–1983.
Brenner MH. Economic change, alcohol consumption and heart disease mortality in nine industrialized countries.
Moser KA, Fox AJ, Jones DR. Unemployment and mortality in the OPCS longitudinal study.
Moser KA, Goldblatt PO, Fox AJ, Jones DR. Unemployment and mortality: comparison of the 1971 and 1981 longitudinal study census samples.
Blackley PR. The measurement and determination of Okun's law: evidence from state Economies.
Engle RF, Granger CWJ. Long Run Economic Relationships: Readings in Cointegration. Oxford: Oxford University Press,
Shiller RJ. A distributed lag estimator derived from smoothness priors.

