


Abstract
SATB1 has been previously proposed as a key protein that controls the development and progression of breast cancer. We explored the potential of the SATB1 protein as a therapeutic target and prognostic marker for human breast cancer.
We used aggressive (MDA-MB-231 and BT549) and nonaggressive (SKBR3 and MCF7) breast cancer cell lines to investigate the potential of SATB1 as a therapeutic target. SATB1 mRNA expression was silenced in aggressive cells by use of short hairpin RNAs against SATB1. SATB1 was overexpressed in nonaggressive cells by use of SATB1 expression vectors. We assessed the effect of modifying SATB1 expression on the transformed phenotype by examining anchorage-independent cell proliferation, acinar morphology on matrigel, and migration by wound healing in cultured cells. We examined tumor formation and metastasis, respectively, by use of orthotopic mammary fat pad and tail vein xenograft mouse models (mice were used in groups of six, and in total, 96 mice were used). SATB1 mRNA expression was compared with outcome for patients with primary breast cancer from six previous microarray studies that included a total of 1170 patients. All statistical tests were two-sided.
The transformed phenotype was not suppressed by SATB1 silencing in aggressive cells and was not enhanced by ectopic expression of SATB1 in nonaggressive cells. Modifying SATB1 expression did not alter anchorage-independent cell proliferation, invasive acinar morphology, or cell migration in cultured cells and did not affect tumor formation or metastasis in xenograft mouse models. In addition, SATB1 expression was not associated with decreased overall survival of patients with primary breast cancer in six previous independent microarray studies (overall odds ratio = 0.80, 95% confidence interval = 0.62 to 1.03, P = .10).
In contrast to previous studies, we found that SATB1 expression did not promote breast cancer progression and was not associated with breast cancer outcome.
SATB1 may coordinate regulation of more than 10% of all genes, leading to the hypothesis that this “genome organizer” may have a critical role in the complex gene expression patterns of human cancers, including breast cancer.
Aggressive (MDA-MB-231 and BT549) and nonaggressive (SKBR3 and MCF7) breast cancer cell lines were used to investigate the association of SATB1 gene expression with breast cancer by modifying the expression of SATB1 mRNA and assessing the effect of such modifications on the transformed phenotype of cultured cells and on tumor formation and metastasis with xenograft mouse models. SATB1 mRNA expression from six previous microarray studies was compared with outcome for patients with primary breast cancer.
SATB1 expression was not associated with the behavior of breast cancer cells in culture or in xenograft mouse models, and it was not associated with outcome among patients with breast cancer.
The role of SATB1 expression in breast cancer is not clear. SATB1 may not be a good therapeutic target for breast cancer.
Only SATB1 mRNA expression was assessed. Immunodeficient mice were used in all mouse model systems.
From the Editors
New marker and therapeutic target exploration is critical to the early detection, management, and effective treatment of human cancers. Tumor-associated and tumor-specific markers may be used in diagnostic and prognostic tests to aid clinicians in selecting a suitable treatment regimen for cancer patients. It is important to identify proteins that are directly involved in the pathogenetic pathways promoting oncogenesis and metastasis. These proteins can then be investigated as potential targets for the development of therapeutic strategies with the goal of controlling or curing malignant disease. The SATB1 protein has been proposed as such a target for breast cancer progression and metastasis ( 1 ). The SATB1 protein recognizes specialized AT-rich anchor sites in the genome to form a functional “cage-like” scaffold that organizes high-order chromatin loops into distinct domains, thereby permitting regulation of distant genes in a coordinated process ( 2–7 ). These AT-rich motifs in supercoiled DNA are prone to base unpairing and so are referred to as base-unpairing regions ( 8 , 9 ). SATB1 binds to base-unpairing regions and forms a docking site for transcription factors and chromatin-modifying enzymes, which regulate histone modification and nucleosomal positioning over long stretches of genomic DNA ( 2 , 3 , 10 , 11 ). In addition, SATB1 may bind similar AT-rich motifs in promoters and regulatory regions upstream of genes to directly influence promoter activity and gene expression ( 2 , 12 , 13 ). Through these mechanisms, SATB1 may coordinate regulation for more than 10% of all genes, leading to the hypothesis that this “genome organizer” may have a critical role in the complex gene expression patterns of human cancers ( 2 , 13 ).
In 2008, Han et al. ( 1 ) suggested that SATB1 protein is expressed during tumorigenesis to alter the gene expression profile of breast cancer cells to support an aggressive cell phenotype that promotes tumor growth and metastasis. They used human cancer cell lines for in vitro studies and in vivo experiments in athymic nude mice to explore the effect of modifying SATB1 expression on breast cancer aggression. They measured tumor formation rates, tumor size, and intravasation (ie, invasion of cancer cells into blood vessels) by orthotopic injection of cancer cells into the mouse mammary fat pad and measured lung metastasis rates by use of a tail vein injection model. Expression of SATB1 in nonaggressive breast cancer cell lines resulted in gene expression patterns that were similar to those found in tumors with aggressive phenotypes and promoted metastatic tumor formation in aythmic nude mice. When they used RNA interference to reduce SATB1 expression in a highly aggressive breast cancer cell line, gene expression profiles were altered, tumorigenesis was reversed, and tumor growth and metastasis were inhibited. They also showed that nuclear SATB1 protein expression could be used as a prognostic factor ( P < .0001) for predicting the likelihood of disease progression in patients with early-stage breast cancer. Han et al. ( 1 ) strongly suggested that SATB1 has a critical role in breast cancer progression.
In this study, we explored the potential of SATB1 protein as a prognostic marker and/or therapeutic target for human breast cancer. To achieve this aim, we attempted to confirm the phenotypic changes in breast cancer cell lines after SATB1 overexpression or silencing that had been reported by Han et al. ( 1 ). We used techniques and models that were similar to those used by Han et al.
Patients, Materials, and Methods
Cell Lines and Cell Culture
The BT549, MCF10A, MCF7, MDA-MB-231, and SKBR3 human breast cell lines; NIH3T3 and PT67 mouse fibroblast cell lines; and the HEK293T human kidney cell line were obtained from American Type Culture Collection (Manassas, VA). All cells, except for MCF10A cells, were cultured in Dulbecco’s modified Eagle medium (DMEM; Invitrogen, Carlsbad, CA) supplemented with 10% fetal bovine serum (Hyclone, Logan, UT) and 5% penicillin–streptomycin solution (Invitrogen) at 37°C. MCF10A cells were cultured in mammary epithelial growth medium (MEGM; Clontech, Mountain View, CA) supplemented with cholera toxin (Sigma Aldrich, St Louis, MO) at 100 ng/mL. The immortalized human mammary epithelial cell line HME3 ( 14 ) was obtained from T. Ince (Brigham And Women's Hospital, Boston, MA) and maintained in MEGM (Clontech).
Mouse Models
A total of ninety-six 8-week-old female athymic NCr- nu/nu mice (code 01B74, NCI-Frederick, Frederick, MD) were used for all studies involving animals. All animal work was done according to Institutional Animal Care and Use Committee guidelines.
Silencing SATB1 Expression in Aggressive Breast Cancer Cells by Use of RNA Interference
We used the aggressive human breast cancer cell lines, MDA-MB-231 and BT549, for these experiments. Three short hairpin RNAs (shRNAs) that were designed against the SATB1 mRNA sequence (GenBank accession number NM_002971) were purchased from Open Biosystems (Huntsville, AL): shRNA V2LHS_316098 , shRNA V2LHS_31611 , and shRNA V2LHS_31614 . The oligoduplexes were expressed in pGIPZ lentiviral vector (Open Biosystems) and cotransfected into the HEK293T producer cell line with packaging plasmids by use of FuGene HD (Roche, Basel, Switzerland). Supernatants from HEK293T cells containing pGIPZ SATB1 shRNA virus were collected after 48–96 hours of incubation, and then, 70% confluent cell cultures were infected with virus by adding the supernatant in the presence of polybrene (Sigma Aldrich) at 8 μg/mL. The cultures were incubated overnight, virus-containing medium was removed, and fresh medium was added to the cultures. Forty-eight hours later, cells containing integrated pGIPZ SATB1 shRNAs were selected in medium with puromycin at 0.7 μg/mL (MDA-MB-231 cells) or 2.0 μg/mL (BT549 cells) for 5 days. Cells stably expressing shRNA V2LHS_316098 were designated SATB1 shRNA 1 cells, shRNA V2LHS_31611 were designated SATB1 shRNA 2 cells, and shRNA V2LHS_31614 were designated SATB1 shRNA 3 cells. Pooled populations of MDA-MB-231 and BT549 cells, which were obtained after 5 days of selection in puromycin without subcloning, were used for experiments in cell culture and in mouse models. Negative control MDA-MB-231 and BT549 cell lines were generated by infecting cells with a pGIPZ nonsilencing shRNA control construct that did not appreciably silence the expression of SATB1 protein, as detected by immunoblot analysis.
SATB1 Overexpression in Nonaggressive Breast Cancer Cells
We used the nonaggressive human breast cancer cell lines, SKBR3 and MCF7, as well as the mouse NIH3T3 fibroblast line and the human HME3 cell line for these experiments. Human SATB1 cDNA was cloned into the pLXSN retroviral expression vector. We verified that the SATB1 construct that we used for our experiments was identical to the pLXSN SATB1 construct used by Han et al. ( 1 ) by sequence analysis (known SATB1 -coding single-nucleotide polymorphisms are provided in Supplementary Table 1 , available online). The pLXSN SATB1 vector and pLXSN empty vector control were transfected into the PT67 packaging cell line by use of FuGene (Roche). Stable cell lines expressing pLXSN constructs were selected by incubation with G418 at 1 mg/mL. Virus-containing supernatants from PT67 cells were collected after 48–96 hours of incubation, and then, 70% confluent cell cultures were infected with virus by adding the supernatant in the presence of polybrene (Sigma) at 8 μg/mL, and the cultures were incubated overnight. Forty-eight hours later, SKBR3 cells containing integrated pLXSN constructs were selected for 5 days in G418 at 1.5 mg/mL, NIH3T3 cells containing integrated pLXSN constructs were selected in G418 at 0.7 mg/mL, and MCF7 and HME3 cells containing integrated pLXSN constructs were selected in G418 at 0.5 mg/mL. Pooled populations of transduced SKBR3, NIH3T3, MCF7, and HME3 cells that were obtained after 5 days of G418 selection without subcloning were used for experiments in cell culture and in mouse models.
Clinical datasets for analyses of SATB1 and SATB2 expression *
| GEO/array express identifier | Reference | PubMed identifier | No. of patients | Sample information |
| E-GEOD-3143 | Bild et al. ( 18 ) | 16273092 | 158 | Tumor tissue from breast cancer patients (minimum 60% tumor) was used for this study. Samples were collected at the Duke University Medical Center (Durham, NC) and the Koo Foundation Sun Yat-Sen Cancer Center (Taipei, Taiwan) and were selected by stage and histology. |
| E-TABM-158 | Chin et al. ( 19 ) | 17157792 | 117 | Frozen tissue from UC San Francisco and the California Pacific Medical Center (San Francisco, CA) that was collected between 1989 and 1997 was used for this study. The cohort of patients was treated according to the standard of care (surgery, radiation, hormonal therapy, and treatment with high-dose adriamycin and cytoxan, as indicated). Clinical follow-up was available with a median time of 6.6 y overall and 8 y for censored patients. Tumors were predominantly early stage (83% stages I and II), with an average diameter of 2.6 cm. Approximately 50% of the tumors were lymph node positive, 67% were estrogen receptor positive, 60% of the patients received tamoxifen, and 50% received adjuvant chemotherapy (typically adriamycin and cytoxan). |
| E-GEOD-7390 | Desmedt et al. ( 20 ) | 17545524 | 198 | Frozen archival tumor materials from breast cancer patients who were previously described by the TRANSBIG consortium were used for this study. Patients were younger than 61 y (median age = 47 y) and had lymph node negative, T1-T2 tumors. Patients in this series had been diagnosed between 1980 and 1998 (median follow-up = 13.6 y). Treatment was at any of the following six centers: Institut Gustave Roussy, Villejuif, France; Karolinska Institute, Stockholm, Sweden; Uppsala University Hospital, Uppsala, Sweden; Centre René Huguenin, Saint-Cloud, France; Guy's Hospital, London, UK; and John Radcliffe Hospital, Oxford, UK. Patients with previous malignancies (except basal cell carcinoma) and bilateral synchronous breast tumors were excluded. |
| E-GEOD-3494 | Miller et al. ( 21 ) | 16141321 | 251 | The biological tumor samples used for this study were from freshly frozen breast tumors from a population-based cohort of 315 women, representing 65% of all breast cancers resected in Uppsala County, Sweden, from January 1, 1987, through December 31, 1989. Of these tissues, 251 were composed predominantly of diseased tissue and yielded sufficient RNA for array analysis. |
| E-GEOD-1456 | Pawitan et al. ( 22 ) | 16280042 | 159 | This study included all breast cancer patients who were operated on at the Karolinska Hospital from January 1, 1994, through December 31, 1996 (n = 524), as identified from the population-based Stockholm–Gotland breast cancer registry established in 1976. Tissue material was frozen immediately on dry ice or in liquid nitrogen and stored in −70°C freezers. This series contains expression data for 159 tumors from which RNA could be collected in sufficient amounts and quality for analysis. |
| E-GEOD-2034 | Wang et al. ( 23 ) | 15721472 | 286 | For this study, frozen tumor samples from patients with lymph node–negative breast cancer who were treated during 1980–1995 but who did not receive systemic neoadjuvant or adjuvant therapy were selected from the tumor bank at the Erasmus Medical Center (Rotterdam, the Netherlands). Guidelines for primary treatment were similar for all hospitals. Selection of tumors aimed to avoid bias. There were 436 samples of invasive tumors that were processed; patients with poor, intermediate, and good clinical outcome were included. Samples were rejected on the basis of insufficient tumor content, poor RNA quality, or poor chip quality; 286 samples were eligible for further analysis. The median age of the patients at surgery was 52 y (range = 26–83 y), 219 had undergone breast-conserving surgery, and 67 had undergone modified radical mastectomy. Radiotherapy was given to 248 patients (87%) according to the institutional protocol. |
| — | Han et al. ( 1 ) | 18337816 | 985 | For this study, primary ductal breast carcinomas surgically removed and snap-frozen in liquid nitrogen were obtained from 985 patients from the Cooperative Human Tissue Network along with pathology summaries. Tumors were predominantly early stage (84% stages I and II), with 36% of the tumors were less than 2 cm in diameter, 56% of the tumors were between 2 and 5 cm in diameter, and 8% of the tumors were greater than 5 cm in diameter; 53% of the patients were lymph node positive; and 22% were Bloom, Richardson, Elston (BRE) grade 1, 39% were grade 2, and 39% were grade 3. |
Data for analyses of SATB1 expression are presented in Figure 6 and Supplementary Figure 6 (available online) and data for analyses of SATB2 expression are presented in Supplementary Figure 7 (available online). GEO = from the Gene Expression Omnibus; UC = University of California.
Analysis of SATB1 mRNA and Protein Expression
Protein and RNA samples were extracted from subconfluent cultures of MDA-MB-231 and BT549 parental cells and corresponding cells expressing vector control or SATB1 shRNA, as well as SKBR3, MCF7, NIH3T3, and HME3 parental cells and corresponding cells expressing vector control or pLXSN SATB1 in the exponential phase of growth.
Analysis of mRNA Expression by Quantitative Real-Time Reverse Transcription–Polymerase Chain Reaction (qRT-PCR).
Total RNA was purified by use of the TRIzol reagent (Invitrogen) according to the manufacturer's instructions. A 1-μg RNA sample was reverse transcribed by use of the High Capacity RNA to cDNA Kit (Applied Biosystems, Foster City, CA) following the manufacturer's directions. qRT-PCR was performed with 100 ng of cDNA from each sample. SYBR green 2X master mixture (Roche) was used in a total volume of 20 μL. Primers for target genes were as follows: SATB1 sense 5′-TGCAAAGGTTGCAGCAACCAAAAGC-3′ and SATB1 antisense 5′-AACATGGATAATGTGGGGCGGCCT-3′; and SATB2 sense 5′-ATGTGAGCATGGTCTCCTCG-3′ and SATB2 antisense 5′-GCGCCGTCCACCTTAATAG-3′. GAPDH was used as the endogenous control, with GAPDH primers as follows: sense 5′-TGTTGCCATCAATGACCCCTT-3′ and antisense 5′-CTCCACGACGTACTCAGCG-3′. Reaction conditions were 5 minutes at 95°C, followed by 45 cycles of 95°C for 15 seconds, 60°C for 15 seconds, and 72°C for 15 seconds. Each sample was analyzed in triplicate by use of a LightCycler 640 Real-Time PCR System (Roche). Normalized target gene expression was calculated relative to expression of GAPDH endogenous control and adjusted relative to expression in parental cells.
Immunoblot Analysis.
SATB1 protein expression was assessed by immunoblot analysis in cell lysates (40–60 μg of protein in lysis buffer [20 mM HEPES at pH 7.9, 25% glycerol, 0.5 N NaCl, 1 mM EDTA, 1% Nonidet P-40, 0.5 mM dithiothreitol, and 0.1% deoxycholate]) containing protease inhibitors (Roche). Proteins were separated by sodium dodecyl sulfate–polyacrylamide gel electrophoresis and transferred onto nitrocellulose membranes (BioRad, Hercules, CA). The membranes were incubated for 1 hour in blocking buffer (Tris-buffered saline with 0.1% Tween [TBS-T] and 5% nonfat dry milk) and incubated overnight at 4°C with anti-SATB1 mouse monoclonal antibody (BD Biosciences, San Jose, CA) at a dilution of 1:1000 in blocking buffer. After washing in TBS-T, the blots were incubated with horseradish peroxidase–conjugated secondary antibody against mouse IgG, and the signals were visualized by the enhanced chemiluminescence system as described by the manufacturer (Amersham Pharmacia, GE Healthcare Biosciences, Piscataway, NJ). The blots were reprobed with anti-actin monoclonal antibody (Abcam, Cambridge, MA) to confirm equal loading of the different samples.
Microarray Analysis of SATB1 mRNA Expression
MCF7 cells expressing pLXSN SATB1 or pLXSN control vector were used for this experiment. Total RNA samples were prepared according to the manufacturer's instructions (Ilumina, Inc, San Diego, CA) and analyzed on the HumanWG-6 Illumina platform. Raw expression data were quantile normalized (which forces the arrays to have absolutely identical distributions on the basis of the assumption that the RNA populations that hybridized to the arrays are the same) and log 2 transformed before analysis with the beadarray package in the R statistical language ( 15 , 16 ). Only transcripts with detection P values of less than.1 were included in further analyses. Data were analyzed by use of a single factorial design with treatment (ie, pLXSN control vector) as the factor and subsequent single treatment contrasts (ie, pLXSN SATB1), as implemented in the limma package in the R language ( 17 ). An Empirical Bayes analysis of the contrasts (ie, pLXSN control vector vs pLXSN SATB1) provided estimates of fold change and adjusted P values of differential expression between treatments.
Soft Agar Assay
MDA-MB-231 and BT549 parental cells and corresponding cells expressing vector control or SATB1 shRNA, as well as SKBR3, MCF7, NIH3T3, and HME3 parental cells and corresponding cells expressing vector control or pLXSN SATB1, were used for this experiment. Anchorage-independent growth was assessed with a high-throughput soft agar colony formation assay (CytoSelect 96-Well Cell Transformation Assay; Cell Biolabs, Inc, San Diego, CA) according to the manufacturer's instructions. Briefly, 5 × 10 3 cells were suspended in DMEM containing 10% fetal bovine serum with 0.4% agarose and layered on top of 0.6% agarose in DMEM in 96-well plates. Cultures were maintained for 8 days. Colony formation was measured by agar solubilization followed by cell lysis and quantification of cell number by use of CyQuant GR Dye in a fluorescence plate reader. Data were reported as fluorescence intensity, which is directly proportional to cell number.
Morphology on Matrigel
MDA-MB-231 and BT549 parental cells and corresponding cells expressing vector control or SATB1 shRNA, as well as SKBR3 and MCF7 parental cells and corresponding cells expressing vector control or pLXSN SATB1, were used for this experiment. MCF10A cells were used as a control for acinar formation by normal mammary epithelial cells. Invasive protrusions from acinar demonstrate aggressiveness. Cell morphology on matrigel was studied by plating 2.5 × 10 4 cells onto 24-well plates that had been coated with 100 μL of matrigel (BD Biosciences). Cultures were maintained for 5 days and imaged by use of a phase–contrast microscope that was equipped with an Olympus digital camera. Each experiment was performed twice, with triplicate samples.
Wound-Healing Assay
MDA-MB-231 and BT549 parental cells and corresponding cells expressing vector control or SATB1 shRNA, as well as SKBR3 and MCF7 parental cells and corresponding cells expressing vector control or pLXSN SATB1, were used for this experiment. Cell migration was assessed in a wound-healing (scratch) assay. Cells were plated in 24-well plates and allowed to proliferate to form a confluent monolayer. A 200-μL pipette tip was used to scratch a single wound through the middle of the cell monolayer. Cells were imaged as indicated until the wound was fully closed by use of a light microscope equipped with an Olympus digital camera. Images that were matched by the number of days after wounding were compared visually to determine differences in the rate of cell migration. Each experiment was performed twice, with triplicate samples.
Analysis of Tumor Growth in Mouse Mammary Fat Pads and Intravasation
We randomly assigned female NCR athymic mice to one of 11 groups (six mice per group) as follows: group 1 = a nonsubcloned pool of SATB1 shRNA 1 MDA-MB-231 cells; group 2 = a nonsubcloned pool of SATB1 shRNA 2 MDA-MB-231 cells; group 3 = a nonsubcloned pool of SATB1 shRNA 3 MDA-MB-231 cells; group 4 = control shRNA MDA-MB-231 cells; group 5 = parental MDA-MB-231 cells; group 6 = parental SKBR3 cells; group 7 = SKBR3 empty vector control cells; group 8 = SATB1-overexpressing SKBR3 cells; group 9 = parental MCF7 cells; group 10 = MCF7 empty vector control cells; and group 11 = SATB1-overexpressing MCF7 cells. Before injection, 2 × 10 5 cells were suspended in 200 μL of matrigel (5 mg/mL) in phosphate-buffered saline for cell lines except MCF7 cells, which were suspended at 3 × 10 6 cells. Cells were injected into the fourth mammary fat pad from flank in all mice to generate one tumor per mouse. Tumor growth was monitored externally biweekly by use of vernier calipers for 6–12 weeks. Tumor volume was calculated with the formula L × W2 × 0.4 (where 1 cm 3 = 1 g). Tumors were removed at necropsy and weighed to determine final tumor weight. To determine intravasation of MDA-MB-231 tumor cells, lung tissue (one half of a lung) and 100 μL of blood were collected from each mouse injected with cancer cells immediately after they were euthanized by ketamine–xylazine injection, followed by cervical dislocation. Each lung or blood sample was incubated with 0.2% collagenase type 2 in DMEM for 2 hours at 37°C, and cells were dispersed, washed, and plated in DMEM with 10% fetal bovine serum plus puromycin (0.7 μg/mL) to select tumor cells containing integrated pGIPZ shRNA constructs. Tumor colonies were counted 4 weeks later.
Analysis of Metastasis in a Mouse Model
We randomly assigned female NCR athymic mice to one of five groups (six mice per group) as follows: group 1 = a pool of SATB1 shRNA 1 MDA-MB-231 cells; group 2 = a pool of SATB1 shRNA 2 MDA-MB-231 cells; group 3 = a pool of SATB1 shRNA 3 MDA-MB-231 cells; group 4 = control shRNA MDA-MB-231 cells; and group 5 = parental MDA-MB-231 cells. We injected 1 × 10 6 cells intravenously via the lateral tail vein in 100 μL of phosphate-buffered saline. At 10 weeks after injection, all mice were euthanized by ketamine–xylazine injection, followed by cervical dislocation, and their lungs were removed and fixed in 10% formalin. The number of surface metastases per lung was determined under a dissecting microscope. Histopathological analysis was performed at the Histology Research Core Facility of the Sylvester Comprehensive Cancer Center (University of Miami).
Analysis of Oncomine Data
For SATB1 expression in cell lines, the Oncomine Research database ( http://www.oncomine.org/ ) was searched for gene expression studies involving breast cancer cell lines. We retained any studies (n = 3) with at least 20 different cell lines for which expression of SATB1 was available for further analysis. The processed gene expression data from these studies was obtained from either the Gene Expression Omnibus database ( www.ncbi.nlm.nih.gov/geo/ ) or the ArrayExpress repository ( www.ebi.ac.uk/microarray-as/ae/ ). Each dataset was analyzed in the R statistical language ( 16 ) by use of an analysis of variance for SATB1 expression with breast cancer subtype as the only factor (luminal, basal A, or basal B) to determine the statistical significance of the association of subtype with SATB1 expression.
For analysis of SATB1 expression in patient data, the Oncomine Research database ( http://www.oncomine.org/ ) was searched for gene expression studies involving breast cancer patients for whom overall survival information was available. Those studies (n = 6) with at least 100 patients for which expression of SATB1 was available were retained for further analysis (for details, see Table 1 ). These six studies included a total of 1170 patients. The processed gene expression data from these studies was obtained from either the Gene Expression Omnibus database (www.ncbi.nlm.nih.gov/geo/) or the ArrayExpress repository (www.ebi.ac.uk/microarray-as/ae/). Each dataset was analyzed in the R statistical language by use of the pamr and survival packages ( 24 , 25 ). This analysis involved an initial grouping of patients according to their level of SATB1 expression (first, second, or third tertile). We visually confirmed proportionality using R's plot function of survival function vs survival time. A survival analysis with Cox proportional hazards models was then conducted to compare the survival between groups (ie, survival time was examined as a function of level of SATB1). Kaplan–Meier plots were made of the observed survival times for each group. A forest plot of the odds ratios of death (in which the middle and top tertiles of SATB1 expression vs the lowest tertile of expression were compared) was constructed with the metaplot function from the rmeta package for R ( 26 ).
To determine whether there was cross-hybridization between SATB1 probes with SATB2 mRNA, we checked the probes for SATB1 on the Affymetrix platforms for potential cross-hybridization with SATB2 ( Supplementary Tables 2 and Supplementary Data , available online). Using BLAST searches (www.ncbi.nlm.nih.gov/BLAST/), we determined that there was little if any overlap between the SATB1 probe sequences and SATB2 mRNA sequence.
Statistical Methods
The statistical significance of differences in numerical data was evaluated with a Student t test, the statistical significance of differences in SATB1 expression in cell line subtypes was evaluated with analysis of variance, and the statistical significance of differences in survival between groups of patients based on SATB1 expression was evaluated with Cox proportional hazards models. We visually confirmed proportionality using R's plot function of survival function vs survival time. A P value of less than.05 was considered to be statistically significant. All statistical tests were two-sided.
Results
Effect of SATB1 Depletion on the Aggressive Cancer Cell Phenotype In Vitro
We used shRNAs to silence SATB1 expression and we explored the role of the SATB1 protein on the aggressive cancer cell phenotype as defined by anchorage-independent cell proliferation, invasive acinar morphology, and cell migration in cultured cells. Three shRNAs (ie, SATB1 shRNA 1, 2, and 3) targeting different sequences in SATB1 mRNA and a nontarget (ie, nonsilencing) control shRNA were expressed by use of lentiviral vectors in highly metastatic MDA-MB-231 breast cancer cells. Quantitative real-time reverse transcription–polymerase chain reaction (qRT-PCR) and immunoblotting, respectively, were used to compare SATB1 mRNA and protein expression in MDA-MB-231 cells expressing SATB1 silencing shRNAs, MDA-MB-231 cells expressing control shRNA, and nontransduced MDA-MB-231 parental cells ( Figure 1 , A). All three SATB1 silencing shRNAs reduced SATB1 expression in MDA-MB-231 cells (by 47% with shRNA 1, mean normalized SATB1 expression = 0.53, 95% confidence interval [CI] = 0.40 to 0.65; 82% with shRNA 2, mean normalized SATB1 expression = 0.18, 95% CI = 0.17 to 0.19; and 68% with shRNA 3, mean normalized SATB1 expression = 0.32, 95% CI = 0.24 to 0.39) compared with parental MDA-MB-231 cells (mean normalized SATB1 expression = 1.00, 95% CI = 0.76 to 1.24). The reduced SATB1 expression in MDA-MB-231 cells expressing SATB1 silencing shRNAs, however, did not decrease colony formation in soft agar, as measured by lysis and quantification of cell number with CyQuant GR Dye, compared with MDA-MB-231 parental cells and MDA-MB-231 cells expressing control shRNA ( Figure 1 , B). This result indicates that a reduction of SATB1 expression did not restore anchorage-dependent growth of these breast cancer cells, in contrast to the results reported by Han et al. ( 1 ). All five cell lines were cultured on matrigel for 5 days, and cell morphology (specifically, invasive acinar protrusions) was assessed by use of phase contrast microscopy. No change in the aggressive appearance of any cell type was observed ( Figure 1 , C). Finally, we used a wound-healing assay to assess cell migration, and no change in cell migration through 36 hours after wounding was observed in any cell type ( Figure 1 , D). Similar results were obtained when another aggressive breast cancer cell line, BT549, was studied ( Supplementary Figure 1, A–D , available online). Thus, inhibition of SATB1 expression does not appear to alter the aggressive phenotype of breast cancer cell lines in vitro, in contrast to the results reported by Han et al. ( 1 ).
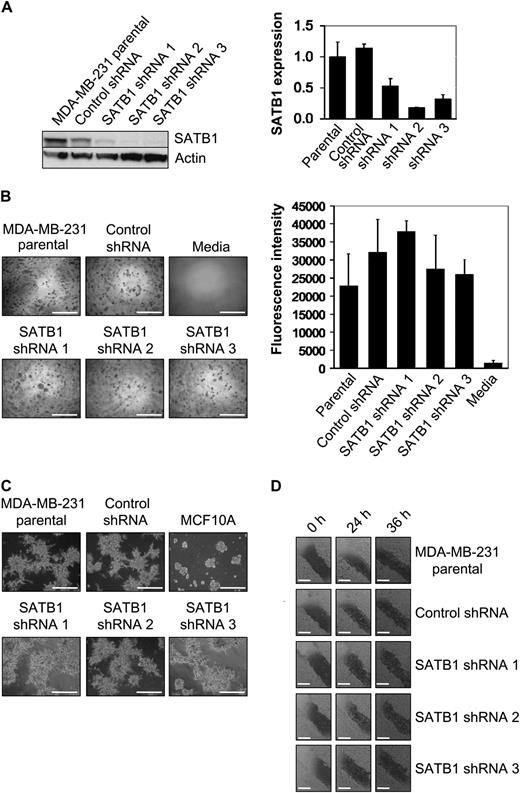
Effect of SATB1 depletion on the aggressive cancer cell phenotype in vitro. For these experiments, we used SATB1 short hairpin RNA (shRNA) 1, 2, and 3 MDA-MB-231 cells, control shRNA MDA-MB-231 cells, and parental MDA-MB-231 cells. A ) SATB1 mRNA and protein expression. Left ) SATB1 protein expression by immunoblot analysis. Actin protein expression was the loading control. Right ) SATB1 mRNA expression by quantitative real-time reverse transcription–polymerase chain reaction analysis. Data are expressed as normalized SATB1 expression, which was calculated relative to expression of endogenous GAPDH mRNA control and adjusted relative to the expression of GAPDH normalized SATB1 expression in parental MDA-MB-231 cells. SATB1 mRNA experiments were repeated three times, with each point in triplicate. Error bars = 95% confidence intervals. B ) Colony formation in soft agar after 8 days of culture. Left ) Representative micrographs of colonies. The experiment was performed twice, with triplicate samples. Scale bars = 1 mm. Right ) Quantification of colony formation in soft agar after 8 days of culture. To measure colony formation, agar was solubilized, cells were lysed, and the number of cells in the colonies was assessed by use of CyQuant GR Dye with a fluorescence plate reader. Fluorescence intensity is directly proportional to cell number. The experiment was performed twice, with triplicate samples. Error bars = 95% confidence intervals. C ) Acinar morphology after 5 days of culture on matrigel. MCF10A cells were used as a control for normal mammary epithelial cell acinar formation. Invasive protrusions from acinar demonstrate aggressiveness. Representative micrographs are shown. The experiment was performed twice, with triplicate samples. Scale bars = 1 mm. D ) Cell migration as assessed by wound healing. Confluent cell cultures, as indicated, were wounded by scratching a single wound through the middle of the cell monolayer with a 200-μL pipette tip and, wounds were photographed 0, 24, and 36 hours after wounding. Rates of cell migration are shown by closing of the wounds. Representative micrographs are shown. The experiment was performed twice, with triplicate samples. Scale bars = 0.5 mm.
Effect of SATB1 Depletion on the Aggressive Cancer Cell Phenotype In Vivo
Breast cancer cell lines depleted of SATB1 by use of shRNA were evaluated for tumorigenesis in vivo by use of an athymic nude mouse model system. The mammary fat pads of athymic nude mice (n = six mice per group) were injected with 2 × 10 5 parental MDA-MB-231 cells, MDA-MB-231 cells expressing SATB1 silencing shRNAs, or MDA-MB-231 cells expressing control shRNA. Mice were monitored for primary tumor formation, and tumor volume was measured during a period of 6 weeks ( Figure 2 , A). There was essentially no difference in time to tumor formation or tumor volume observed across experimental groups. This observation was confirmed when tumors were harvested at 6 weeks after tumor cell injection and weighed ( Figure 2 , B and C).
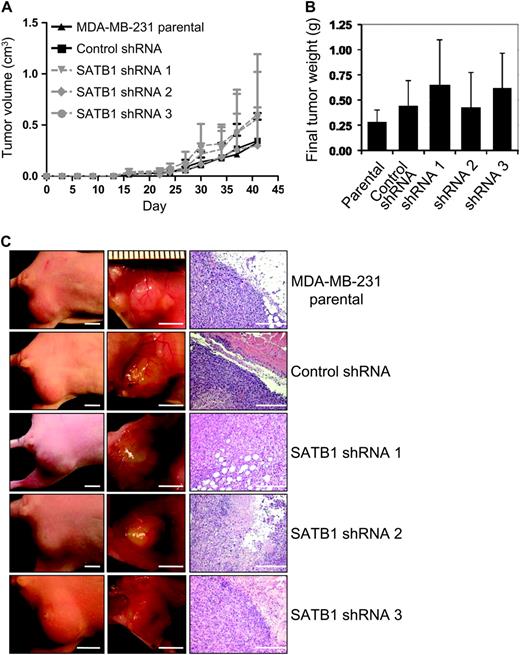
Effect of SATB1 depletion on the aggressive cancer cell phenotype in vivo. For these experiments, we used SATB1 short hairpin RNA (shRNA) 1, 2, and 3 MDA-MB-231 cells, control shRNA MDA-MB-231 cells, and parental MDA-MB-231 cells. Mice (n = six mice per group) were injected with 2 × 10 5 SATB1 shRNA cells (ie, pooled populations of shRNA silenced cells that were obtained after 5 days of drug selection without subcloning), control shRNA cells, or parental MDA-MB-231 cells into the fourth mammary fat pad from flank to obtain one tumor per mouse. A ) Tumor volume. Tumors were measured with vernier calipers, and volume was calculated with the formula L × W2 × 0.4 (where 1 cm 3 = 1 g). Each data point is the mean value of four to six primary tumors. Error bars = 95% confidence intervals. B ) Final tumor weight. Tumors were removed at necropsy on day 42 after injection and weighed. Each data point is the mean value of four to six primary tumors. Error bars = 95% confidence intervals. C ) Photographs of representative mice ( left column , scale bar = 5 mm) and of tumors in their mammary fat pads ( center column , scale bar = 5 mm) and micrographs of tumor sections stained with hematoxylin–eosin ( right column , scale bar = 50 μm).
qRT-PCR analysis of SATB1 expression in RNA isolated from harvested tumors showed that SATB1 mRNA levels in tumors expressing the silencing shRNA species remained statistically significantly lower (mean normalized SATB1 expression = 0.40) than in tumors from parental or control shRNA cells (mean normalized SATB1 expression = 1.11) (mean difference = 0.71, 95% CI = 0.63 to 0.80, P < .001), indicating that tumor formation in SATB1 shRNA cells was not the result of loss of SATB1 shRNA silencing capacity ( Supplementary Figure 2 , A, available online). The number of colonies formed by cells isolated from lung or blood samples from each tumor-bearing mouse was sporadic and was not associated with SATB1 expression ( Supplementary Figure 2, B and C , available online). A similar sporadic pattern was obtained by counting the number of lung metastases in mice at 10 weeks after tail vein injection of 1 × 10 6 MDA-MB-231 parental cells, MDA-MB-231 cells expressing SATB1 silencing shRNAs, or MDA-MB-231 cells expressing control shRNA ( Supplementary Figure 2, D , available online). In summary, these data indicate that SATB1 expression is not a requirement for the growth, intravasation, or metastasis of MDA-MB-231 breast cancer cells.
Effect of SATB1 Expression on the Aggressive Cancer Phenotype In Vitro
To determine whether SATB1 overexpression in breast cancer cell lines alters their phenotype, two breast cancer cell lines with low levels of SATB1 expression (ie, SKBR3 and MCF7) were transduced with a retroviral vector expressing SATB1 (pLXSN SATB1) or a control vector (pLXSN). SATB1 mRNA and protein expression levels were compared by qRT-PCR and immunoblotting, respectively, in parental SKBR3 cells and in SKBR3 cells transduced with pLXSN SATB1 expression vector or with pLXSN control vector ( Figure 3 , A). SATB1 expression in SKBR3 cells expressing pLXSN SATB1 (mean normalized SATB1 expression = 11.40) was higher than that in MDA-MB-231 breast cancer cells (mean normalized SATB1 expression = 1.00, 95% CI = 0.86 to 1.14), which is believed to express SATB1 at physiologically relevant levels (difference = 10.40, 95% CI = 9.75 to 11.05, P < .001), or that in parental SKBR3 cells (mean normalized SATB1 expression = 0.01) and vector control cells (mean normalized SATB1 expression = 0.01, 95% CI = 0.00 to 0.01). However, colony formation in soft agar of SKBR3 cells overexpressing SATB1 was not increased compared with that of parental or control cell lines, indicating that SATB1 expression was not associated with anchorage-independent growth ( Figure 3 , B). SATB1 overexpression also did not increase the aggressive morphology of SKBR3 cells cultured on matrigel for 5 days or cell migration in wound-healing assays during a 6-day period ( Figure 3 , C and D). Similar experimental results were obtained with the MCF7 breast cancer cell line ( Supplementary Figure 3 , available online). In additional experiments, NIH3T3 cells and human mammary epithelial cells HME3 were transduced with pLXSN SATB1 and pLXSN control vector and then evaluated for SATB1 expression and colony formation in soft agar. Although both cell types overexpressed SATB1 protein after retroviral transduction with pLXSN SATB1, colony formation in soft agar was similar to that of control cells ( Supplementary Figure 4 , available online). Thus, overexpression of SATB1 in breast cell lines does not appear to generate a transformed aggressive phenotype in vitro.
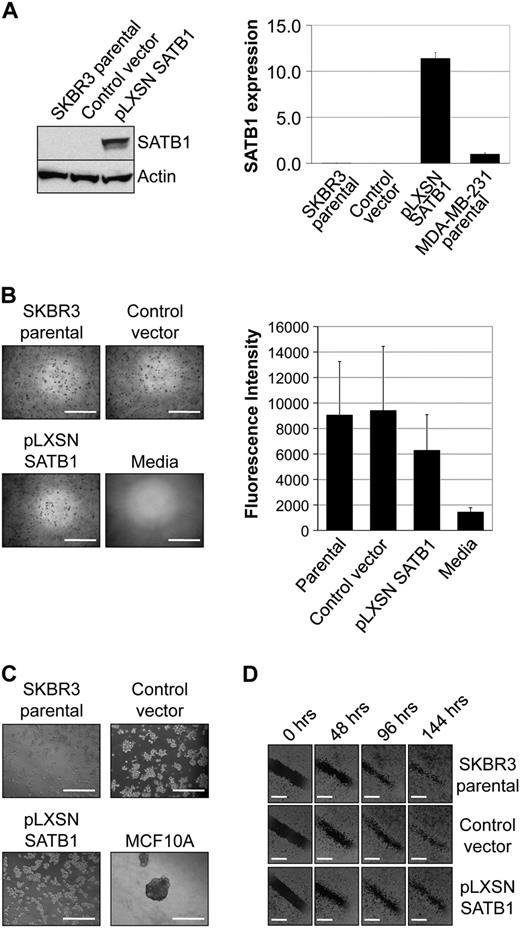
Effect of SATB1 expression on the aggressive cancer phenotype in vitro. For these experiments, we used SKBR3 pLXSN SATB1 cells that overexpress SATB1 mRNA and protein, pLXSN control vector SKBR3 cells, parental SKBR3 cells, and MDA-MB-231 breast cancer cells in which SATB1 is expressed at physiologically relevant levels. A ) SATB1 mRNA and protein expression. Left ) SATB1 protein expression by immunoblot analysis. Actin protein expression was the loading control. Right ) SATB1 mRNA expression by quantitative real-time reverse transcription–polymerase chain reaction analysis. Data are expressed as normalized SATB1 mRNA expression, calculated relative to expression of the endogenous GAPDH mRNA control, and adjusted relative to expression in control MDA-MB-231 cells. The experiment was repeated three times, with each point in triplicate. Error bars = 95% confidence intervals. B ) Colony formation in soft agar after 8 days of culture. Left ) Representative micrographs of colonies. Scale bars = 1 mm. Right ) Quantification of colony formation in soft agar after 8 days of culture. To measure colony formation, agar was solubilized, cells were lysed, and the number of cells in the colonies was assessed by use of CyQuant GR Dye with a fluorescence plate reader. Fluorescence intensity is directly proportional to cell number. The experiment was performed four times, with triplicate samples. Error bars = 95% confidence intervals. C ) Acinar morphology after 5 days of culture on matrigel. MCF10A cells were used as a control for normal mammary epithelial cell acinar formation. Invasive protrusions from acinar demonstrate aggressiveness. Representative micrographs are shown. The experiment was performed twice, with triplicate samples. Scale bars = 1 mm. D ) Cell migration as assessed by wound healing. Confluent cell cultures, as indicated, were wounded by scratching a single wound through the middle of the cell monolayer with a 200-μL pipette tip, and wounds were photographed 0, 48, 96, and 144 hours after wounding. Rates of cell migration are shown by closing of the wounds. Representative micrographs are shown. The experiment was performed twice, with triplicate samples. Scale bars = 0.5 mm.
Effect of SATB1 Expression on the Aggressive Cancer Phenotype In Vivo
To further understand the role of SATB1 overexpression on breast tumorigenesis, 2 × 10 5 parental SKBR3 breast cancer cells, SKBR3 cells transduced with pLXSN SATB1 vector, or SKBR3 cells transduced with pLXSN control vector were injected into the mammary fat pads of athymic nude mice (n = six mice per group). Tumor formation was assessed, and tumor volumes were measured during the 10-week period after tumor cell injection. We found no palpable tumors in any of the athymic nude mice groups injected with any of the SKBR3 cells ( Figure 4 , A). During necropsy of the mice, a single small mass was found in one mouse from each group of six mice injected with SKBR3 parental cells or with SKBR3 cells with control vector ( Figure 4 , B and C). In an identical set of experiments with another breast cancer cell line, MCF7, primary tumors from MCF7 parental cells formed rapidly in athymic nude mice, and these tumors were statistically significantly larger (day 35 mean tumor volume = 0.73 g) than tumors generated with cells with pLXSN SATB1 vector (day 35 mean tumor volume = 0.19 g) (difference = 0.54, 95% CI = 0.41 to 0.65, P = .019) or cells with control vector (day 35 mean tumor volume = 0.26 g) (difference = 0.47, 95% CI = 0.23 to 0.70, P = .019) ( Supplementary Figure 5, A , available online). Primary tumors were weighed during necropsy, tumor weights were compared across the groups, and essentially, no difference was observed between tumors that expressed SATB1 and vector control tumors ( Supplementary Figure 5, B and C , available online). In addition, no secondary tumors were detected in the mice bearing tumors that were generated with any cell type studied, including cells that overexpressed SATB1. These experiments with nonaggressive breast cancer cell lines, SKBR3 and MCF7, that overexpressed SATB1 indicate that SATB1 expression does not promote xenograft tumor growth in mouse models and does not generate an aggressive metastatic phenotype.
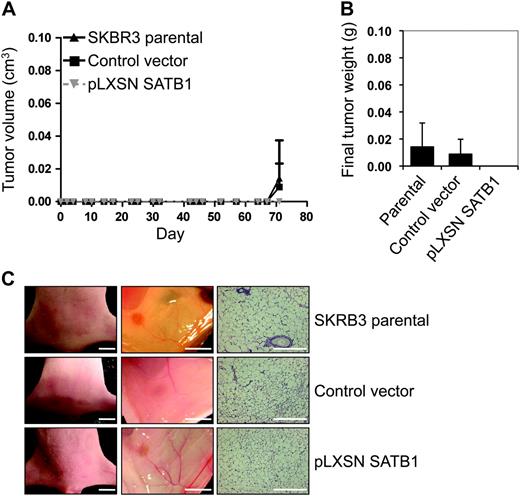
Effect of SATB1 expression on the aggressive cancer phenotype in vivo. For these experiments, we used SKBR3 pLXSN SATB1 cells that overexpress SATB1 mRNA and protein, pLXSN control vector SKBR3 cells, and parental SKBR3 cells. Mice (n = six mice per group) were injected with 2 × 10 5 pLXSN SATB1 cells, control vector cells, or parental SKBR3 cells into the fourth mammary fat pad from flank to obtain one tumor per mouse. A ) Tumor volume. Tumors were measured with vernier calipers, and volume was calculated with the formula L × W2 × 0.4 (where 1 cm 3 = 1 g). Each data point is the mean value of six tumors. Error bars = 95% confidence intervals. B ) Final tumor weight. Tumors were removed at necropsy on day 72 after injection and weighed. Each data point is the mean value of six tumors. Error bars = 95% confidence intervals. C ) Photographs of representative mice ( left column , scale bar = 5 mm) and their mammary fat pads ( center column , scale bar = 5 mm) and micrographs of mammary fat pad tissue sections stained with hematoxylin–eosin ( right column , scale bar = 50 μm).
Whole-genome gene expression analysis of MCF7 breast cancer cells transduced with control vector or pLXSN SATB1 was assessed by microarray analysis. We compared our results with those reported by Han et al. ( 1 ) for genes that they concluded were involved in cancer cell metastasis ( Supplementary Table 4 , available online). Essentially, no difference was observed in expression levels for most target genes when levels in MCF7 cells bearing control vector were compared with those in MCF7 cells overexpressing SATB1. These data further suggest that overexpression of SATB1 does not promote metastasis of breast cancer cells.
SATB1 Expression in Breast Cancer Cell Lines and Primary Tumors From Patients With Breast Cancer
Although we used similar reagents and techniques, our results did not agree with those published by Han et al. ( 1 ). To investigate differences in these results further, we used the Oncomine Research database to identify three studies ( 27–29 ) of SATB1 gene expression. These previously published independent datasets contained normalized SATB1 transcript levels in immortalized nontransformed mammary epithelial cells, nonaggressive breast cancer cell lines with a luminal subtype, and aggressive breast cancer cell lines with a basal subtype A or B. These three datasets were analyzed by use of an analysis of variance model of expression by breast cancer subtype (luminal, basal A, and basal B) ( Figure 5 ). We found essentially no increase in SATB1 transcript expression in aggressive basal breast cancer cell lines compared with nonaggressive luminal breast cancer cell lines.
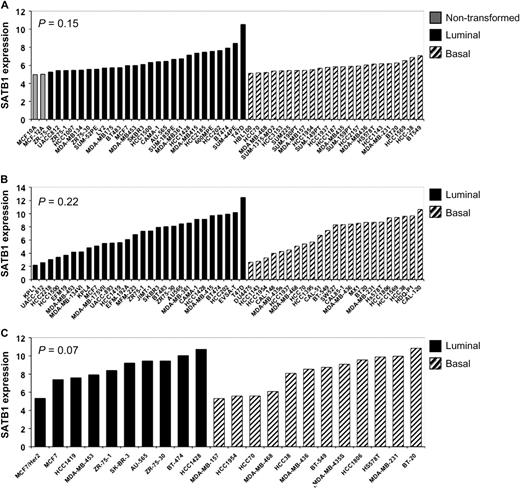
SATB1 expression in breast cancer cell lines. Normalized transcript levels of SATB1 in immortalized nontransformed mammary epithelial cells ( shaded bars ), nonaggressive luminal breast cancer cell lines ( solid bars ), and aggressive basal breast cancer cell lines ( hatched bars ) from independent previously published microarray datasets were extracted and analyzed. SATB1 expression was quantile normalized. A ) Neve et al. ( 27 ). B ) Hoeflich et al. ( 28 ). C ) Huang et al. ( 29 ). The statistical significance of differences in SATB1 expression as a function of these cell groups was determined by analysis of variance. Overall, essentially, no differences were identified between luminal and basal cells ( P = .197). All statistical tests were two-sided.
Data from six independent microarray studies ( 18–23 ) were used to examine the relationship of overall survival of patients with breast carcinoma and the level of SATB1 expression in tumors. We constructed Kaplan–Meier and Forest plots from these datasets ( 18–23 ) to investigate the association between survival and SATB1 expression, by separating SATB1 transcript expression into tertiles. We found that SATB1 expression was not associated with decreased overall survival of patients with primary breast cancer in these six studies (overall odds ratio = 0.80, 95% CI = 0.62 to 1.03, P = .10). We found that survival was similar across tertiles, although in some datasets [eg, Miller et al. ( 21 )], increased survival appeared to be associated with tumors expressing high SATB1 levels compared with those expressing lower levels of SATB1 ( Figure 6 and Supplemental Figure 6 , available online). Thus, SATB1 expression was not associated with either an aggressive phenotype in cultured breast cancer cells or poor patient survival. Analysis of these independent datasets supports the findings from our experiments that SATB1 is not a prognostic marker for breast cancer progression, and modification of SATB1 expression does not alter the phenotype of breast cancer cells in cultured cells or xenograft mouse models.
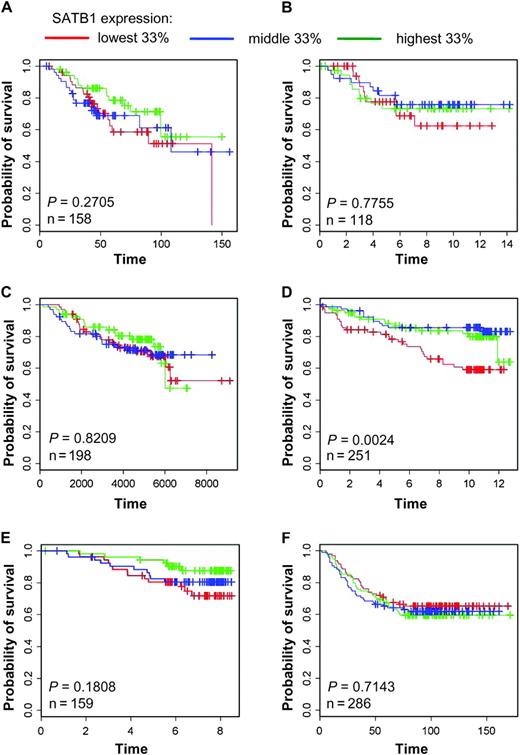
SATB1 expression in tumors from patients with primary breast cancer. Kaplan–Meier curves of overall survival of patients with breast carcinomas, stratified by tertiles of SATB1 expression, were plotted from data from six independent microarray studies ( 18–23 ). A ) Bild et al. ( 18 ). B ) Chin et al. ( 19 ). C ) Desmedt et al. ( 20 ). D ) Miller et al. ( 21 ). E ) Pawitan et al. ( 22 ), F ) Wang et al. ( 23 ). Cox proportional hazard models were fitted to the data, and χ 2 tests were used to assess statistical significance of differences in overall survival by SATB1 expression level. All statistical tests were two-sided.
SATB2 Expression in Breast Cancer Cell Lines and Primary Tumors From Patients With Breast Cancer
To determine whether SATB2 could compensate for SATB1, we examined the level of SATB2 expression in MDA-MB-231 cells whose SATB1 expression had been silenced with shRNA compared with parental MDA-MB-231 and vector control cells. We found that the level of SATB2 expression was not associated with the level of SATB1 expression ( Supplementary Figure 7, A , available online). In addition, when we examined the relationship of SATB2 expression to survival in six clinical datasets ( 18–23 ), SATB2 expression was not associated with patient survival ( Supplementary Figure 7, B–H , available online). Thus, SATB2 apparently does not compensate for loss of SATB1 expression and is not associated with aggressive breast cancer.
Discussion
SATB1 has been proposed as a key protein that controls the development and progression of breast cancer ( 1 ). However, in contrast to previous studies ( 1 ), we found no effect of modifying SATB1 expression on the transformed phenotype. Modifying SATB1 expression did not alter anchorage-independent growth, aggressive morphology, or cell migration of breast cancer cells in vitro and did not affect tumor formation or metastasis by breast cancer cells in vivo. In addition, SATB1 expression was not associated with poor prognosis of patients with primary breast cancer. No decrease in overall survival of patients with high SATB1 expressing tumors was observed in six independent microarray studies. Therefore, in contrast to Han et al. ( 1 ), we showed that SATB1 does not promote breast cancer progression and that SATB1 expression is not associated with disease outcome.
The disparate results between the study by Han et al. ( 1 ) and our study are not easily explained. For our biological studies using breast cancer cell lines and xenograft mouse models, we used similar, or identical when possible, reagents to those described by Han et al. ( 1 ). Thus, our contrasting results cannot be explained by the performance of alternative reagents. Therefore, additional independent studies are likely required to clarify the function of SATB1 in breast cancer.
For our examination of associations between SATB1 expression with breast cancer prognosis, we used published microarray data from multiple independent clinical studies ( 18–23 ). Our results showed that SATB1 expression was not a prognostic factor for survival of patients with breast cancer. The characteristics of patients in our study and patients in the study by Han et al. ( 1 ) were similar, particularly those in the dataset from Chin et al. ( 19 ) ( Table 1 ). The tumors included in the dataset from Chin et al. ( 19 ) were predominantly early stage (83% stages I and II), with an average diameter of 2.6 cm, and approximately 50% of the patients were lymph node positive ( 19 ). The tumors included in the study by Han et al. ( 1 ) were also predominantly early stage (84% stages I and II) and were of similar size, with 36% of the tumors being less than 2 cm in diameter, 56% of the tumors being between 2 and 5 cm in diameter, and only 8% of the tumors being greater than 5 cm in diameter. Similar to the Chin population ( 19 ), approximately 50% of the tumors included in the study by Han et al. ( 1 ) were lymph node positive. Therefore, the discrepancy in the clinical association findings between the study by Han et al. ( 1 ) and our study are not likely explained by differences in the patient cohorts.
However, this study had several limitations. In particular, our study was limited by our analysis of SATB1 transcript expression. The disparate findings reported by Han et al. ( 1 ) and our study could be attributed to the fact that Han et al. used the SATB1 protein level in their analyses of patient outcome, whereas we used the SATB1 transcript level. However, as the transcript and protein levels of SATB1 are highly associated ( 1 ), our different approaches may not explain this discrepancy. Again, further independent studies may be required to clarify any association of SATB1 with breast cancer prognosis. In addition, our study was limited by the use of immunodeficient mice to study primary and metastastic tumor formation in xenograft models. These studies are limited by the lack of a human microenvironment and immune response. However, our use of xenograft models cannot account for the discrepancy between our results and those of Han et al. ( 1 ) because they also used the same immunodeficient mouse model to study the effect of modifying SATB1 expression on primary and secondary tumor formation in vivo.
Therefore, the role of SATB1 expression in breast cancer is currently not clear. A review of the published literature for SATB1 did not provide evidence that SATB1 was a key regulator of cancer cell aggression or metastasis. A recent study ( 30 ) supports our findings that high SATB1 expression was not associated with poor clinical outcome in breast cancer. The disease-free survival and overall survival curves for patients with breast cancer whose tumors were classified as having high levels of SATB1 transcript did not differ from those for patients whose tumors had low levels of SATB1 transcript ( 30 ). We also found no association of SATB1 expression with overall survival. This result is in contrast to that of Han et al. ( 1 ) who found that higher SATB1 expression levels were associated with statistically significantly shorter overall survival times.
Furthermore, other studies examining the function of SATB1 did not provide evidence that SATB1 is important for cancer cell aggression. Several studies ( 31 , 32 ) have found that SATB1 expression inhibits cancer cell proliferation, the opposite result to that expected if SATB1 was important for cancer cell aggression. Additionally, an earlier study ( 33 ) exploring the long-range regulation of the transcription factor PU.1 in acute myeloid leukemia reported that reduced expression of PU.1 led to the development of acute myeloid leukemia with cytogenetic aberrations in mice. They showed that SATB1 is a positive regulator of PU.1 expression and that inhibition of SATB1 by use of small interfering RNA led to a specific reduction in PU.1 mRNA and protein. Thus, SATB1 expression in this model acted like a tumor suppressor to prevent the development of acute myeloid leukemia by enhancing PU.1 expression ( 33 ). Finally, silencing of SATB1 expression in the HEK293 cell line with small interfering RNA did not alter the expression of critical genes involved in metastasis ( 2 ), as outlined in the study by Han et al. ( 1 ), providing further evidence that SATB1 may not be a critical regulator of the aggressive metastatic cancer cell phenotype. Thus, these studies and our findings do not support the hypothesis that SATB1 is a critical regulator of, or prognostic marker for, cancer progression or survival. Our results therefore suggest that the use of SATB1 as a therapeutic target or prognostic marker for human breast cancer should be viewed with caution.
Funding
This study was supported by a developmental grant from the Papanicolaou Corps for Cancer Research (304877).
References
The authors had full responsibility for the design of the study; the collection, the analysis, and interpretation of the data; the decision to submit the article for publication; and the writing of the article.
E. Iorns and H. J. Hnatyszyn contributed equally to this work.

