


Abstract
Protein–protein interactions are considered as one of the next generation of therapeutic targets. Specific tools thus need to be developed to tackle this challenging chemical space. In an effort to derive some common principles from recent successes, we have built 2P2Idb (freely accessible at http://2p2idb.cnrs-mrs.fr), a hand-curated structural database dedicated to protein–protein interactions with known orthosteric modulators. It includes all interactions for which both the protein–protein and protein–ligand complexes have been structurally characterized. A web server provides links to related sites of interest, binding affinity data, pre-calculated structural information about protein–protein interfaces and 3D interactive views through java applets. Comparison of interfaces in 2P2Idb to those of representative datasets of heterodimeric complexes has led to the identification of geometrical parameters and residue properties to assess the druggability of protein–protein complexes. A tool is proposed to calculate a series of biophysical and geometrical parameters that characterize protein–protein interfaces. A large range of descriptors are computed including, buried accessible surface area, gap volume, non-bonded contacts, hydrogen-bonds, atom and residue composition, number of segments and secondary structure contribution. All together the 2P2I database represents a structural source of information for scientists from academic institutions or pharmaceutical industries.
INTRODUCTION
Protein–protein interactions (PPIs) represent a promising new class of attractive therapeutic targets, and the advancement in drug discovery efforts against PPIs has been recently referred as ‘the unmined biology gold reserve’ (1). However, PPIs are still considered as extremely difficult for targeting by small-molecules due to the structural characteristics of the interface, and specific strategies need to be undertaken to tackle this particularly challenging class of drug targets [for reviews see (2–5)]. Successes in drug discovery developments against PPI targets face two major issues, i.e. druggability assessment and adequacy of the chemical libraries used for screening. Over the last decade more and more orthosteric PPI modulators have been reported, and hundreds of small molecule inhibitors have now been developed for more than 40 PPI targets (4). Our goal is to use the structural knowledge from these success stories to derive some common principles to help future target selection and to accelerate the process of drug discovery in this field.
There are many structural databases dedicated to protein–protein complexes (6–14), to protein–ligand (15,16) or to small molecule inhibitors of PPIs (17–19). We have recently developed a hand-curated structural database (2P2Idb) by collecting information about protein–protein interfaces for which both the protein–protein and protein–inhibitor complexes have been structurally characterized, and we identified key descriptors of PPIs with known inhibitors (20). To our knowledge, 2P2Idb is the only structural database dedicated to orthosteric PPI modulators with structural information for protein–protein and protein–ligand complexes as well as for small molecule compounds. Although this database is relatively small at the moment, the hope is that, as it grows, patterns will emerge for both protein–protein interfaces and small molecule inhibitors.
RESULTS
Presentation of 2P2Idb
2P2Idb is a relational database that was built through data mining from literature and by exhaustive search of the Protein Data Bank (20). To focus on orthosteric inhibitors, we have selected the cases for which both the protein–protein and protein–ligand complexes had been 3D-characterized (by X-ray or nuclear magnetic resonance) and for which the inhibitor is clearly competing at the interface. As of today, it contains 14 protein–protein complexes, 60 protein–inhibitor complexes, 16 free proteins and 55 small molecule modulators. The protein–protein complexes were subdivided into two classes corresponding to protein–peptide (cluster 1) and to globular protein–protein (cluster 2) complexes based on the number of segments at the interface. An interface segment is defined as a stretch of residues that starts and ends with interface residues and may contain intervening non-interface residues, but only in stretches of not more than four (21). The general interface properties are summarized for the two clusters in Table 1 showing that they differ notably. In particular, complexes from Cluster 1 can be disrupted with modified peptides such as staple peptides or with peptide mimetics whereas complexes that belong to Cluster 2 cannot. Furthermore, protein–protein complexes from Cluster 1 usually correspond to lower affinity complexes whereas those from Cluster 2 correspond to higher affinity complexes, on average. We have compared the general biophysical, biochemical and structural properties of the interfaces found in 2P2Idb with those of representative datasets of hetero and homodimers to establish a characteristic profile for ‘druggable’ protein–protein complexes (20 and Table 1). A web interface has been developed to facilitate access to pre-calculated data and to related websites.
The table provides ‘means’ and ‘standard deviations’ of several interface parameters calculated for the two classes of druggable complexes in 2P2Idb
| Interface properties | 2P2IDB | Heterodimers | Homodimers | |||
|---|---|---|---|---|---|---|
| Cluster 1 | Cluster 2 | Cluster 1 | Cluster 2 | Cluster 1 | Cluster 2 | |
| No. of complexes | 7 | 7 | 189 | 336 | 331 | 1442 |
| BASA (Å2) | 1384.7 ± 516.1 | 1793.3 ± 591.6 | 2149.2 ± 1017.6 | 2769.3 ± 1411.4 | 2307.2 ± 1503.1 | 3042.1 ± 1823.1 |
| Gap volume (Å3) | 2282.8 ± 1351.5 | 5085.2 ± 2199.7 | 3906.7 ± 1745.2 | 6670.3 ± 3128.1 | 3780.8 ± 1775.1 | 6969.9 ± 3716.9 |
| Non-bonded contacts | 74.4 ± 27.5 | 94.4 ± 39.9 | 114.5 ± 57.2 | 151.5 ± 84.1 | 114.2 ± 80.4 | 164.6 ± 114.1 |
| Total no. of segments | 4.1 ± 1.1 | 8.1 ± 1.8 | 6.1 ± 2.7 | 10.8 ± 3.8 | 3.9 ± 1.1 | 10.7 ± 4.6 |
| No. of hydrogen bonds | 2.4 ± 1.3 | 3.3 ± 2.5 | 4.8 ± 3.7 | 6.7 ± 5.0 | 4.6 ± 5.4 | 7.2 ± 6.3 |
| No. of salt bridges | 0.6 ± 0.8 | 0.6 ± 0.8 | 1.8 ± 1.8 | 2.0 ± 1.8 | 1.4 ± 1.8 | 2.0 ± 2.5 |
| No. of disulfide bonds | 0.0 ± 0.0 | 0.0 ± 0.0 | 0.03 ± 0.2 | 0.03 ± 0.2 | 0.01 ± 0.1 | 0.01 ± 0.1 |
| % Charged residues | 20.9 ± 8.8 | 28.9 ± 11.5 | 28.7 ± 13.2 | 26.6 ± 11.7 | 26.6 ± 12.8 | 25.6 ± 11.5 |
Complexes from Cluster 1 correspond to protein–peptide complexes and can be disrupted with modified peptide or peptide mimetics. Complexes from Cluster 2 correspond to higher affinity complexes. Values for nonredundant representative datasets of hetero- and homo-dimeric complexes collected through the Dockground server are indicated as comparison for both classes.
Description of 2P2Idb web interface
Since its first release in 2010, the 2P2Idb website has been completely revisited by including a user friendly interface and more features. For each PPI family, clickable information can be found about protein–protein, protein–ligand complexes and free proteins as well as small molecule orthosteric modulators. Several links to relevant databases are provided such as published abstracts (PubMed), protein information (UniProt), 3D structures (PDBsum, PDBe), ligand properties (ChemSpider), protein–protein and protein–ligand binding affinities (PDBBind, BindingDB, ChEMBL or MOAD). A large number of pre-calculated interface parameters are accessible for each protein–protein complex. These interface descriptors include, total interface area, gap volume, percentage of charged residues, segments, non-bonded contacts, hydrogen bonds, salt bridges, disulfide bonds, secondary structure as well as atom and residue properties for each chain. The detailed list of non-bonded contacts, hydrogen bonds and salt bridges can be accessed through popup windows. Protein–protein and protein–ligand complexes can be interactively visualized through Jmol applets with customized menus and predefined representations. Furthermore, all protein structures in 2P2I database can be easily downloaded from our website (http://2p2idb.cnrs-mrs.fr/download.html) and analysed with external molecular visualization program viewers. In the downloaded files, 3D structures from the same family of complexes have been superimposed to the unbound form to facilitate user analysis and comparison. PDB structures can be downloaded by protein family or by complex type (protein–protein or protein–ligand).
2P2Iinspector: a protein–protein interface analysis tool
Several tools are available to analyse protein–protein interfaces. However, most of them are dedicated to the prediction of hotspots residues or binding pockets (22). Other servers provide structural and chemical information on protein–protein associations. Protein Interactions Calculator (PIC) is a server which computes contact information but does not calculate topological parameters such as gap volume and surface area (23). PISA is a tool for exploring macromolecular interfaces and surfaces (24). However, it is more dedicated to the prediction of probable quaternary structures from crystal contacts. In the first release of the 2P2I database, most interface parameters had been calculated through the ProtorP web server which has been discontinued and is no longer available (25). We have therefore developed our own, and enhanced, version of this tool by computing more interface parameters. 2P2Iinspector is a complete new tool that computes interaction properties from the 3D structure of protein–protein complexes. A total of 58 descriptors are now computed using in-house tcl scripts implemented in VMD (26) and SURFNET (27). These physical and chemical parameters include a large range of descriptors such as number of segments, buried accessible surface area, gap volume, non-bonded contacts, hydrogen-bonds, secondary structure contribution, atom and residue properties, and atomic composition. This new open access tool can be used to calculate interface parameters of protein complexes either from the PDB (using valid four-letter code) or by uploading a PDB file. The computed parameters can be accessed through the web interface for both chains of the protein–protein complex. Users can easily switch from the results of one chain to the other. Popup windows give easy access to the lists of non-bonded contacts, hydrogen bonds and salt bridges. The protein–protein complexes can be visualized interactively with a Jmol applet with the same functionalities described for the 2P2I database. Files are stored for 48 h before being deleted and during that period users can access their data via a direct unique link. Finally, results can be downloaded and then easily accessed locally as html files.
2P2Iscore: assessing the druggability of protein–protein interfaces
The difficulty of targeting PPIs emphasizes the importance of target selection. From a previous study, we defined six key interface parameters to characterize protein–protein complexes with a known modulator (20). We have used these descriptors to assess the druggability of protein–protein interfaces after the target has been assigned to a cluster type (protein–peptide or protein–protein) based on the number of segments at the interface. A qualitative prediction is proposed, which is based on the standard deviation of each of the six interface parameters to the mean of the same parameter in the equivalent 2P2I cluster.
Users can compare parameters from their own protein–protein interface to a distribution of parameters from the 2P2Idb dataset. Five parameters can be easily computed on our website using 2P2Iinspector tool. We recommend using Q-SiteFinder to calculate the remaining descriptor, i.e. the interfacial pocket volume, because this server was used to estimate the size of pockets at the interface in 2P2Idb (20,28). A qualitative score is given for each parameter and a color coded table provides the deviation of each parameter compared to the mean of the same parameter in the equivalent 2P2I cluster.
CONCLUSIONS AND FUTURE DEVELOPMENTS
The 2P2I website (Figure 1) provides structural information about the modulation of PPIs with orthosteric inhibitors. A number of features give access to pre-calculated interface parameters and to related websites. A scoring function is available to qualitatively assess the druggability of protein–protein interfaces with prior 3D knowledge (2P2Iscore). A tool has been specifically developed to analyse protein–protein interfaces in terms of physico-chemical, topological or geometric features (2P2Iinspector). Future releases of the database will include new complexes and PPI modulators as they appear in the Protein Data Bank (29), new interface parameters (more particularly interfacial pockets) for the 2P2Iinspector tool and an automated version of 2P2Iscore with a quantitative scoring function.
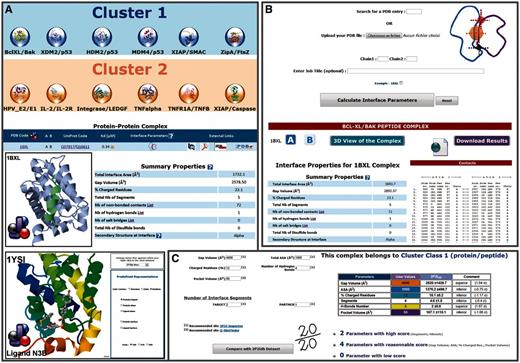
The 2P2I website and its main features. (A) 2P2Idb is a hand-curated database dedicated to the inhibition of protein–protein complexes with orthosteric modulators. It displays structural information about protein–protein, protein–ligand complexes and small molecule inhibitors. For each of the 14 families, sub-divided into two classes (protein–peptide and protein–protein), clickable html pages are provided with pre-calculated interface parameters, binding affinity data and links to related sites of interest (UniProt, PubMed, PDBsum, PDBe and ChemSpider). Protein–protein and protein–ligand complexes can be interactively visualized using Jmol applets and user-friendly menus. (B) 2P2Iinspector is a tool to analyse protein–protein interfaces in terms of geometric and physico-chemical descriptors. A total of 60 descriptors are computed including, buried accessible surface area, gap volume, non-bonded contacts, hydrogen-bonds, atom and residue composition, number of segments and secondary structure contribution. Users can analyze protein complexes from the PDB using standard four letter accession codes or upload their own files. (C) 2P2Iscore is a tool to assess the druggability of protein–protein interfaces. Comparison of protein–protein interfaces in 2P2Idb with standard heterodimers has allowed us to define six interface parameters to characterize protein–protein interfaces with a known modulator. Users are invited to compute five parameters using the 2P2Iinspector tool. The interfacial pocket volume should be calculated with Q-SiteFinder (http://www.modelling.leeds.ac.uk/qsitefinder). A color-coded table is provided to compare user defined parameters to those in 2P2Idb. A qualitative score is given for the six key parameters to assess the druggability of the interface. Detailed help documentation is available as PDF files for the different features.
We expect that this new version of the 2P2I database provides a useful source of information to characterize protein–protein interfaces and to design modulators of PPIs and is therefore of major interest for the scientific community.
FUNDING
Funding for open access charge: Agence Nationale de la Recherche [ANR-11-BS07-019-02].
Conflict of interest statement. None declared.
ACKNOWLEDGEMENTS
The authors thank colleagues at the Cancer Research Center of Marseille for testing the webserver during construction.

Comments