


Abstract
The Comparative Toxicogenomics Database (CTD; http://ctdbase.org/) provides information about interactions between environmental chemicals and gene products and their relationships to diseases. Chemical–gene, chemical–disease and gene–disease interactions manually curated from the literature are integrated to generate expanded networks and predict many novel associations between different data types. CTD now contains over 15 million toxicogenomic relationships. To navigate this sea of data, we added several new features, including DiseaseComps (which finds comparable diseases that share toxicogenomic profiles), statistical scoring for inferred gene–disease and pathway–chemical relationships, filtering options for several tools to refine user analysis and our new Gene Set Enricher (which provides biological annotations that are enriched for gene sets). To improve data visualization, we added a Cytoscape Web view to our ChemComps feature, included color-coded interactions and created a ‘slim list’ for our MEDIC disease vocabulary (allowing diseases to be grouped for meta-analysis, visualization and better data management). CTD continues to promote interoperability with external databases by providing content and cross-links to their sites. Together, this wealth of expanded chemical–gene–disease data, combined with novel ways to analyze and view content, continues to help users generate testable hypotheses about the molecular mechanisms of environmental diseases.
INTRODUCTION
Exposure to environmental chemicals may influence human health (1,2). The molecular mechanisms of action between chemicals and gene products, however, are not well understood. Toward that end, the Comparative Toxicogenomics Database (CTD; http://ctdbase.org) is a public resource that provides information about the interaction of environmental chemicals with gene products and their effect on human disease (3–6). This information is first garnered from the scientific literature by professional biocurators who manually curate a triad of core interactions including chemical–gene, chemical–disease and gene–disease relationships (7). These core data are then internally integrated to generate inferred chemical–gene–disease networks. Additionally, the core data are integrated with external data sets such as Gene Ontology (GO) and pathway annotations (from KEGG and Reactome) to establish novel inferences. A unique and powerful feature of CTD is the inferred relationships generated by data integration, following the Swanson ABC model of knowledge transfer (8): if chemical A interacts with gene B and independently gene B is directly associated with disease C, then chemical A has an inferred relationship to disease C (inferred via gene B). This knowledge transfer can be expanded to include any type of information directly annotated to chemicals, genes or diseases; thus, if GO term A is annotated to gene B, and independently gene B directly interacts with chemical C, then GO term A has an inferred relationship to chemical C (inferred via gene B). Such inferred connections can be statistically scored to help indicate the significance of the association (B. L. King et al., submitted for publication), provide novel insights that expand CTD content (4) and allow users to analyze toxicogenomic information from different perspectives. These inferences make CTD more informative than the sum of its individual curated parts (7).
To increase the efficiency and productivity of manual curation, we developed and implemented several procedures, including the use of a streamlined curation paradigm (7); development of a sophisticated, yet easy-to-use, web-based annotation tool for remote biocurators (7) and the creation and adoption of practical controlled vocabularies (9). Selecting articles for manual curation at CTD is typically performed via a chemical-centric approach, wherein PubMed (http://www.ncbi.nlm.nih.gov/pubmed/) is queried for publications that describe a chemical-of-interest. To complement this process, we recently introduced a new journal-centric approach for triaging literature to help ensure data currency in CTD (A. P. Davis et al., submitted for publication). We also continue to refine text-mining processes to rank and prioritize articles for curation (10,11). Finally, a collaborative project with Pfizer, Inc. (see below) provided an additional corpus of over 80 000 toxicology papers.
Here, we provide an update to CTD, describing its increased data content and several new analytical and visualization tools and enhancements since our 2011 report (4). These updates further expand the utility of CTD for environmental health research.
NEW FEATURES
Increased data content
In September 2010, CTD initiated a collaborative project with Pfizer, Inc. to curate a corpus of >80 000 Pfizer-selected toxicology papers triaged for therapeutic drug interactions with four diseases-of-interest (cardiovascular, renal, neurological and hepatic disorders). In 10 months, five CTD biocurators manually reviewed the entire corpus and found that 53 951 of the papers contained curatable data for CTD. Curated data from this project are now fully integrated with core CTD and freely available to all users. The curation of the Pfizer corpus, along with CTD’s regular literature selection process, has dramatically increased the database content. In July 2012, CTD contained data from 94 513 articles, from whence 799 204 interactions were manually curated (599 182 chemical–gene, 176 627 chemical–disease and 23 395 gene–disease interactions) for 11 755 unique chemicals, 27 950 unique genes and 5987 unique diseases (Table 1). Internal integration of these data generates >10.1 million inferred gene–disease relationships and 913 622 inferred chemical–disease relationships. Integration with external data sets from GO (12) and pathway annotations from KEGG (13) and Reactome (14) provides the basis for additional inferred relationships. In total, 15.6 million toxicogenomic relationships are provided for analysis, representing a 3.6-fold increase in content since our last report in 2011 (4) and a 10.6-fold increase since our original report in 2009 (5). To make the most of this updated content, new users of CTD should consult our ‘Help’ menu (http://ctdbase.org/help) and ‘FAQ’ section (http://ctdbase.org/help/faq/) for more information and step-by-step instructions about performing simple and advanced queries in CTD.
Increase in CTD content from 2008 to 2012
| July 2012 | December 2010 | December 2008 | |
|---|---|---|---|
| Curated data types | |||
| Articles | 94 513 | 23 918 | 10 854 |
| Chemicals | 11 755 | 6217 | 4323 |
| Genes | 27 950 | 18 446 | 15 140 |
| Diseases | 5987 | 3703 | 3445 |
| Relationships | |||
| Direct chemical–gene interactions | 599 182 | 283 976 | 147 285 |
| Direct gene–disease relationships | 23 395 | 12 505 | 7456 |
| Direct chemical–disease relationships | 176 627 | 9264 | 4181 |
| Inferred gene–disease relationships | 10 132 094 | 1 170 317 | 472 423 |
| Inferred chemical–disease relationships | 913 622 | 284 205 | 117 974 |
| Enriched chemical–GO relationships | 2 221 348 | 1 166 669 | n/a |
| Enriched chemical–pathway relationships | 211 782 | 213 261 | n/a |
| Inferred disease–pathway relationships | 46 912 | 24 258 | n/a |
| Gene–GO annotationsa | 807 848 | 855 215 | 685 781 |
| Gene–pathway annotationsa | 63 393 | 55 912 | 45 795 |
| Inferred disease–GO relationships | 465 797 | 229 810 | n/a |
| Total relationships | 15 662 000 | 4 305 392 | 1 480 895 |
aImported from external databases.
n/a, not available.
Link-outs and adoption of CTD content by other databases
CTD continues to expand its connectivity with external databases. We now include links on CTD Chemical pages to ChEBI (15), a dictionary of molecular entities focused on small chemical compounds; to PubChem (16), a repository of chemical compounds and their associated biological activities; and to TOXLINE (17), a bibliographic database of toxicology articles. CTD Gene pages now link to WikiGenes, an author-driven wiki system of biological information (18) and NCBI Gene (19) provides links back to CTD Gene pages. In total, CTD links out to 25 external databases from our Chemical, Gene, Disease, Organism, GO, Pathway and Reference pages (Table 2). As a federally funded public database, CTD content is often linked to, repackaged or integrated with other database products. Currently, we are aware of 37 external databases that either use CTD content at their site or link back to CTD (Table 3). This connectivity augments data access for users of both CTD and other linked resources. This interoperability and adoption of CTD data allows for cross-integration of additional information with CTD content in the future. In compliance with the bioDBcore initiative (20), the core attributes describing CTD are provided in Supplementary Table S1. CTD data files are freely available from either individual pages or our ‘Downloads’ tab (http://ctdbase.org/downloads/) in multiple formats (CSV, TSV, XML, Excel and OBO).
CTD’s links to external databases
CTD’s links to external databases
Databases using CTD content or providing links to CTD
| Database | Description | Database URL |
|---|---|---|
| AutismKB | Autism knowledgebase | http://autismkb.cbi.pku.edu.cn/index.php |
| BIAdb | Benzylisoquinoline alkaloids database | http://crdd.osdd.net/raghava/biadb/ |
| BioGraph | Biomedical knowledge discovery server | http://biograph.be/about/welcome |
| BioXM | BioXM™ Knowledge Management Environment | http://www.biomax.com/products/bioxm.php |
| BPAGenomics | Bisphenol A genomics data portal | http://www.eh3.uc.edu/GenomicsPortals/tiles.jsp?portal= BPAGenomics |
| CancerResource | Cancer-related database | http://bioinf-data.charite.de/cancerresource/index.php?site =home |
| Chem2Bio2RDF | Semantic system for chemical biology | http://cheminfov.informatics.indiana.edu:8080/ |
| ChemIDplus | Chemical dictionary and structure database | http://chem2.sis.nlm.nih.gov/chemidplus/chemidlite.jsp |
| ChemProt | Annotated and predicted chemical–protein interactions | http://www.cbs.dtu.dk/services/ChemProt/ |
| ChemSpider | Chemical structures and property predictions | http://www.chemspider.com/ |
| DDSS | Drug Discovery and Diagnostic Support System | http://www.ps.noda.tus.ac.jp/ddss/ |
| GAD | Genetics Association Database | http://geneticassociationdb.nih.gov/ |
| Galaxy | Web-based platform for biomedical data analysis | https://main.g2.bx.psu.edu/ |
| GeneSetDB | Meta-database integrating human disease and pharmacology | http://www.genesetdb.auckland.ac.nz/haeremai.html |
| GeneWeaver | Integrates functional genomics experiments | http://geneweaver.org/ |
| GPSy | Gene Prioritization SYstem that prioritizes genes for functional analyses | http://gpsy.genouest.org/ |
| Harvester Portal | Aggregate portal of scientific sites | http://harvester.kit.edu/harvester/ |
| HOMER | Human Organ-specific Molecular Electronic Repository | http://discern.uits.iu.edu:8340/Homer/index.html |
| MIRIAM | Pharmacogenomics data collections | http://www.ebi.ac.uk/miriam/main/tags/MIR:00600039 |
| NCBI Gene | Gene LinkOuts | http://www.ncbi.nlm.nih.gov/gene |
| PharmDB | Pharmacological network database | http://pharmdb.org/ |
| PharmGKB | PharmacoGenomics KnowledgeBase | http://www.pharmgkb.org/ |
| PhenoHM | Human-Mouse comparative phenome-genome server | http://phenome.cchmc.org/phenoBrowser/Phenome |
| PPDB | Pathogenic Pathway Database for Periodontitis | http://bio-omix.tmd.ac.jp/disease/perio/ |
| PubChem | Database of chemical molecules | http://pubchem.ncbi.nlm.nih.gov/ |
| Reactome | Pathway database | http://www.reactome.org/ReactomeGWT/entrypoint.html |
| RefGene | Index of genes and antibodies | http://refgene.com/ |
| RGD | Rat Genome Database disease and pathway portals | http://rgd.mcw.edu/rgdweb/ontology/search.html |
| STITCH | Search Tool for InTeractions of CHemicals | http://stitch.embl.de/ |
| T3DB | Toxin, Toxin-Target Database | http://www.t3db.org/ |
| ToppGene | Portal of gene information | http://toppgene.cchmc.org/ |
| TOXLINE | Toxicology literature online | http://toxnet.nlm.nih.gov/cgi-bin/sis/htmlgen?TOXLINE |
| TOXNET | Toxicology data network | http://toxnet.nlm.nih.gov/ |
| UCSC | UCSC genome browser | http://genome.ucsc.edu/ |
| UniProt | Universal Protein Resource | http://www.uniprot.org/ |
| WENDI | Web Engine for Non-obvious Drug Information | https://cheminfov.informatics.indiana.edu:8443/WENDI_ PUBLIC/WENDI.jsp |
| WhichGenes | Gene-set building portal | http://www.whichgenes.org/ |
Enhanced data features
We enhanced CTD by adding four new computational and network scoring features:
DiseaseComps. Every curated disease now includes a ‘DiseaseComp’ data tab. This metric statistically identifies diseases with shared toxicogenomic profiles, allowing users to find other disorders similar to their disease-of-interest (21). Users can refine their analysis based upon the type of disease interaction: either via chemical or gene connections or either via marker/mechanism or therapeutic associations. For example, in CTD autistic disorder is directly connected to 84 chemicals and 242 genes. DiseaseComps statistically identifies other diseases with similar chemical and gene interaction profiles, including whether the relationship is etiological or therapeutic and ranks them based upon their similarity index to produce a list of comparable disorders. DiseaseComps that are based on genes with a marker/mechanism relationship to autistic disorder include intellectual disability and schizophrenia, as well as less intuitive diseases such as prostate and lung cancer, hypotension, hypertension and obesity (Figure 1), provoking the testable hypotheses of whether similar pathways may be involved in these disorders and subsequently if current therapeutics for those diseases might also have beneficial effects on autism.
Filtering data sets. The ability to filter data based upon the type of interactions (as shown above for DiseaseComps) was also applied to other analytical tools in CTD. GeneComps and ChemComps (22) can now be filtered by the type of interaction (activity, expression, binding) and by the direction of the interaction (increase versus decrease) to provide the user with more comparable results. For example, chemicals that increase the expression of gene HMOX1 also increase the expression of a group of genes (including NQO1, GCLC and NOS2), while chemicals that decrease the expression of HMOX1 decrease the expression of a very different gene set (Figure 2). Our analytical tool VennViewer (which allows users to compare associated data sets for up to three chemicals, diseases or genes) can now also be filtered by the direction and type of chemical–gene interaction.
Inference gene–disease network scores. Inferred gene–disease relationships form the bulk of CTD content (Table 1). These inferences are powerful hypothesis-generating data sets: if gene A has a curated interaction with chemical B, and independently chemical B is directly associated with disease C, then CTD integration generates an inference between gene A and disease C (inferred via chemical B). Similar to our chemical–disease network scores (4, B. L. King et al., submitted for publication), we now also utilize local network topology-based statistics to evaluate these inferred gene–disease relationships. These scores allow users to sort and rank the predicted gene–disease relationships to help prioritize hypothesis testing.
Enriched pathway relationships. KEGG and Reactome are resources that provide widely used annotations that assign gene products to molecular pathways (13,14). Typically, such pathway annotations are used to retrieve and organize extensive biological knowledge about gene lists. We have uniquely used these genetic pathway annotations to help explore the actions of non-genetic molecules (i.e. chemicals) by associating pathway data with chemicals via their curated interacting genes. These data are provided on the ‘Pathway’ data tabs for chemicals. They are calculated similar to our previously described enriched GO annotations for chemicals (4) and are intended to help users generate testable hypotheses about molecular pathways perturbed by chemical exposures.
DiseaseComps finds similar disorders. CTD’s Disease page for autistic disorders contains a ‘DiseaseComps’ data tab that allows users to see similar disorders based upon shared chemicals or genes and either via marker/mechanism or therapeutic relationships. Users can toggle open any of the different representations of the comparable diseases, as shown here for ‘via gene marker/mechanism associations’. In addition to intuitive disorders such as intellectual disability and schizophrenia (the top two comparable diseases identified), it is also discovered that autism shares many genes with non-obvious diseases (red boxes) such as prostatic neoplasms (30 genes), lung neoplasms (17 genes), hypotension (12 genes), obesity (10 genes) and hypertension (11 genes). Clicking on the hyperlinked gene count in the right-hand column opens another window listing the common interacting genes. The Similarity Index is derived from the Jaccard similarity coefficient (22).
Filtering GeneComps by type of interaction. CTD users can now filter ChemComps and GeneComps based on the direction and type of interaction, as shown here for gene HMOX1. The panel on the left displays other genes that are comparable to HMOX1 based on filtering for chemicals that increase the expression of the genes (red lariat). The panel on the right, however, produces a different set of comparable genes to HMOX1 based on chemicals that decrease the expression of genes (green lariat). Users can also filter for activity, binding or all (unfiltered) interaction types.
New tools
To help navigate the 15.6 million toxicogenomic relationships in CTD, we created a package of analytical and visualization tools, accessible under the ‘Analyze’ menu. We have previously described the Batch Query, VennViewer and MyGeneVenn tools (4,5). To this suite, we added the following:
MyVenn. This tool allows users to generate Venn diagram for expanded CTD data sets including GO terms and Pathway annotations, as well as any user-defined terms (http://ctdbase.org/tools/myVenn.go). The tool automatically converts the input items to lower case and compares them in a case-insensitive manner, as well as removing any duplicate items in a data set. The tool allows users to quickly generate a Venn diagram for comparative analysis of data sets.
Gene set enricher. This tool finds enriched GO or pathway annotations associated with any gene set. A user can access the tool directly (http://ctdbase.org/tools/enricher.go) with their specific list of genes (using either NCBI gene symbols or accession identifiers), choose their enrichment analysis and configure the results via any corrected (or raw) P-value threshold. The tool is also integrated with every chemical–disease view in CTD (i.e. the ‘Diseases’ data tab on a CTD Chemical page or the ‘Chemicals’ data tab on a CTD Disease page). For example, CTD indicates that the organophosphorus nerve agent Soman interacts with 14 genes known to play a role in seizures, forming the inference network ‘Soman—14 genes—seizures’ (Figure 3). With the Gene Set Enricher tool options embedded in the web display, users simply click on the ‘GO’ button under the ‘Enrichment Analysis’ column to identify GO terms that are enriched for those 14 genes. The output ranks 84 GO terms enriched for these 14 genes, including the biological processes synaptic transmission (GO:0007268) and cognition (GO:0050890). From this results page, users can further revise the analysis by selecting corrected versus raw P-values, changing the P-value threshold and filtering the results via the three ontology branches of GO (Figure 3). Similarly, by clicking on the ‘Pathway’ button under the ‘Enrichment Analysis’ column, users can identify pathways that are enriched for those genes and learn more about the molecular mechanisms that may underlie a chemical–disease connection. For example, the most highly enriched pathway for the Soman-seizures relationships (data not shown) is the neuroactive ligand–receptor interaction (KEGG:04080).
Enrichment analysis of genes in chemical inference networks. CTD’s Chemical page for the nerve agent Soman has the ‘Diseases’ data tab highlighted, listing the diseases to which Soman can be linked (either directly or by an inferred network of genes). By clicking the ‘GO’ button under the ‘Enrichment Analysis’ column for the first listed disease (Seizures), the tool automatically sends the 14 genes listed in the ‘Inference Network’ column (red dashed box) to the Gene Set Enricher tool (red arrow). The results (red inset box) include 84 enriched GO terms associated with these 14 genes. The list can be further revised by selecting corrected versus raw P-values, changing the P-value threshold itself and filtering the results for any of the three GO branches. Similar analysis can be performed for Pathway annotations by clicking the ‘Pathway’ button under the ‘Enrichment Analysis’ column.
New visualization strategies
A growing challenge for databases is developing ways to visualize large data sets to enhance knowledge management for the user (23–25). Toward that end, CTD has begun implementing processes to visualize our content using three different approaches.
All curated chemical–gene interactions are now color-coded on web pages to indicate the directionality of the interaction. Statements that describe an ‘increase’ in an interaction are colored red, ‘decrease’ interactions are displayed in green and for instances where the direction is not specified by the authors, the interaction is colored brown (Figure 4a). The red/green color choice parallels the directionality described in early microarray assays.
The ‘ChemComps’ data tab on a CTD Chemical page now provides the option to visualize the networks of common interacting genes for the top 10 ranked comparable chemicals using a Cytoscape Web display to enhance the visualization and interconnectivity of the molecules that form the share toxicogenomic profile (Figure 4b). The Cytoscape map is customizable by the user, allowing for different layout styles and toggling node and edge labels. Right-clicking on any node provides additional options. The map may be exported in several image formats (PNG, PDF, SVG) and data formats (XGMML, GRAPHML, SIF). This visualization works particularly well with smaller networks and requires both JavaScript and Flash on a user’s computer. For larger networks, a XGMML file is provided for users to use via a desktop version of the open-source application Cytoscape (26).
To curate disease information, CTD biocurators annotate using MEDIC (9), a merged disease vocabulary of Medical Subject Headings (MeSH) disease terms (27) and the Online Mendelian Inheritance in Man (28). MEDIC contains over 9700 primary terms and 59 000 synonyms, making it a practical disease vocabulary that is both deep and broad (9). To summarize this vocabulary, we created a ‘MEDIC-Slim’ list. MEDIC-Slim is a high-level set of terms, derived from the MeSH tree structure for Diseases [C] and Mental Disorders [F03] branches, that organizes all 9700 MEDIC diseases into 36 generic categories, allowing similar types of diseases to be grouped and analyzed for meta-analysis, better visualization and improved knowledge management. The mapping of diseases to their MEDIC-Slim levels was accomplished by collapsing terms upward in the hierarchy until resolving at a top-level MEDIC-Slim term. Because MEDIC is a broad hierarchy, individual diseases often map to more than one MEDIC-Slim level; for example, ‘Diabetes Mellitus, Type 1’ resolves to three generic categories: metabolic disease, endocrine system disease and immune disease, providing a quick classification of the disorder. These mappings to MEDIC-Slim are now displayed on CTD and are available in our downloadable MEDIC files (http://ctdbase.org/downloads/#alldiseases). MEDIC-Slim reduces the complexity of interpreting inferred disease relationships. Currently, CTD contains data for almost 6000 unique diseases, including >200 000 direct disease relationships and 11 million inferred relationships (Table 1). Viewing this extensive data set via the 36 MEDIC-Slim categories provides a perspective of the entire disease landscape in CTD (Figure 5). The top disease categories for both direct and inferred relationships currently include cancer, nervous system, cardiovascular and digestive system diseases. To help manage this knowledge, users can now filter disease relationships via MEDIC-Slim categories on any ‘Diseases’ data tab in CTD. For example, the chemical bisphenol A is associated with 1965 unique diseases. A user interested in exploring how that compound may affect heart defects can apply the ‘cardiovascular disease’ filter to retrieve just the 188 diseases relevant to that filter (Figure 6).
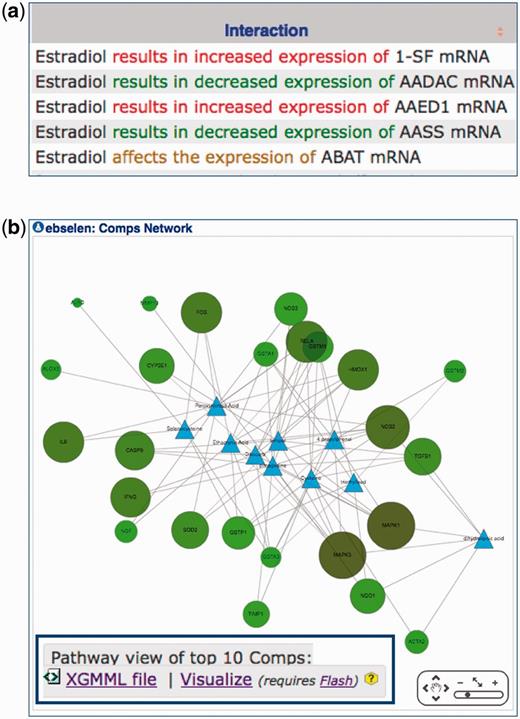
New visualization at CTD. (a) Manually curated interactions are now color-coded on web pages to rapidly discern between statements that describe an ‘increased’ interaction (red font), a ‘decreased’ interaction (green font) or one in which the directionality is not specified (brown font). (b) The ‘ChemComps’ data tab on a CTD Chemical page provides the option to visualize networks of common interacting genes for the top 10 ranked comparable chemicals using a web version of Cytoscape. The chemicals that form the ChemComps are depicted as blue triangles and the connecting genes are green nodes. The map is customizable by the user (data not shown). For larger networks, XGMML files can be downloaded and used on a desktop platform of Cytoscape (inset).
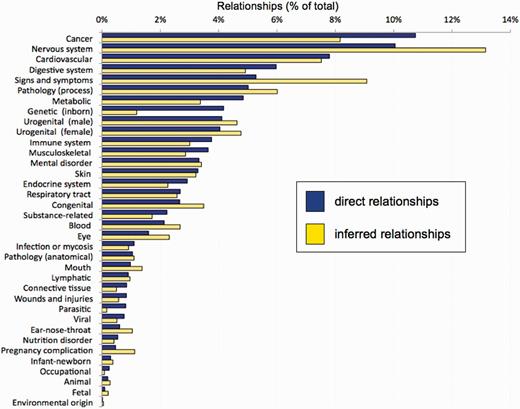
CTD disease landscape. CTD currently contains over 11 million disease relationships (both direct and inferred) for 5987 unique diseases MEDIC-Slim reduces the complexity of this information into 36 generic disease categories (y-axis) to show the overall landscape of disease information at CTD for both direct relationships (blue bars) and inferred relationships (yellow bars), as a percentage of the total number of relationships.
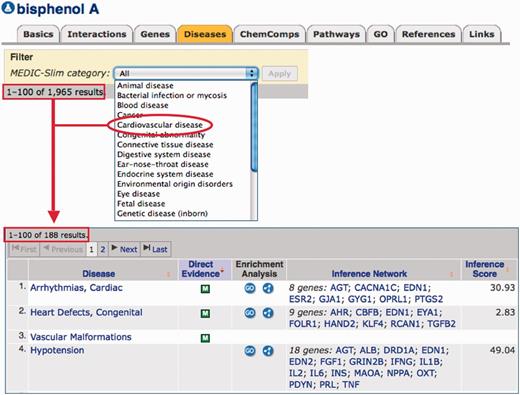
MEDIC-Slim adds functionality, reduces complexity of disease information and eases data management. CTD biocurators use the MEDIC disease vocabulary to curate disease relationships. These MEDIC diseases are now mapped to 36 MEDIC-Slim generic disease categories, which help reduce complexity and add the functionality of allowing users to easily retrieve and manage the information. Under its ‘Diseases’ data tab, the chemical bisphenol A is associated with 1965 diseases (red box). This data set can be filtered for any of the 36 MEDIC-Slim categories from a pick-list, such as ‘Cardiovascular disease’ (red circle), to retrieve only the 188 cardiovascular diseases associated with bisphenol A (red arrow).
Other CTD features
In addition to the above features, we also increased the utility of GO and pathway annotations at CTD. These annotations are directly assigned to gene symbols by external sources, and through integration with CTD data we can create novel connections to diseases with which the same genes are involved. We expanded CTD’s GO and Pathway pages to include a ‘Diseases’ data tab that list these associations. For example, as of July 2012 CTD’s Pathway page for ‘TGF-beta signaling pathway’ (http://ctdbase.org/detail.go?type=pathway&acc=KEGG%3a04350) is directly associated with 375 genes via KEGG, which in turn can be integrated via CTD to 316 diseases, including lung neoplasms, craniofacial abnormalities and sepsis. Similar integrated relationships are available for GO terms on CTD’s GO pages, allowing users to explore diseases from GO and pathway perspectives.
On CTD Gene pages, the listed synonyms are now seamlessly hyperlinked to keyword query searches to help find related genes. For example, CTD’s Gene page TP53 (http://ctdbase.org/detail.go?type=gene&acc=7157) contains the synonym ‘p53 tumor suppressor’, which, when clicked, finds other genes that use that phrase, including the mouse-specific version of the gene (called TRP53), as well as several p53-binding proteins (e.g. TP53BP1 and TP53BP2). This simple feature can alert users to other genes that may be relevant to their gene-of-interest and is particularly helpful because of CTD’s cross-species gene aggregation.
Finally, the Batch Query tool (http://ctdbase.org/tools/batchQuery.go) has been expanded to accommodate literature retrieval by now accepting PubMed identification numbers or digital object identifiers as an input type. This feature allows users to retrieve all curated data content for batches of articles.
SUMMARY AND FUTURE DIRECTIONS
CTD provides detailed information about manually curated chemical–gene interactions, chemical–disease relationships and gene–disease relationships. Integrating these core data with other data sets, CTD helps turn knowledge into discoveries by identifying novel connections between chemicals, genes, diseases, pathways and GO annotations that might not otherwise be apparent using other biological resources.
Here, we have highlighted recent major improvements to CTD, including expanded data content, greater connectivity with other databases, new analytical tools and novel visualization strategies that help users view and organize information. These features make CTD a unique scientific resource for promoting understanding of the effects of environmental chemicals on human health and for generating testable hypotheses about the mechanisms underlying the etiology of environmental diseases.
In the future, we hope to expand the depth and breadth of the manually curated core data, especially by curating recent toxicology journals triaged via a new journal-centric approach to help improve data currency at CTD (A. P. Davis et al., submitted for publication) and expanding into new knowledge spaces, including exposure science (29) and phenotypes. We also plan to increase the visualization and analysis capacity of CTD. For example, heat maps are practical visual devices that help users rapidly interpret large data sets (30). We are currently experimenting with different visualization prototypes to present MEDIC-Slim summaries for disease relationships.
FUNDING
National Institute of Environmental Health Sciences (NIEHS) grants ‘Comparative Toxicogenomics Database’ [R01-ES014065]; ‘Generation of a centralized and integrated resource for exposure data’ [R01-ES019604]. Funding for open access charge: NIEHS [R01-ES014065 and R01-ES019604].
Conflict of interest statement. None declared.
ACKNOWLEDGEMENTS
We thank Dr Heather Keating for contributions to the curation of the Pfizer-selected toxicology corpus and Roy McMorran for CTD system/database administration. The content is solely the responsibility of the authors and does not necessarily represent the official views of the National Institutes of Health.

Comments