


The GC content of human DNA varies widely across the genome, ranging from 30% to 60%, and regions of hundreds of kilobases (often referred to as isochores [Bernardi 2000]) may have relatively homogeneous base compositions. This compositional heterogeneity appears to be very widespread in eukaryotes (Nekrutenko and Li 2000) and may represent an important level of genome organization, insofar as gene density (Zouback, Clay, and Bernardi 1996 ), gene length (Duret, Mouchiroud, and Gautier 1995 ), and patterns of codon usage (Sharp et al. 1995 ), as well as the distribution of different classes of repetitive elements (Soriano, Meunier-Rotival, and Bernardi 1983 ; Duret, Mouchiroud, and Gautier 1995 ), are all correlated with GC content. Despite intensive investigation, the underlying cause(s) of the observed heterogeneity remains contested, with two major hypotheses competing: Bernardi has suggested that selection is primarily responsible for maintaining the observed patterns (Bernardi and Bernardi 1986 ; Bernardi 2000 ), a view supported by recent analysis of polymorphism in the human MHC cluster (Eyre-Walker 1999 ), whereas the balance of opinion has favored systematic mutational bias as the ultimate cause (Filipski 1987 ; Suoeka 1988; Wolfe, Sharp, and Li 1989 ; Francino and Ochman 1999 ). Ultimately, however, it is not clear why either selection for increased GC content or mutation bias should promote such marked local variation in genomic nucleotide content.
A third hypothesis, namely, that recombination may explain, or at least contribute to, the observed compositional differences (Holmquist 1992 ; Eyre-Walker 1993 ; Charlesworth 1994 ), has received less attention. The idea that recombination may be involved in determining variation in GC content arose from the observation of an association between recombination and GC-rich chromosomal regions. The clustering of chromosomal rearrangements in isochores with high GC contents was described first by Bernardi (1989) and subsequently by Holmquist (1992) . Eyre-Walker (1993) demonstrated a statistically significant positive correlation between overall chromosomal GC content and chiasmata density, which accorded both with Ikemura and Wada's (1991) finding that third-position GC content was positively correlated with chiasmata density and with Holmquist's (1992) observation that GC-rich chromosomal bands were chiasmata-dense. Although the coarse level at which the association was identified prevented determination of the causality underlying the relationship, GC-biased repair of gene conversion was suggested as the most likely explanation (Holmquist 1992 ; Eyre-Walker 1993 ). Another author, commenting on the same data, suggested instead the possible indirect effects of recombination via its impact on the efficacy of natural selection (Charlesworth 1994 ). This evolutionary explanation posited that changes in GC content promoted by natural selection would be confined to those regions of the genome with a recombination rate high enough to overcome the effects of random genetic drift (the so-called “Hill-Robertson effect”; Hill and Robertson 1966 ; Felsenstein 1974 ), thereby explaining the correlation as selectively rather than mutationally determined. There were not enough data available at the time to resolve the issue, however, so the apparent association has remained only incompletely described and largely unexplained. In particular, the scale of the association has remained unknown in the absence of data on the relationship between GC content and recombination rate within chromosomes.
With the human genome project nearly complete and detailed sequence and genetic map data readily available, we chose to revisit the reported association, both to confirm that the rough correlation described originally still holds and to determine whether, with more information, it is possible to disentangle the forces likely to contribute to the inferred relationship. To examine the association of recombination and GC content in the human genome, we used intron sequences for genes in GenBank for which genetic map positions were known, and band-specific estimates of recombination rate derived using the Genetic Location Database (LDB) (Collins et al. 1996 ; http://cedar.genetics.soton.ac.uk/public_html/ldb.html). The GC content of intronic sequences has been shown to be correlated both with the third-codon-position GC content of associated genes and with the GC content of the surrounding isochore (Clay et al. 1996 ); thus, intron sequences provide a convenient measure of chromosomal GC content. Only genes with defined map information were considered, and redundant sequences were eliminated prior to analysis with the program GPURGE from Falling Rain Genomics (http://www.fallingrain.com/publicserver/index.html). Recombination rates (in cM/Mb) were estimated from the integrated genetic and physical map data contained in the LDB. The ultimate source of the genetic map in the LDB is the CEPH family study (Daussett et al. 1990 ), although data from a large variety of additional sources (e.g., Broman et al. 1998 ) were added (see Collins et al. [1996] and on-line citations for further information). The resulting genetic map compares favorably with other published map data (e.g., Dib et al. 1996 ), while incorporating a larger number of informative meioses than any individual map. The human linkage map is unlikely to be substantively improved in the near future, as this would require collection of more extended pedigrees and massive typing, as with the 8,000+ markers typed for the CEPH panel (Broman et al. 1998 ).
Recombination rates were estimated on a per-band basis (at 0.1 band resolution), using the range of observed sex-averaged genetic distances and corresponding physical map distances for each of 721 bands or band segments. For each band interval (e.g., 11p14.1 or 11p14.2, or 11p14 if sub-band information was unavailable), we identified markers at either end of the interval for which external physical location data (based on restriction mapping evidence) were known, i.e., markers with values in the “phymb” column of the LDB map. We then took the difference in the physical map locations of these markers as the estimate of the physical distance for the band and used the corresponding estimated genetic map locations for the same markers as our estimates of the genetic distance for the interval (female and male distances were derived separately and then averaged to obtain the final sex-averaged distance). While the overall accuracy of these estimates was limited to some extent by the availability of physical data, we felt that this approach was preferable to using the composite physical locations in the LDB, which are derived assuming proportionality of cytogenetic band width and DNA content (Collins et al. 1996 ). Short-range inaccuracies in the resulting recombination estimates were ameliorated by assigning to each band the average of a three-interval window encompassing adjacent band estimates. Three-band smoothing increased the observed correlation relative to that found using the unaveraged data (r = 0.2869, as discussed below, vs. r = 0.2330 unaveraged).
For the set of 8,244 introns examined, there was a significant positive correlation between the estimated rates of recombination and GC content (r = 0.2829, P ≪ 0.001). When the GC contents of introns from the same gene were averaged, the number of observations collapsed to 1,531 genes, but virtually the same relationship was observed (r = 0.2869, P ≪ 0.001; fig. 1 ). Adjacent bands had correlated GC contents and local recombination rates, reducing the degrees of freedom. Autocorrelation analysis showed that this correlation disappeared (P > 0.05) when we took every 25th gene or a sparser sampling, yet the correlations between GC content and recombination rate persisted (mean r = 0.2986, P(bootstrap) < 0.001). In our analysis, the correlation of GC content with recombination was smaller than the correlation reported with chromosomal chiasmata density (i.e., r = 0.524; Eyre-Walker 1993 ). Uncertainty in our estimates of recombination do not appear to explain this discrepancy, as we found little difference in the observed correlation coefficients when estimates derived from averaging over larger numbers of bands (five, seven, or nine) were used (data not shown). Instead, the difference is more likely to reflect the substantively different data used in each study and, in particular, the much lower resolution of the whole chromosome-chiasmata relationship examined by Eyre-Walker (1993) .
We also examined the association between GC content and recombination rate within chromosomes. First, we removed the effect of chromosomal location from both GC content and recombination by performing ANOVAs using chromosome as the factor, and GC content and recombination rate as the dependent variables. As expected (Nekrutenko and Li 2000) , we found that chromosomes differed in their mean GC levels (P ≪ 0.001). They also differed significantly in their mean recombination rates (P ≪ 0.001). We then saved the residuals from both ANOVAs and computed their correlation. We again found a very significant correlation (r = 0.122, P ≪ 0.001) and concluded that GC content and recombination were correlated within chromosomes. This observation was confirmed by a per-chromosome analysis, in which we found that the correlation of recombination rate with GC content was significantly >0 (P < 0.05) in 9 of the 23 chromosomes (table 1 ). Data paucity may explain the failure to observe a significant positive correlation in all cases. Together, these new results confirm that GC content is higher in chromosomal regions with higher recombination rates, and they suggest that local recombination rate is an important indicator of compositional heterogeneity in the human genome.
Given the new evidence confirming a positive correlation between recombination and GC content in humans, it is relevant to ask whether these data shed any additional light on the causes of the observed association. As described above, the original correlation was previously explained as arising either directly, from mutational differences associated with biased gene conversion (Holmquist 1992 ; Eyre-Walker 1993 ), or indirectly, as a consequence of natural selection for increased GC content (Charlesworth 1994 ). If high GC content were selectively favored, due either to its higher inherent thermal stability in warm-blooded organisms (Bernardi and Bernardi 1986 ) or perhaps to its role in promoting CpG islands (Eyre-Walker 1999 ) and/or the more active chromatin structure these islands promote (Mucha et al. 2000) , we might expect to observe higher GC content and the strongest relationship to recombination in regions with the highest rates of exchange. Invoking natural selection would be consistent with the inferred role of selection on patterns of polymorphism in the human MHC cluster (Eyre-Walker 1999 ), which falls in a region of the genome with a higher than average rate of recombination (the estimated rate for chromosome band 6p21.3 is 2.13 cM/Mb). On the other hand, the impact of selection on the correlations between GC and recombination rate depends critically on the parameters of mutation rate, effective size, and local recombination rates, and plausible arguments can be made to generate the reverse pattern. Similarly, in our ignorance of the relationship between local recombination and patterns of mutation that may change GC content, stronger correlations in regions of higher recombination may also be generated by a mutational mechanism.
Either of the above explanations assumes that patterns of recombination in the human genome are ultimately responsible for determining GC content differences. It is, of course, possible that the direction of causation is the reverse, such that differences in genome composition instead determine differences in the rate of recombination. One piece of evidence in support of this idea is the association of recombination hot-spot activity with the occurrence of double-strand breaks (DSBs) in regions of open chromatin (Wahls 1998 ), which are often GC-rich (Svetlova et al. 1998 ; Mucha et al. 2000 ). Although available data suggest that DNA accessibility per se is not sufficient for hot-spot activity (Wu and Lichten 1995 ; Wahls 1998 ), the recent observation of the nonrandom association of meiotic DSBs with regions of high GC content in Saccharomyces cerevisiae (Gerton et al. 2000) suggests a direct relationship, which may prove causal. However, the extent to which we would expect such hot-spot behavior to be reflected in the long-range estimates of recombination derived here is unclear.
Of course, either class of explanation leaves unexplained why heterogeneity exists in either recombination rate or GC content to begin with. It is possible, for example, that both recombination rate and GC content are coincidentally related to an unknown third factor, such as replication timing or chromatin structure, which may ultimately be responsible for generating variation in both rates of recombination and DNA sequence composition. Relevant to this suggestion is the demonstration of a direct link between DNA replication and meiotic DSB formation in S. cerevisiae (Borde, Goldman, and Lichten 2000) . If, as Borde, Goldman, and Lichten (2000) suggest, replication of a genomic region is a necessary prerequisite for DSB occurrence, differences in replication origin distribution and firing could have an important effect on the local recombination environment. Differences in the availability of nucleotide precursors at different stages of DNA replication have also previously been suggested as an explanation for GC content variation (e.g., Wolfe, Sharp, and Li 1989 ), and at least one GC-content transition region has been shown to correspond closely to a genomic region in which replication timing switches (Tenzen et al. 1997 ; but see Eyre-Walker [1992] and Watanabe et al. [2000] for cases in which the relationship between replication timing and GC content has proved to be less clear-cut). Therefore, it is possible that the replication structure of the human genome has significant, independent effects on both variables. Without further information about the precise biological relationship of recombination to GC-rich DNA, it is impossible to rule out the influence of such an additional factor.
Our analysis clearly demonstrates that the originally suggested correlation between recombination and GC content, described previously at the chromosomal level alone, is present within chromosomes and thus on a genomewide scale at the DNA sequence level. This correlation has important implications for how we interpret and understand other genomewide correlations with GC content and suggests that GC content may serve as a useful marker of local recombination frequency, with potential applications in human genomic analysis as well as in surveys of DNA polymorphism and linkage disequilibrium (e.g., Przeworski, Hudson, and Di Rienzo2000) . Untangling of the precise causes of the association awaits fine-scale analysis of GC content boundary regions, such as the recently reported investigation of linkage disequilibrium differences across an L1-H2 isochore transition boundary on chromosome 17 (Eisenbarth et al. 2000) . Full genome sequences of other primates would also allow a much richer picture of variation in patterns of mutation across the genome, which may ultimately allow rejection of mutation as an explanation for the GC-recombination correlation.
Adam Eyre-Walker, Reviewing Editor
Present address: Department of Human Genetics, University of Chicago.
Abbreviations: cM, centimorgans; DSB, double-strand break.
Keywords: recombination GC content isochores Hill-Robertson effect mutation
Address for correspondence and reprints: Stephanie M. Fullerton, Department of Human Genetics, University of Chicago, 920 East 58th Street, CLSC 501, Chicago, Illinois 60637. mfullert@genetics.uchicago.edu.
Table 1 Correlation Between Recombination and GC Content for Individual Human Chromosomes
Table 1 Correlation Between Recombination and GC Content for Individual Human Chromosomes
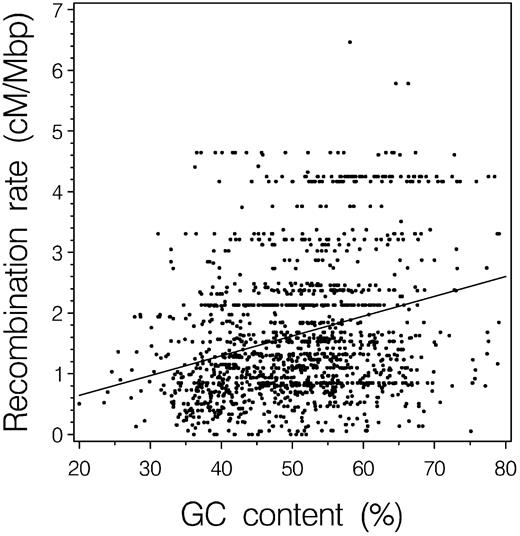
Fig. 1.—Relationship between recombination and GC content for 1,531 genes (assembled from 8,244 introns in 1,358 human GenBank accessions). GC content and local recombination rate have a significant positive correlation (r = +0.2869, P ≪ 0.001)
We thank C. Mugnier for providing collated GenAtlas (http://bisance.citi2.fr/GENATLAS) genic map data, and E. T. Dermitzakis, A. Eyre-Walker, B. P. Lazzaro, K. L. Montooth, and an anonymous reviewer for helpful comments. This work was supported in part by grants from the Pew Latin American Fellows Program (A.B.C.) and the National Heart, Lung, and Blood Institute (S.M.F. and A.G.C., grant HL58239).
literature cited
Bernardi, G., G. Bernardi.
Borde, V., A. S. Goldman, M. Lichten.
Broman, K. W., J. C. Murray, V. C. Sheffield, R. L. White, J. L. Weber.
Clay, O., S. Caccio, S. Zoubak, D. Mouchiroud, G. Bernardi.
Collins, A., J. Frezal, J. Teague, N. E. Morton.
Dausset, J., H. Cann, D. Cohen, M. Lathrop, J. M. Lalouel, R. White.
Dib, C., S. Faure, C. Fizames et al. (14 co-authors)1996. A comprehensive genetic map of the human genome based on 5,264 microsatellites. Nature. 380:152–154
Duret, L., D. Mouchiroud, C. Gautier.
Eisenbarth, I., G. Vogel, W. Krone, W. Vogel, G. Assum.
Eyre-Walker, A..
———.1993. Recombination and mammalian genome evolution. Proc. R. Soc. Lond. B Biol. Sci. 252:237–243
———.1999. Evidence of selection on silent site base composition in mammals: potential implications for the evolution of isochores and junk DNA. Genetics. 152:675–683
Filipski, J..
Gerton, J. L., J. DeRisi, R. Shroff, M. Lichten, P. O. Brown, T. D. Petes.
Hill, W. G., A. Robertson.
Holmquist, G. P..
Ikemura, T., K. Wada.
Mucha, M., K. Lisowska, A. Goc, J. Filipski.
Nekrutenko, A., W.-H. Li.
Przeworski, M., R. R. Hudson, A. Di Rienzo.
Sharp, P. M., M. Averof, A. T. Lloyd, G. Matassi, J. F. Peden.
Soriano, P., M. Meunier-Rotival, G. Bernardi.
Sueoka, N..
Svetlova, E., N. Avril-Fournout, G. Ira, P. Deschavanne, J. Filipski.
Tenzen, T.,, T. Yamagata, T. Fukagawa, K. Sugaya, A. Ando, H. Inoko, T. Gojobori, A. Fujiyama, K. Okumura, T. Ikemura.
Wahls, W. P..
Watanabe, Y., T. Tenzen, Y. Nagasaka, H. Inoko, T. Ikemura.
Wolfe, K. H., P. M. Sharp, W. H. Li.
Wu, T. C., M. Lichten.
