


Abstract
Several theories conceptualise emotions along two main dimensions: valence (a continuum from negative to positive) and arousal (a continuum that varies from low to high). These dimensions are typically treated as independent in many neuroimaging experiments, yet recent behavioural findings suggest that they are actually interdependent. This result has impact on neuroimaging design, analysis and theoretical development. We were interested in determining the extent of this interdependence both behaviourally and neuroanatomically, as well as teasing apart any activation that is specific to each dimension. While we found extensive overlap in activation for each dimension in traditional emotion areas (bilateral insulae, orbitofrontal cortex, amygdalae), we also found activation specific to each dimension with characteristic relationships between modulations of these dimensions and BOLD signal change. Increases in arousal ratings were related to increased activations predominantly in voice-sensitive cortices after variance explained by valence had been removed. In contrast, emotions of extreme valence were related to increased activations in bilateral voice-sensitive cortices, hippocampi, anterior and midcingulum and medial orbito- and superior frontal regions after variance explained by arousal had been accounted for. Our results therefore do not support a complete segregation of brain structures underpinning the processing of affective dimensions.
Introduction
Emotions pervade every aspect of our life by influencing our physiology, perceptions and behaviours. Despite the prominence and effects of emotions on even basic sensory perception we know relatively little about how emotions are represented in the brain. The two most widely cited theories suggest that emotions are either characterised as discrete entities (i.e. basic emotion categories; Panksepp, 1982; Ekman, 1992) or as independent dimensions, arousal and valence (Russell, 1980). Arousal (or intensity) is the level of autonomic activation that an event creates, and ranges from calm (or low) to excited (or high). Valence, on the other hand, is the level of pleasantness that an event generates and is defined along a continuum from negative to positive.
Basic emotion theories propose that humans are evolutionarily endowed with a limited set of emotions. Thus the behavioural and physiological expression of each emotion should be separate and arise from unique neural substrates (Ekman, 1992). While popular, this theory has had limited scientific support from animal, developmental, cross-cultural and physiological studies (Carroll et al., 1999). Neuroimaging studies using traditional univariate analyses have generally not supported the existence of consistent and specifically localised, distinct brain regions for the perception of different emotion categories (e.g. see Phan et al., 2002; Lindquist et al., 2012 for meta-analyses, and Hamann, 2012 for review). More recently, any studies confirming unique and consistent neural signatures using multivariate pattern analysis approaches have been fiercely criticised based on a misunderstanding of the statistics and of basic emotion theory (Clark-Polner et al., 2017, but see e.g., Kotz et al., 2013 for a cautious approach).
Dimensional theories, on the other hand, posit that any affective experience can be defined along at least two dimensions (Wundt, 1924). The essence of these theories is that emotions are multicomponent phenomena. Early support for a multi-dimensional organisation of the emotional space comes from psychophysiological studies. For example, startle reflex amplitudes are greatest for negatively valenced photos but decrease with positive emotional content in photos (Anders et al., 2004; Adank et al., 2012). Similarly, skin conductance amplitudes co-vary with increasing arousal ratings and electromyographic activity correlates with valence ratings (Lang et al., 1993). Additional support for a multicomponent view of emotion comes from pupillometry whereby pupil size is larger during emotionally negative and positive sounds than during the presentation of neutral sounds (Partala and Surakka, 2003).
While there is support for dimensional theories of emotion, the exact number and labelling of the dimensions as well as the relationship between these dimensions is less clear. Russell (1980) proposed that the dimensions of valence and arousal are independent and linear, i.e. how pleasant one is feeling gives no information about how calm or activated one feels. Intuitively, however, valence and arousal often go together (e.g. very negative events are also typically high in arousal), which is perhaps the reason why arousal has frequently been interpreted as reflecting the intensity of an emotion (Schlosberg, 1954; Schachter and Singer, 1962; Otten and Moskowitz, 2000). A relationship of this kind would imply valence and arousal being quadratically related and this weak but consistent relationship between the two dimensions has been confirmed in behavioural studies (for words: e.g. Bradley and Lang, 1994; Redondo et al., 2007; Vo et al., 2009; Kanske and Kotz, 2010 and pictures: e.g. Cuthbert et al., 1996; Bradley and Lang, 1999; see also Kuppens et al., 2013). Due to this relationship it is difficult to manipulate the two dimensions independently and find the neural underpinnings of each dimension separately.
Several neuroimaging studies have attempted to describe the independent neural networks underlying valence and arousal using very different designs, analyses, tasks and sensory stimuli and often without awareness of the findings in the behavioural literature. Thus many neuroimaging researchers have assumed a linear and orthogonal relationship between the two dimensions and designed their studies accordingly. While most studies report that arousal and valence are coded by distinct subsystems (Anderson et al., 2003; Anders et al., 2004; Dolcos et al., 2004; Lewis et al., 2007; Nielen et al., 2009; Colibazzi et al., 2010; Sieger et al., 2015) there is little consensus in the literature, which neural systems serve these functions. Nevertheless, lesion (Öngür and Price, 2000) and neuroimaging studies (Zuckerman et al., 1990; Viinikainen et al., 2010) tend to agree on a central role of the medial or orbital prefrontal cortex in the processing of emotional valence with both positive and negative valence coded in overlapping neural regions (Lindquist et al., 2012). Reports frequently, but not consistently, cite the amygdala as the region that underpins the processing of arousal (Anderson et al., 2003; Small et al., 2003; Lewis et al., 2007). In addition to difficulties in replicating certain regions, another recent complication is that BOLD signal may not actually vary linearly with linear modulations of the valence spectrum (Viinikainen et al., 2010, 2012).
We were interested in localising the overlap between valence and arousal as well as examining the effects specific to each affective dimension on neural activity when processing non-linguistic, vocal expressions. To this end we created vocal morphs between neutral and various emotional expressions to broadly sample the valence and arousal space. We then computed two parametric models whereby each of the regressors of interest (i.e. ratings of valence and arousal) was orthogonalised with respect to the other in the design matrix. These two models allowed us to examine any overlap between valence and arousal activations as well as any areas specific to each dimension. We predicted quadratic relationships between valence ratings and fMRI signal in bilateral orbitofrontal cortex after variance accounted for by arousal ratings had been removed. In contrast, we expected increased subcortical activation with increased arousal ratings. Given previous behavioural studies, we predicted some overlap in the neural networks dealing with the processing of arousal and valence.
Materials and methods
Participants
Twenty-six healthy volunteers from the under- and postgraduate community of the University of Glasgow took part (12 females, mean age = 23.73, range = 18–36 years, s.d. = 5.61). All participants reported normal hearing and were reimbursed £12 for their time. Informed consent was obtained from all individuals and the study protocol was approved by the local ethics committee.
Experimental stimuli
Recordings were taken from the Montreal Affective Voices (Belin et al., 2008) in which actors were instructed to produce emotional interjections using the vowel/a/. We used neutral expressions as well as expressions of fear, anger and pleasure from two identities (one female) to avoid identity-specific effects of emotion expression. These two identities had the highest recognition rates for all four expressions. Anger-fear, pleasure-fear, pleasure-anger continua as well as continua between each emotional expression and a neutral/a/were created separately for each identity, in nine steps that corresponded to −10/110%, 5/95%, 20/80%, 35/65%, 50/50%, 65/35%, 80/20%, 95/5% and 110/−10%, e.g. pleasure/fear. −10/110% and 110/−10% were caricatured versions of the morphed expressions. We therefore had six continua and a total of 54 morphs per male and female identity. The duration of the vocalisations within each continuum was kept constant and ranged between 0.6 and 1.0 s across different continua (the varied stimulus durations are incorporated in our models). We used STRAIGHT (Kawahara and Matsui, 2003); see also http://www.wakayama-u.ac.jp/∼kawahara/STRAIGHTadv/index_e.html for more information) for stimulus generation and Psychtoolbox-3 (Brainard, 1997; Kleiner et al., 2007) for stimulus presentation and response recording for the fMRI and validation study. Toolboxes and experimental scripts were run on MatlabR2007b (Mathworks, Inc).
STRAIGHT performs an instantaneous pitch-adaptive spectral smoothing of each stimulus for separation of contributions to the voice signal arising from the glottal source (including f0) vs supralaryngeal filtering (distribution of spectral peaks, including the first formant frequency, F1). Voice stimuli were decomposed by STRAIGHT into five parameters: f0 (the perceived pitch of the voice), frequency, duration, spectrotemporal density and aperiodicity. Each parameter can be manipulated independently. For each voice we manually identified one time landmark with three frequency landmarks (corresponding to the first three formants) at the onset of phonation and the same number of landmarks at the offset of phonation. Morphed stimuli were then generated by re-synthesis based on the interpolation (linear for time; logarithmic for F0, frequency, and amplitude) of these time-frequency landmark templates (see also Schweinberger et al. (2014) for a recent discussion of the voice morphing technique). Stimuli were normalised in energy (root mean square) before and after morphing. Acoustic analyses to illustrate the validity of the morphing technique with emotional sounds are published elsewhere (Bestelmeyer et al., 2010).
Sixty-five undergraduates (45 female) at Bangor University rated all morphs on valence and arousal in return for course credit on an analogue scale from 0 to 1 (from ‘extremely negative’/‘extremely low in arousal’ to ‘extremely positive’/‘extremely high in arousal’). Stimuli were presented randomly (but blocked for identity). Half of our participants were asked to rate the morphs on valence first and then arousal, while the other half conducted the blocks in reverse order. For illustration purposes we ‘min–max’ normalised and averaged the data across the two identities for each morph type and rating task (Figure 1). For the parametric modulation analyses we computed ‘min–max’ normalised valence and arousal regressors separately for each morph identity.
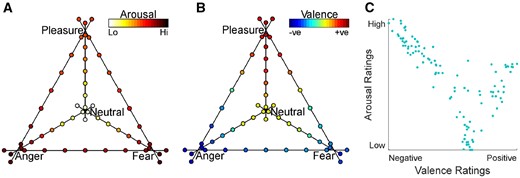
Behavioural results. Behavioural ratings of (A) arousal and (B) valence of the stimulus set. (C) Scatterplot illustrating the quadratic relationship between valence and arousal ratings.
fMRI paradigm
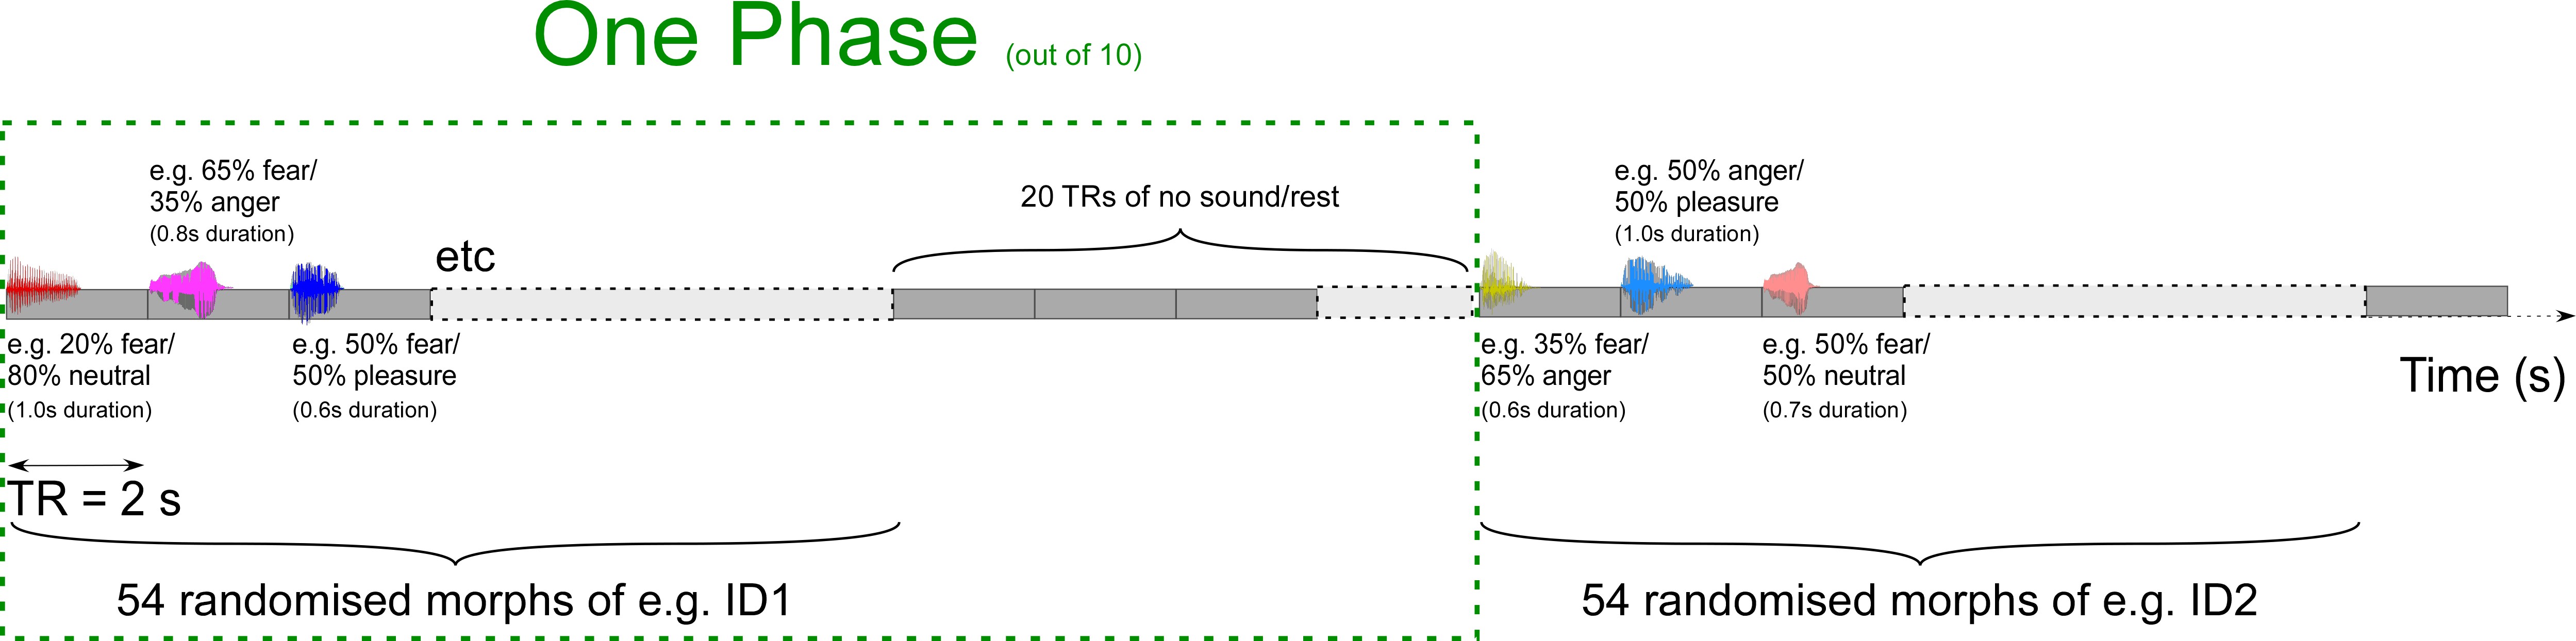
The experimental run consisted of a fast event-related design and was always acquired first. It involved five phases during which we presented 54 morphs of the female identity and five phases during which we presented 54 morphs of the male identity. During each of these phases a vocal morph was presented every 2 s at the beginning of each TR. The order of the phases and the order of morphs within the phases was randomised using Matlab’s rand function. Each phase of 54 morphs was separated by 20 TRs of silences (40 s) before beginning the next phase (see supplementary online figure for an illustration of the paradigm). Participants were asked to perform a three-alternative forced choice task, in which each affective morph had to be categorised as either anger, fear or pleasure by means of an MRI compatible response box (fORP; Current Designs, Inc.). Participants were asked to react as fast as possible and to keep their eyes closed for the duration of all scans.
The experimental run was followed by a voice localiser scan. This block design uses vocal and environmental sounds to reliably identify the temporal voice areas (TVAs) using the vocal vs non-vocal contrast (for details see Belin et al., 2000). All sounds were presented binaurally using the electrostatic NNL headphone system (NordicNeuroLab, Inc.) at an intensity of 80 dB SPL(C). Lastly, we collected a detailed anatomical scan.
Image acquisition
All scans were acquired in a 3.0 Tesla Siemens Tim Trio scanner using a 32-channel head coil. A whole brain T1-weighted anatomical scan was performed using fast gradient echo sequence known as T1 ‘Magnetization Prepared Rapid Gradient Echo’ (MPRAGE) consisting of 192 axial slices of 1 mm thickness with an inplane resolution of 1×1×1 (Field of view (FOV) = 256) and a matrix of 256×256 performed at the end of the experimental session. Two T2*-weighted functional scans were acquired using an interleaved ascending sequence consisting of 32 slices of 3 mm thickness (0.3 mm gap) with an inplane resolution of 3×3×3 (FOV = 210), an acquisition matrix of 70×70 and a flip angle of 77°. The experimental scan (TR = 2 s, TE = 30 ms) consisted of 740 volumes while the voice localiser scan consisted of 310 volumes (otherwise same scanning parameters as the experimental scan). All MRI data were analysed using SPM12 (Wellcome Department of Cognitive Neurology, University College London, http://www.fil.ion.ucl.ac.uk/spm/). Pre-processing of the data consisted of AC-PC alignment of the anatomical images (and application of the re-orientation matrix to all functional images acquired in the same session). Functional scans were corrected for head motion (trilinear interpolation) by aligning all scans to the first scan of the last run and a mean image was created. The anatomical scan was co-registered to the mean image. Functional (3 mm isotropic voxels) and anatomical (1 mm isotropic voxels) data were transformed to Montreal Neurological Institute (MNI) space after segmentation of the anatomical scan. Normalised data were spatially smoothed by applying a Gaussian kernel of 8 mm full width at half maximum (FWHM).
Image analysis
We used parametric modulations to analyse the data (Büchel et al., 1998) with two parametric modulators loading on the sound onset regressor. The reported results are based on whole-brain analyses rather than a region of interest approach. Based on previous work we computed linear and quadratic expansions of each regressor (Lewis et al., 2007; Viinikainen et al., 2010, 2012). Note that in SPM each parametric modulator is orthogonalised with respect to the previous ones to only account for variance not explained by previous regressors. We computed two models. For the first model we entered arousal as first parametric modulator and valence as the second. This allowed us to examine the linear and quadratic relationships between BOLD signal and valence after variance explained by arousal had been removed. The second model consisted of the reverse order of parametric modulators and allowed us to examine linear and quadratic relationships between BOLD and arousal after variance explained by valence had been removed. Since our two regressors of interest are not naturally orthogonal, both regressors will share variance. We therefore also examined the activations of the first parametric modulators of each model and illustrate the overlap in Figure 2.
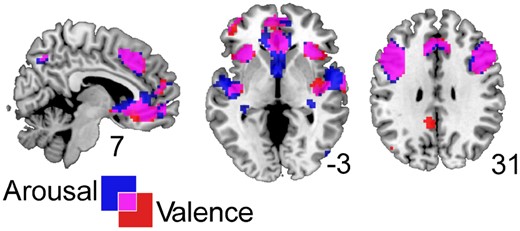
Overlapping activation maps for significant correlations between BOLD signal and arousal (blue) or valence (red) ratings (but without first removing variance explained by valence and arousal, respectively).
In addition to the two parametric modulators, both models contained the six movement parameters as the last six regressors. At the second level of analysis we computed an F-test across linear and quadratic contrasts in a full factorial design for arousal (in the valence then arousal model; model 1) and for valence (in the arousal then valence model; model 2).
To illustrate the parameter estimates in Figure 3, we used SPM12’s built-in functions to extract the beta estimates at the peak maxima within a sphere of 6 mm. Behavioural responses did not average to discrete steps but rather, resulted in a range of numbers between 0 and 1. We therefore had to group the averaged behavioural responses into five bins of 20%. Results are illustrated on an average anatomical scan using MRIcron (Rorden et al., 2007). Anatomical cluster location was assessed with xjview (8.1; http://www.alivelearn.net/xjview) and cross checked with Duvernoy’s brain atlas (Duvernoy, 1999) to ensure accuracy. Activations are illustrated and reported in text and table at a threshold of P < 0.001; extent threshold (k) > 50 with FWE-correction at the cluster level.
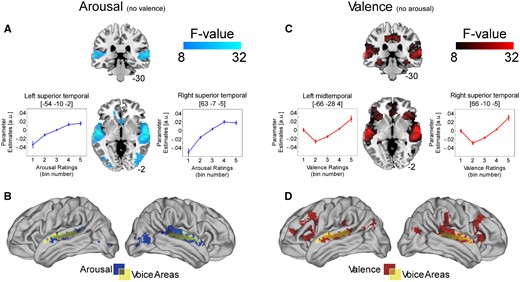
Activation maps of significant correlations between BOLD signal and (A) arousal after variance explained by valence has been removed. Significant relationships are evident in bilateral superior temporal gyri and right mid-occipital cortex. Overlap between this activation (blue) and that of the voice localiser (yellow) is shown in (B). Activation maps of significant correlations between BOLD signal and (C) valence after variance explained by arousal has been removed. Significant relationships are evident in bilateral superior temporal gyri, inferior frontal gyri, hippocampi, medial orbitofrontal, superior frontal gyri and midcingulum. Overlap between this activation (red) and that of the voice localiser (yellow) is shown in (D). Activations in (A) and (C) are illustrated on a T1-weighted average structural template. The line graphs illustrate BOLD signal change in response to the behavioural ratings (from 0 to 1; low to high arousal and negative to positive valence, respectively, in five bins of 0.2).
Results
Behavioural
Results of the behavioural data from independent raters is summarised in Figure 1. Valence and arousal ratings were averaged separately as a function of morph step and continuum type. Figure 1A illustrates the averaged arousal ratings for each morph step and continuum type. Figure 1B shows the averaged valence ratings. Using non-linear regression we found a significant quadratic relationship between valence and arousal ratings (R2 = 0.601; F(2, 107) = 79.193; P <0.0001; Figure 1C).
Neuroimaging
We used parametric modulation analyses to investigate areas that respond to a systematic change in valence or arousal with and without removing variance explained by the other dimension. We found significant positive correlations between arousal ratings and BOLD signal and between valence ratings and BOLD signal without first removing variance explained by the other dimension (see Table 1 for significant clusters for each dimension and BOLD signal). We then examined the shared variance or overlap (pink) between arousal (blue) and valence (red; Figure 2). Substantial overlap was apparent for bilateral insulae, superior temporal gyri (STG), bilateral amygdalae, caudate, precuneus, medial orbito- and superior frontal cortex as well as inferior and mid frontal cortex.
Areas revealing significant modulations with arousal and valence (before removing variance by the other dimension)
| Modulator | Anatomical definition | Peak voxel coordinates | F-value | Cluster size | ||
|---|---|---|---|---|---|---|
| x | y | Z | ||||
| AROUSAL | Left inferior frontal operculum | −45 | 20 | 31 | 30.41 | 940 |
| Left precentral | −42 | 8 | 34 | 27.91 | ||
| Left inferior frontal (pars triangularis) | −39 | 32 | 19 | 27.40 | ||
| Right inferior frontal (pars triangularis) | 45 | 23 | 28 | 28.65 | 556 | |
| Right inferior frontal operculum | 45 | 8 | 28 | 17.21 | ||
| Right midfrontal | 42 | 38 | 16 | 13.51 | ||
| Left precuneus | −6 | −64 | 46 | 23.88 | 339 | |
| Left inferior parietal | −30 | −49 | 40 | 22.07 | ||
| Left inferior parietal | −36 | −55 | 46 | 21.31 | ||
| Right amygdala | 24 | −4 | −17 | 22.55 | 623 | |
| Right superior temporal | 48 | −1 | −11 | 20.71 | ||
| Right superior temporal | 51 | −10 | 1 | 15.46 | ||
| Right insula | 30 | 26 | −2 | 20.56 | 120 | |
| Left insula | −30 | 20 | 1 | 20.44 | 161 | |
| Left inferior frontal (pars triangularis) | −48 | 17 | 7 | 11.36 | ||
| Left superior temporal | −48 | −16 | −2 | 19.76 | 395 | |
| Left superior temporal | −42 | −13 | −8 | 17.21 | ||
| Left superior temporal | −54 | −7 | 4 | 15.34 | ||
| Right caudate | 6 | 11 | −8 | 19.39 | 1082 | |
| Left medial orbitofrontal | 0 | 38 | −17 | 17.75 | ||
| Left medial orbitofrontal | −9 | 53 | −11 | 17.44 | ||
| Right inferior parietal | 36 | −49 | 40 | 13.62 | 76 | |
| Right angular | 33 | −58 | 43 | 12.37 | ||
| VALENCE | Left supplementary motor area/medial frontal | −6 | 20 | 46 | 51.43 | 1775 |
| Right supplementary motor area | 6 | 20 | 46 | 36.45 | ||
| Right insula | 30 | 23 | 1 | 28.46 | ||
| Left inferior frontal (pars opercularis) | −42 | 20 | 31 | 35.37 | 1533 | |
| Left precentral | −39 | 8 | 31 | 30.34 | ||
| Left insula | −30 | 20 | 1 | 30.32 | ||
| Left medial frontal | −6 | 50 | 16 | 29.50 | 2322 | |
| Left anterior cingulum | 0 | 29 | −5 | 28.41 | ||
| Left medial orbitofrontal | −6 | 35 | −14 | 25.33 | ||
| Left midtemporal | −45 | −64 | 19 | 26.50 | 237 | |
| Left midtemporal | −57 | −61 | 16 | 14.68 | ||
| Left midtemporal | −30 | −52 | 19 | 10.07 | ||
| Left inferior parietal | −33 | −49 | 40 | 26.19 | 272 | |
| Left superior temporal | −51 | −34 | 16 | 24.21 | 618 | |
| Left insula | −39 | −13 | −2 | 18.91 | ||
| Left midtemporal | −60 | −7 | −14 | 18.77 | ||
| Left precuneus | −9 | −64 | 46 | 22.00 | 68 | |
| Right precuneus | 9 | −64 | 46 | 14.95 | ||
| Right inferior parietal | 36 | −46 | 40 | 17.41 | 111 | |
| Right angular | 33 | −58 | 43 | 11.64 | ||
| Left posterior cingulate | −6 | −49 | 28 | 16.70 | 302 | |
| Left midcingulum | −12 | −31 | 40 | 15.22 | ||
| Left midcingulum | −15 | −25 | 46 | 14.59 | ||
| Right midcingulum | 15 | −22 | 34 | 12.25 | 57 | |
| Right midcingulum | 15 | −34 | 49 | 9.99 | ||
We were ultimately interested in which regions are specific to each emotional dimension. We therefore examined correlations between arousal after variance explained by valence had been accounted for (Figure 3A and B; model 1) and vice versa (Figure 3C and D; model 2). The first model, Figure 3A and B, revealed a correlation between BOLD and arousal ratings in bilateral superior temporal cortex with the cluster extending to bilateral temporal pole (right peak cluster: F(2, 50) = 50.07, k = 1019, MNI coordinates: 63 −7 −5; left peak cluster: F(2, 50) = 38.11, k = 803, MNI coordinates: −54 −10 −2), right midtemporal cortex with the cluster extending into mid and superior occipital cortex (peak cluster: F(2, 50) = 27.27, k = 423, MNI coordinates: 48 −73 1), left superior and midoccipital cortex (peak cluster in left: F(2, 50) = 13.29, k = 146, MNI coordinates: −9 −97 7) and bilateral caudate (peak cluster in left: F(2, 50) = 16.10, k = 142, MNI coordinates: −12 26 10). The line graphs indicate that BOLD signal increased with sounds that were rated as higher in arousal. Figure 3B reveals the overlap between this model and the TVA.
The second model, Figure 3C and D, revealed a correlation between BOLD and valence ratings in right superior temporal cortex (peak cluster: F(2, 50) = 55.00, k = 2242, MNI coordinates: 66 −10 −5), left mid and superior temporal cortex (peak cluster in left: F(2, 50) = 43.30, k = 2246, MNI coordinates: −66 −28 4), bilateral hippocampi and parahippocampi (left peak cluster: F(2, 50) = 28.06, k = 192, MNI coordinates: −33 −34 −11; right peak cluster: F(2, 50) = 18.72, k = 120, MNI coordinates: 33 −34 −14), bilateral midcingulum (peak cluster in right: F(2, 50) = 25.79, k = 778, MNI coordinates: 12 −22 40), bilateral superior midfrontal cortex (peak cluster in left: F(2, 50) = 22.01, k = 309, MNI coordinates: −6 23 46), bilateral anterior cingulum (peak cluster in left: F(2, 50) = 21.12, k = 453, MNI coordinates: 0 29 −5), bilateral cerebellum (left: F(2, 50) = 15.69, k = 49, MNI coordinates: −9 −79 −29; right: F(2, 50) = 17.37, k = 71, MNI coordinates: 9 −76 −23), left midoccipital (F(2, 50) = 15.70, k = 103, MNI coordinates: −42 −76 34), right midtemporal and midoccipital cortex (peak cluster: F(2, 50) = 14.88, k = 209, MNI coordinates: 39 −67 13) and left inferior parietal cortex (F(2, 50) = 17.60, k = 104, MNI coordinates: −33 −49 40). The line graphs indicate a positive quadratic relationship between BOLD and sounds from the extreme ends of the valence continuum. Figure 3D reveals the overlap between this model and the TVA.
Discussion
The aim of the current study was to localise and quantify the overlap between the dimensions of affect as well as examine any effects specific to each affective dimension on neural activity during the processing of vocal expressions. Whole-brain analyses revealed significant overlap between activations for arousal and valence in traditional emotion areas (bilateral insulae, orbitofrontal cortex and amygdalae) as well as modality-specific, auditory areas. To investigate the specific relationship between BOLD signal and each affective dimension, we computed two parametric models, in which we orthogonalised each dimension with respect to the other. Increased arousal ratings correlated with increased BOLD signal in bilateral temporal voice areas (superior temporal sulcus/gyrus; STS/STG) and mid-occipital gyri after variance explained by valence had been accounted for (Figure 3A). In contrast, BOLD signal was increased with extremely positive or negative valence ratings compared to more neutral valence ratings in bilateral prefrontal cortex, mid- and anterior cingulum, hippocampi and parahippocampi but also bilateral temporal voice areas (STS/STG; Figure 3C). Our results suggest that the representations of valence and arousal are in part underpinned by sensory specific brain areas, the temporal voice areas, but also by brain areas (e.g. orbitofrontal cortex), which have been reported by various other studies of different modalities (Anderson et al., 2003; Chikazoe et al., 2014; Skerry and Saxe, 2015). In contrast to previous literature, our findings are not in line with the notion that valence and arousal are independent or orthogonal dimensions of emotion as previously thought and are not subserved by entirely distinct brain regions (Anderson et al., 2003; Small et al., 2003; Anders et al., 2004; Dolcos et al., 2004; Lewis et al., 2007; Nielen et al., 2009; Colibazzi et al., 2010).
Pernet et al. (2015) recently reported in a sample of over 200 participants that the temporal voice areas (TVA) consist of three bilateral voice-sensitive clusters. These clusters are located along bilateral posterior, mid and anterior STG, respectively. While the activations to orthogonalised acoustic contributions to valence and arousal overlapped with much of the TVA (see also Ethofer et al., 2012), it is noteworthy that acoustic contributions to arousal were processed more anteriorly than the acoustic contributions to valence, which were processed more posteriorly (as indicated by each respective peak cluster). Our study is in line with previous research highlighting that the TVA is in charge of processing the underlying acoustic cues to emotion (Ethofer et al., 2006; Wiethoff et al., 2008; Frühholz et al., 2012; Bestelmeyer et al., 2014) and additionally alludes to an interesting dissociation in functionality between anterior and more posterior portions of the TVA.
Traditionally, fMRI studies have compared BOLD signal in response to high vs low valenced stimuli and frequently reported separate brain regions for each contrast (Dolcos et al., 2004; Nielen et al., 2009) in predefined regions of interest. These findings have led to speculations that valence may consist of two independent continua, one for neutral to negative and one for neutral to positive valence. With newer, parametric statistical methods it has become apparent that the valence dimension is unlikely to consist of two independent continua. There is now more and more support for the notion that brain regions respond to modulations in valence not linearly but quadratically (Lewis et al., 2009; Viinikainen et al., 2012), i.e. brain activity increases from neutral to most extreme emotion irrespective of whether the emotion is positive or negative. Our results are in line with this notion. Arousal, on the other hand, is still thought of as a linear continuum with activations increasing with increased arousal ratings. Our data show that activations in bilateral STS/STG increase largely linearly up to a plateau.
Using single-cell recordings Sieger et al. (2015) have recently shown that neurons within the same nucleus can independently code valence or arousal. In other words, overlap of activations to valence and arousal in functional neuroimaging studies does not exclude the possibility that neurons within this region are dedicated for the processing of one specific affective dimension. Thus, while the current study does not support the notion of distinct brain regions underpinning each affective dimension, it is still possible that our overlapping activations in these frontal areas contain specialised neurons for affective dimensions.
Bestelmeyer et al. (2014) have recently shown empirical support for Schirmer and Kotz’s (2006) notion of a multi-step process in the perception of auditory emotion. This fMRI study demonstrated that the temporal voice areas and amygdala likely deal with the acoustic features of the vocal emotion while the cognitive representation of emotion is underpinned by bilateral insulae, precuneus, superior frontal gyri and midcingulum. It is likely that auditory cues to valence and arousal are processed in bilateral temporal voice areas while cognitive representations of the positivity and intensity of the emotion are processed in dimension-specific, possibly supra-modal areas. Due to differences in experimental designs, stimulus material and analyses in the past it remains unclear, which of these regions, if any, deal with affective dimensions at a supra-modal level.
Our study is the first to quantify the overlap in activation for each affective dimension as well as demonstrate activation specific to each dimension. Yet many open questions remain. Naturally, and as in our data set, arousal for negative expressions is typically higher than for positive ones (Ito et al., 1998; Ito and Cacioppo, 2005). It is unclear whether the response of the TVA would be modulated further with stimuli perfectly matched for arousal. Furthermore, while our study used a large number of carefully controlled stimuli the addition of null events and jittering of the stimulus onsets could have further optimised our design.
Conclusion
Our results are not in line with the theory that valence and arousal are strictly independent dimensions of emotion (Russell, 1980). We found substantial correlations between behavioural ratings of valence and arousal as well as anatomical overlap of regions, which code modulations in valence and arousal, particularly in bilateral insulae, orbitofrontal cortex and amygdalae. We also noted significant correlations between brain activity and the behavioural ratings that were specific to each dimension. We found that increased arousal ratings correlated positively with brain activity predominantly in regions, which code acoustic properties of the sound, i.e. the temporal voice areas. In addition, we found that extreme valence ratings activated a more widespread network again involving the bilateral temporal voice areas but also bilateral hippocampi, anterior and midcingulum, medial orbito- and superior frontal regions.
Supplementary data
Supplementary data are available at SCAN online.
Funding
This work was supported by the Economic and Social Research Council/Medical Research Council grant (RES-060-25-0010). The authors declare no competing financial interests.
Conflict of interest. None declared.
References
