Article Text

Abstract
Background Helicopter emergency medical services are an important part of many healthcare systems. Norway has a nationwide physician staffed air ambulance service with 12 bases servicing a country with large geographical variations in population density. The aim of the study was to estimate optimal air ambulance base locations.
Methods We used high resolution population data for Norway from 2015, dividing Norway into >300 000 1 km×1 km cells. Inhabited cells had a median (5–95 percentile) of 13 (1–391) inhabitants. Optimal helicopter base locations were estimated using the maximal covering location problem facility location optimisation model, exploring the number of bases needed to cover various fractions of the population for time thresholds 30 and 45 min, both in green field scenarios and conditioning on the current base structure. We reanalysed on municipality level data to explore the potential information loss using coarser population data.
Results For a 45 min threshold, 90% of the population could be covered using four bases, and 100% using nine bases. Given the existing bases, the calculations imply the need for two more bases to achieve full coverage. Decreasing the threshold to 30 min approximately doubles the number of bases needed. Results using municipality level data were remarkably similar to those using fine grid information.
Conclusions The whole population could be reached in 45 min or less using nine optimally placed bases. The current base structure could be improved by moving or adding one or two select bases. Municipality level data appears sufficient for proper analysis.
This is an Open Access article distributed in accordance with the Creative Commons Attribution Non Commercial (CC BY-NC 4.0) license, which permits others to distribute, remix, adapt, build upon this work non-commercially, and license their derivative works on different terms, provided the original work is properly cited and the use is non-commercial. See: http://creativecommons.org/licenses/by-nc/4.0/
Statistics from Altmetric.com
Introduction
Helicopter emergency medical services (HEMS) are common in many healthcare systems in the developed world.1 ,2 HEMS have several theoretical advantages, such as bringing advanced medical care and treatment options and decision-making competence to the scene, shortening transport time and providing access to remote areas.3–5 The effect of HEMS is still explored, with empirical studies showing evidence both in favour of the service6–8 and not,6 ,9 ,10 but HEMS are still expanding throughout the world.
Norway is a long-stretched country with a mixed urban and rural population. Despite large geographical distances and substantial uninhabited areas, the government requirements state that 90% of the population should be reached by a physician staffed ambulance service within 45 min.11 HEMS is considered essential in order to achieve the desired equality in healthcare, and the objective of the Norwegian air ambulance service, a nationwide anaesthesiologist staffed air ambulance service, is to provide advanced emergency medicine to critically ill or severely injured patients.
In order to ensure optimal coverage, and homogeneity in healthcare throughout, the location of the air ambulance bases are central. The question of how to localise HEMS bases in a given population has, however, rarely been approached by the scientific community.12 Currently there are 12 helicopter ambulance bases in Norway providing HEMS. The bases have been established through historical local engagement from the late 1970s,13 gradually spanning an increasing part of the Norwegian territory.
For any emergency medical service (EMS) it is important to locate vehicles in such a way that incidents can be served as quickly as possible. Various mathematical models allocate bases and vehicles in such a way that a certain percentage of demand being served within a prespecified target response time is maximised. One such model is the maximal covering location problem (MCLP).14 This mathematical model maximises the population covered within a desired service distance from a facility by allocating a fixed number of facilities. Conversely, the model also allows for the determination of the least number of bases needed in order to guarantee a certain coverage of the population. The MCLP model has found a wide range of applications,15 recently also within the health sciences, such as the determination of the best configuration of a network of medical drones in order to minimise travel time to victims of out-of-hospital cardiac arrest.16
In this study, we explore the mathematically optimal locations of helicopter ambulance bases using the MCLP model. Using fine detail population density data for the whole of Norway, we fit MCLP models to explore optimal base structures given various external constraints. We performed both green field analyses, assuming clean slates, and optimisation conditioned on the current bases, in order to explore whether improvements to the existing base structure could be achieved by moving or adding a few select bases.
Material and methods
Data material
Mainland Norway covers 323 780 km2 at the far North of Europe, stretching 1790 km from north to south. The country has a mixed rural and urban population with county population density ranging from 1129.5 inh/km2 in Oslo to 1.5 inh/km2 in Finnmark. In the east the country borders to Sweden, Finland and Russia, while the west is one, long coastline.
The Norwegian national annual trauma mortality is 28.7 per 100 000 per year, with transport-related and self-harm mortality rates being 8.6 and 11.3 per 100 000 per year, respectively.17 The transport injury mortality rate increases with increasing rurality, and rural areas are at a higher risk of deaths following traumatic injuries and have higher proportions of prehospital deaths and deaths following transport-related injuries.17 Conversely, in the most central municipalities, self-harm causes more than twice the proportion of deaths compared with transport injuries.17
On 1 January 2015, the population of Norway was 5.2 million.18 Official population statistics exist on a fine grid throughout with cells of dimension 1 km×1 km. Data are freely available from Statistics Norway.18 This gives fine detail information on the population density of Norway. In 2015, only 55 213 (10.3%) of the grid cells were inhabited. The number of inhabitants in the inhabited cells was heavily skewed, with a median (5–95 percentile) of 13 (1–391).
Official statistics are often collected and reported on municipality level. In order to explore whether this coarser information will lead to estimation bias or otherwise essential loss of precision, we also performed the analyses on municipality level data. In 2015, Norway consisted of 428 municipalities. For each municipality, there is a population weighted centroid representing the population centre of the municipality. The 428 municipalities had a median (IQR) of 4697 (2180–10 654) inhabitants.
While air ambulances in Norway are allowed to use a 15 min preflight preparation time, the mean of HEMS in Norway is 5.5 min.19 This latter number was used in the calculations. Helicopter ground speed depends on wind direction and strength. In the mathematical models we used 220 km/hour, as an overall mean number, taking into account the different helicopter types and the various helicopter speeds used during each mission (take off, cruise phase, landing phase including identification of suitable landing sites). For an air ambulance helicopter flying at this speed, a 1 km×1 km grid cell is thus crossed in 15–20 s.
All Norwegian HEMS are at call at all times, and in 2014 they completed 7278 missions, 2743 requests were rejected and 1796 missions were aborted before reaching the patient.20
Methods
Optimal base locations were determined by approaching the question as an MCLP.14 The MCLP model maximises the number of demand locations covered by at least one ambulance, weighted by the number of inhabitants in each demand location. That is, it maximises the population covered within a desired service distance, or time, by optimal allocation of a predefined fixed number of facilities. Conversely, the model can be used to determine the least number of bases needed in order to guarantee a certain coverage of the population.
The MCLP model places one ambulance at each base location, assuming that each ambulance is always available. While in practice this might be overly optimistic, the model was chosen as it represents a best-case scenario: if a grid cell cannot be reached within the given time threshold in the MCLP model, it never can. The number and location of bases is the minimum needed in order to achieve a given population coverage within a given time threshold.
In the fine grid analysis, we used the 55 213 inhabited grid cells as demand locations. The model allows for using base locations other than the demand locations. In order to keep computational times manageable we used a coarser 10 km×10 km grid, a total of 4218 grid cells, for the possible base locations. We also included zero population grid cells as possible base locations: an uninhabited location surrounded by several densely populated areas can still make for a potentially good base location. The travel times, including a 5.5 min fixed preflight preparation time, from all potential base locations to all demand locations was then calculated, and optimal base locations determined.
To explore the practical consequences of various target times, we calculated the number of bases needed to cover various percentages of the population for threshold times 30 and 45 min. We first computed the optimal base locations assuming no current bases existed, so-called green field analysis. This yields the optimal base locations for MCLP using the chosen set of parameter values. Such an analysis is, however, rarely practically feasible, as this would imply tearing down all existing bases and start building anew. We thus also performed conditional optimisation, that is, given the existing 12 bases in Norway, what would be the possible additional gain of moving or adding one or two bases, still optimised for performance.
In order to explore potential information loss, all of the above analyses were also performed on the coarser municipality level data.
The models are implemented in Java and solved with IBM ILOG CPLEX Optimization Studio (CPLEX 12.6.2).
Results
The population density map of Norway for the 1 km×1 km grid and the municipality detail information are shown in figure 1. The location of the 12 current bases is superimposed.
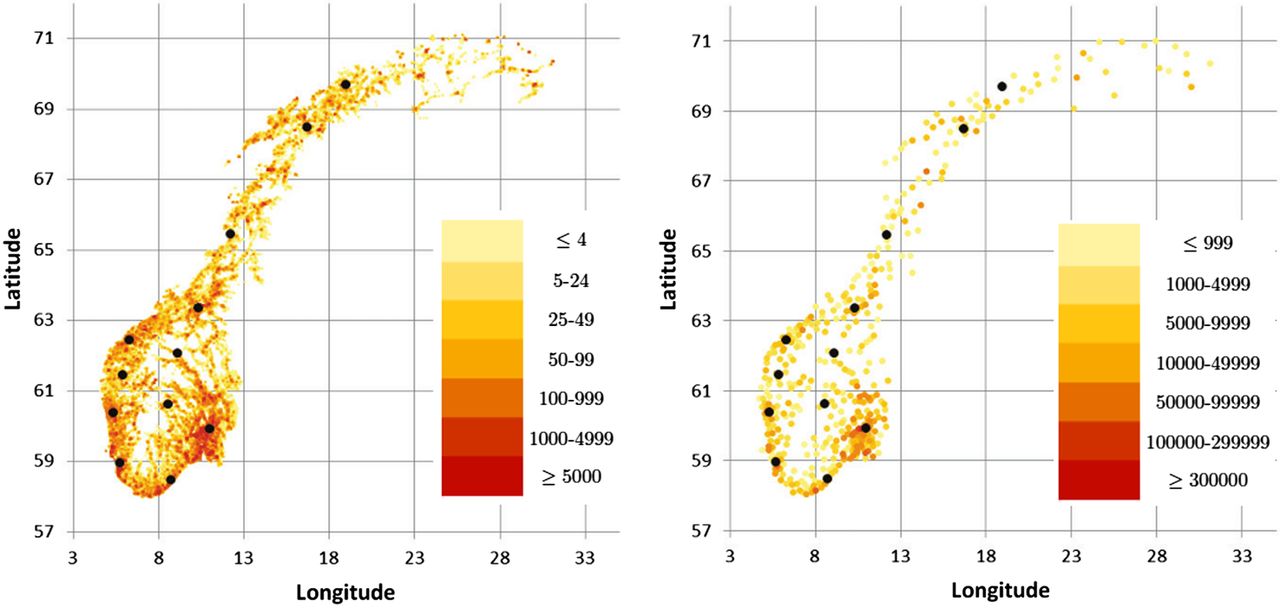
Population density map of Norway. Colour dots represent 1 km×1 km grid cells (left) and centroid location of the 428 municipalities (right). The 12 existing air ambulance bases superimposed.
Optimal solutions for fine grid data
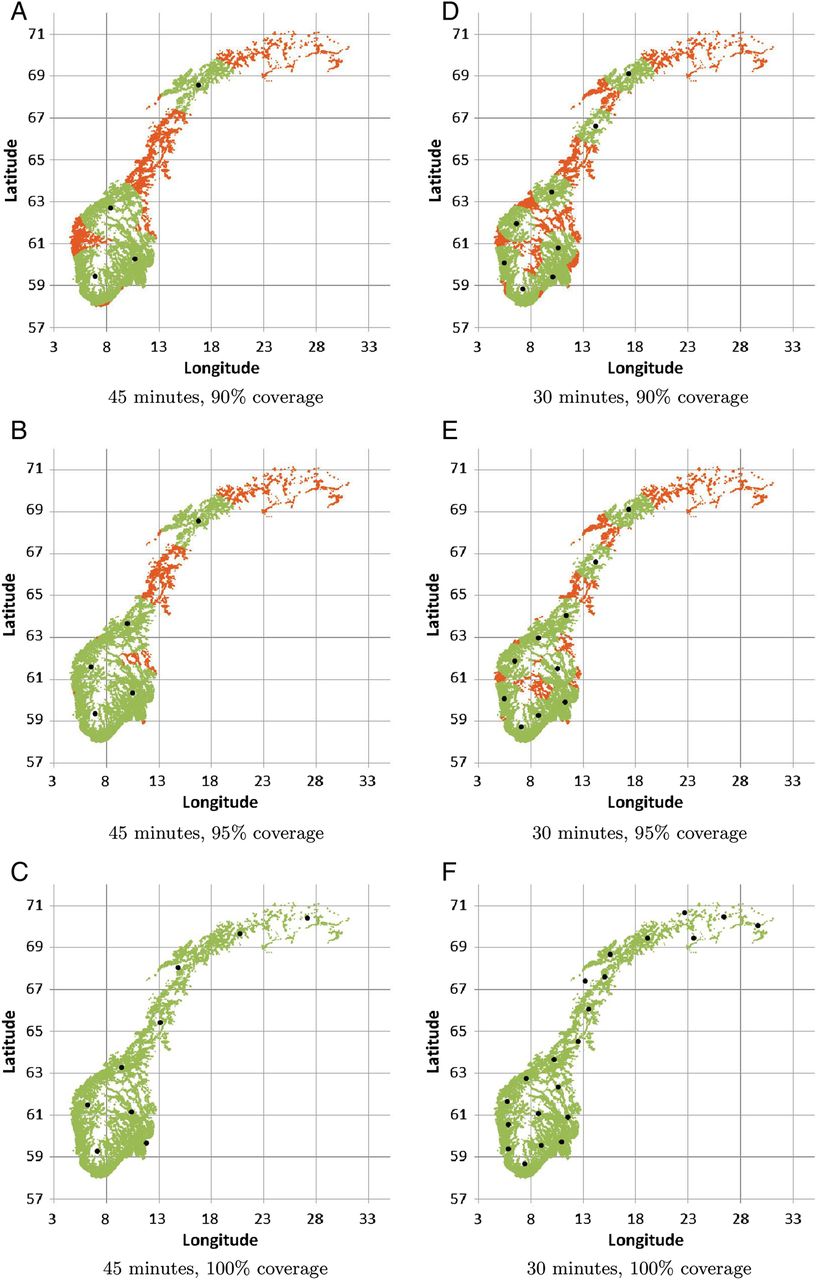
The relationship between the number of bases and coverage for various target times is shown in figure 2. With a threshold of 45 min, 90% of the population could be covered using four bases. With five optimally located bases, one could cover 95% of the population, and the whole population with nine bases. See figure 3A–C for the estimated base locations. Decreasing the threshold to 30 min substantially increases the number of bases needed to achieve the same coverage. One would need eight bases to cover 90% of the population, 10 to cover 95% of the population and 21 to cover the whole population. See figure 3D–F for the estimated base locations.

Percentage of population covered for increasing number of base locations for two different target times and fine grid and municipality level data in green field analyses.

Optimal base locations for covering (A) 90%, (B) 95% and (C) 100% of the Norwegian population with a 45 min threshold, and (D) 90%, (E) 95% and (F) 100% of the Norwegian population with a 30 min threshold, using fine grid data.
Optimal solutions for municipality level data
The relationship between the number of bases and coverage for various target times based on municipality level data is shown in figure 2. With a threshold of 45 min, 90% of the population could be covered using four bases. With five–six optimally located bases one could cover 95% of the population, and the whole population with 9–10 bases. Decreasing the threshold to 30 min substantially increases the number of bases needed to achieve the same coverage. One would need eight bases to cover 90% of the population, 10 to cover 95% of the population and 20 to cover the whole population. These results are largely similar to the estimates using the more precise fine grid information, both in terms of coverage numbers and estimated base locations (figures not shown).
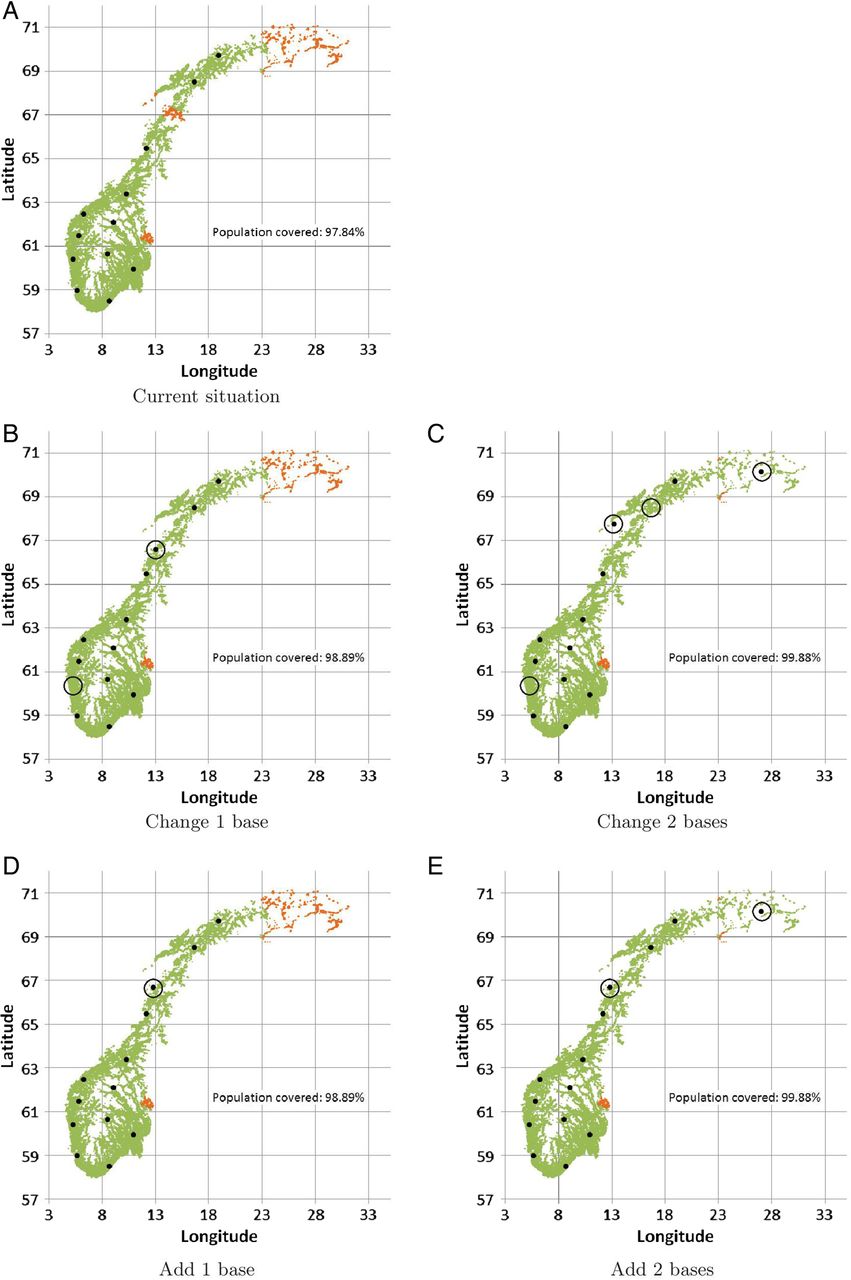
Optimisation conditioned on existing base structure
Using fine grid population data and a 45 min threshold, the 12 existing bases cover an estimated 97.84% of the population (figure 4A). The least contributive base is in the city of Bergen in Western Norway, and moving this base from its current location to south of the city Bodø in Northern Norway, would increase population coverage from 97.84% to 98.89% (figure 4B). Moving two bases, the Bergen and Evenes bases, would increase coverage further to 99.88% (figure 4C).
Coverage of existing base structure using fine grid population data and a 45 min threshold (A); moving one (B) or two (C) existing bases; adding one (D) or two (E) new bases.
Adding one base to the existing 12 results in adding a base close to where the Bergen base should optimally be moved, increasing coverage from 97.84% to 98.89% (figure 4D). Adding two bases would further increase coverage to 99.88% (figure 4E).
As with the optimal green field scenario, estimates based on municipality level data are largely similar to those using fine grid information (not shown).
Discussion
The mathematical analyses in this study indicate that given a clean slate the desired population coverage in Norway could be achieved with considerably fewer bases than there are today. This is as expected, as the current base structure was not designed using mathematical optimisation techniques, but through historical local engagement over the course of decades. The existing base structure does, however, appear to be markedly better than the political goal of covering 90% of the population within 45 min. And with a few select changes almost 100% of the population could potentially be reached within the desired 45 min threshold.
Notably this restructuring does not necessarily imply the need for building new bases, but could be achieved by using existing structures. The location of the two additional bases in Northern Norway suggested by the mathematical model is similar to the location of two existing Sea King bases. Sea King helicopters are larger helicopters primarily used for off shore rescue missions. The helicopters are also part of the official air ambulance system, and are thus also used for air ambulance missions. New and larger rescue helicopters (AW 101) will become operational from 2018, and replace the Sea Kings. Whether the new rescue helicopters are able to perform ordinary ambulance missions is unclear, and new ambulance helicopters might also be needed.21 Nonetheless, our mathematical analyses indicate that the two Sea King bases appear to fill a gap in the existing air ambulance base structure.
A wide range of emergency vehicle location models have been proposed,22 ,23 all with their different pros and cons, and future research should include method comparison studies of various modelling approaches. The mathematical model used in the present study is an idealised version of the problem under study, yet one with significant practical relevance. The model assumes that whenever there is need for a vehicle at a base station, there is always one available. In this sense, the model represents a best-case scenario. If a geographical location cannot be reached within the specified target time in the MCLP model, it never can. In practice, the assumption that an ambulance is always available at a base station whenever needed will not necessarily hold true, in particular in busy areas, that is, places with frequent injuries. Including a parameter for such a busy fraction could change the base locations.
With few bases, the chances a helicopter at a base is busy when called upon increases, further pointing to that the results from our model might be somewhat optimistic. Future analyses should explore the possibility of including suitable probability distributions of there actually being an available helicopter on the base. There are models for ambulance specific busy fractions, allowing for among others multiple vehicles at a station, as well as models for zone-specific busy fractions. Models that take the busy fraction into account include the maximum expected covering location problem,24 which maximises the weighted expected coverage of all demand locations while considering the probability that an emergency vehicle is available within the target response time, and in the maximum availability location problem.25 For a country like Norway, with large urban–rural differences, and population density varying strongly among municipalities across the country, the assumption that the busy fraction is similar for all demand zones is unrealistic, and zone-specific busy fractions should be applied. Defining a proper busy fraction is, however, not straightforward, and it is not evident that existing modelling approaches hold for large rural–urban difference geography. As there are several approaches to the busy fraction problem, and no existing model stands out as the obvious choice for the problem under study, method comparison studies are needed, exploring various models of increasing complexity, robustness of results and the sensitivity of solutions given choice of busy fraction model.
In the present model, ground services are not included. It is, however, not necessarily obvious that this would change helicopter base locations markedly. The anaesthesiologist staffed air ambulances represent the highest level of medical care that can be delivered outside of hospital of Norway, and are used only in the most severe cases. Often there is already a ground ambulance on site before the air ambulance arrives, but from a medical point of view this is less relevant, as the ground ambulance is not a replacement for the air ambulance service in terms of level of medical care. The air ambulance and the anaesthesiologists are called out whenever there is a need of fast transport to hospital or/and need of advanced treatment that exceeds what the crew on the ground ambulance can deliver. Every helicopter base also has a car available if more appropriate, for example, during bad weather. Also, anaesthesiologist staffed cars are applied in some high population density areas like Oslo. A car is often a more suitable means of transportation within city limits, and most areas are fairly close to a hospital, but a helicopter base is nonetheless located nearby.
In the present analyses, we have focused on population density; that a given percentage of the population should be reached within a given time threshold. While this is in line with official requirements, this might still be a suboptimal starting point for proper analysis, as this implicitly assumes that more incidents occur where more people reside. That is, that population density is a reasonable proxy for incidence density. This does not necessarily hold true. Using municipality data, it has been shown that incidence density and population density does not necessarily overlap.17 Norway covers a large geographical area with diverse nature and strong seasonal weather effects, and people tend to flock to the coast in the summer and to the mountains in the winter. Incidence density will thus not necessarily correlate perfectly with population density. Parts of the current base structure and base usage are related to these facts, and evaluating the base structure against postal addresses might be misleading.
Fine detail information on incidence locations is currently not available in Norway, but only exists on municipality level. In order to explore whether this might be problematic, we have in this study performed all analyses on both fine grid and municipality level population density data. Our results indicate that base location estimates based on the coarser municipality level data will give similar results as when using the more computationally heavy fine detail information. Collecting fine grid level incidence information thus appears not to be necessary.
Given the increasing evidence that time is of the essence in prehospital medical care,26–29 decreasing target time in a population might be both a political and medical goal for improved healthcare. Our analyses quantifies the possible practical consequences of such goals, demonstrating that decreasing the target time might result in a non-proportional increase in the number of bases needed to fulfil such a goal. Also, only minor changes to the existing base structure are needed in order to increase population coverage to almost 100%.
What is already known on the subject?
Air ambulance systems are an integral part of many healthcare systems. Base locations are central in order to achieve optimal population coverage in healthcare.
Existing bases are often located based on local historic engagement, but how to adjust an existing base structure in order to improve coverage is both complicated and largely unanswered.
What this study adds?
Mathematical models can aid in objective base location optimisation for increased population coverage.
While a larger proportion of the population might be covered using significantly fewer bases than the existing ones, assuming that clean slate was an option, minor adjustments to an existing base structure can increase population coverage.
Some bases contribute marginally to the population coverage and could be removed completely.
Coroner warns about garden ponds
After a 19-month-old child in the UK died in a garden pond, the coroner judged it was ‘death by accident’ because ‘No one was to blame’. He added that ‘the parents and grandparents did everything they could’. Nevertheless, a spokesperson for the Child Accident Prevention Trust wisely suggested that parents should fill in garden ponds, cover them or fence them off.
Acknowledgments
The authors would like to thank Even Høydahl at Statistics Norway for invaluable help in extracting data and accompanying discussions.
References
Footnotes
Twitter Follow Jo Røislien at @joroislien
Contributors JR defined the study hypothesis, acquired the data and drafted the manuscript. PLvdB and JTvE performed the mathematical analyses. All authors contributed to the discussions about the topic, revision of the manuscript and to the final approval of the manuscript.
Competing interests None declared.
Provenance and peer review Not commissioned; externally peer reviewed.