
Abstract
 composite powder has been synthesized via spray pyrolysis of cobalt nitrate-sugar solution at
  and assessed for application as anode materials in Li-ion batteries. Microstructural characterization by scanning electron microscopy, transmission electron microscopy, and energy-dispersive X-ray spectroscopy confirm an even distribution of carbon throughout particles, as well as the presence of a carbon-based surface sheath surrounding
  particle agglomerates. Charge-discharge cycling of half-cells indicates a stable reversible discharge capacity above
  . Equivalent circuit modeling of Nyquist plots show the
  electrode has significant kinetic advantages over non-composite transition metal oxide electrodes.
Export citation and abstract BibTeX RIS
Poizot et al.1 first reported that electrodes made of nanosized transition metal oxide (MO) particles ( ,
,  ,
,  ,
,  ,
,  , and
, and  ) exhibit reversible capacities up to three times higher than electrodes composed of graphite. The most interesting aspect of this result is that these transition metal oxides do not display the classical hallmarks that have often been used by researchers to identify suitable Li-ion battery materials (i.e., reversible alloying with lithium or the existence of an open crystal framework). Rather, the reaction of these materials with
  involves the thermodynamically unlikely reversible formation and decomposition of
  .2–7 Impetus for this reaction occurs through the formation of highly electrochemically reactive metal nanoparticles during cell discharge

From all of the transition metal oxides studied, the  system offers particular promise due to a reported reversible capacity in excess of
  .8 Unfortunately, the practical usage of
  cells in Li-ion batteries has been frustrated by capacity fade and a poor cycle life.9, 10 Part of these problems may be attributed to significant volume changes that occur during lithium uptake and removal (molar volume change ∼100%) which may result in a loss of electrical contact and electrode failure. This situation is analogous to that found in tin-based oxides and alloys that also suffer significant volume changes.11 Another important factor identified as influencing the cyclability of the
  electrode is the nature and electrochemical behavior of the solid electrolyte interphase (SEI). The SEI begins forming in the first discharge (reduction of MO) as a result of secondary reduction reactions within the electrolyte and has the appearance of a "polymer-like" gel.6 Subsequent charging of the cell will often cause a partial dissolution of the SEI. The exact composition of the SEI obviously varies between systems and electrolytes, but the film is mildly conducting and is composed primarily of lithium-based carbonates and alkylcarbonates. This SEI formation-dissolution phenomenon that is caused by discharge-charge cycling of the cell is particularly influenced by the powder texture (crystallite and particle size, surface area, and surface composition) for each MO system. If precursor powders are too small, the SEI formation process dominates and cycle life of the cell is reduced. Specifically, smaller precursor MO powder particles will form more surface active metal nanoparticles during discharge, which are then available for catalytic reduction of the electrolyte and hence SEI formation. For example, work on nanosized
  precursor powders has shown that rapid SEI thickening caused by enhanced electrolyte degradation can occur to a point where Li transfer is significantly impeded and capacity fades.12 Alternatively, work on
  cells that use larger microsized precursor MO powder have accredited an excellent capacity retention to the active formation-dissolution of the SEI.2 Therefore, it is feasible that the SEI may be indirectly engineered by careful selection of the above characteristics to improve the cyclability of the transition MO electrode.
There has been a large amount of fundamental studies on the electrochemical performance of transition MOs that have focused on reaction mechanisms,1, 2, 13 the development of possible intermediate phases,14, 15 and the effect of particle size on electrochemical performance.14 However, to enhance the commercial viability of these materials and their application to large scale technology such as electric vehicles, practical improvements must be made in terms of capacity retention and cycle life. To this end, we have synthesized  –carbon (referred to as
  hereafter) composite powders by chemical spray pyrolysis using common sugar (sucrose) as a carbon source. Sucrose is an attractive precursor to synthesize carbon because it is cheap, abundant, and has a high chemical purity. It has been shown that the confinement of MO clusters in a disordered carbon matrix can preserve electrical contact and cushion internal stresses, thereby leading to improved cycle life in a Li-ion cell.16, 17
Experimental
Composite preparation
Nanostructured  ,
,  , and
, and  powders were prepared in separate experiments using a vertical spray pyrolysis apparatus as described in our previous work.18, 19 The
  and
and  powders were obtained by spraying aqueous
  cobalt or nickel nitrate solutions at ambient temperature through an ultrasonic nozzle at
  into an open air
  quartz tube at
  . For preparation of the
  powder, the precursor solution contained
  sucrose and
  cobalt nitrate. The experimental conditions for pyrolysis of this solution were identical to those described for
  and
and  powders. All final powder products were confirmed by X-ray diffraction (XRD) to be reacted and usable as-received, however powders were dried overnight at
  in a vacuum oven to evaporate excess moisture prior to electrochemical testing.
Characterization
Analysis of the composition and crystal structure of the powders was conducted using a Philips PW1730 X-ray diffractometer with monochromatized  radiation
  at a scan rate of
  . The carbon content of the product
  powder was analyzed by thermogravimetric (TG) method performed in static air on a Setaram 92 differential thermal analysis (DTA) apparatus at
  . An estimate of the crystallite sizes was calculated using the Scherrer equation:
  , where λ represents the X-ray wavelength, β is the observed full width at half-maximum (fwhm), and
  is the Bragg angle.20 The morphology of the powders was observed by a JEOL JSM-6460A scanning electron microscope (SEM) and JEOL 2010 transmission electron microscope (TEM). The results obtained from TG experiment on
  powder were compared to the carbon content calculated using an energy dispersive X-ray spectroscopy (EDXS) instrument attached to the abovementioned SEM. The specific surface area of the powders was calculated using the Brunauer, Emmett, Teller (BET) multipoint method with
  adsorbate at
  using a Quantachrome Nova 1000 Autosorb-1 gas sorption system.21 Powders were weighed, placed in a
  chamber, and outgassed at
  under inert gas flow for
  prior to measurement. Particle size distributions were determined using a Malvern Instruments Mastersizer.
Electrochemical assessment
Electrochemical measurements were conducted by assembly of standard R2032 type coin cells. In the case of  and
and  powders, working electrodes were constructed by mixing
  active powder,
  carbon black (Lexel, 99%), and
  polyvinylidene fluoride (Aldrich, 99%) in a mortar and pestle. For the
  powder,
  of active material was used with the remaining
  made up of polyvinylidene fluoride binder. The dry powder mix was blended with N-methylpyrrolidinone to make a slurry, which was then spread uniformly on
  by
by  thick copper foil (99.99%) substrate. The electrodes were dried in a vacuum oven for
  at
at  then cold pressed at
  in a uniaxial hydraulic press. All electrodes contained no more than
  of active material and were assembled into a test coin cell in a high purity argon-filled glove box (Mbraun, Unilab, USA) where the concentration of
  and
and  . Battery grade lithium foil was used as both the counter and reference electrodes.
  2400 was used as a separator membrane soaked in
 dissolved in a 1:1 (vol:vol) mixture of ethylene carbonate (EC) and dimethyl carbonate (DMC) electrolyte (Merck KgaA, Germany). Charge-discharge cycles of the half-cells were measured between 0.02 and
  vs lithium at the C/30 rate using a Neware battery cycler in galvanostatic mode. Specific capacity was calculated based on the mass of active material in the electrode and all electrochemical testing was carried out at ambient temperature
  . Electrochemical impedance spectroscopy (EIS) measurements were conducted using a CH Instruments electrochemical workstation (CHI 660A). The impedance spectra were recorded potentiostatically by applying an ac voltage of
  at various open-circuit voltages (OCVs) on the tenth discharge. Simulation of impedance spectra with an equivalent circuit was performed over identical frequency range using Zview computer software (Version 2.8, Scribner Associates, USA). The program fits the parameters of the equivalent circuit of each of the electrodes using the complex nonlinear least squares (CNLS) method, which provides simultaneous fits for each parameter. Note that the electrodes used for the impedance analysis had a uniform film thickness in the
  range to allow a valid comparison of impedance values.
Results and Discussion
Figure 1 shows the XRD patterns for the sprayed  ,
,  , and
, and  powders. The diffraction patterns seen in Fig. 1a are indexed to the cubic
  phase with
  space group (JPDD ICDD reference 65-3103). Crystallite sizes for the
  and
and  powders were calculated using the Scherrer equation at 10.2 and 12.0 nm, respectively. The swollen nature of the
  graph at low scattering angle
  is indicative of disordered carbon.22, 23 The diffraction pattern in Fig. 1b shows Bragg reflections indexed according to pure phase
  bunsenite compound with cubic crystal structure and
  space group (JPDD ICDD reference 01-1239). The broadened nature of the three main diffraction peaks at 37.4, 43.5, and 62.6° [(111), (200), and (220) reflections, respectively] suggests that the powder has a nanocrystalline morphology, which is confirmed by a calculated crystallite size of
  . Dark field TEM analysis (data not shown) supports that the crystallite sizes for all powders are of the magnitude calculated empirically.
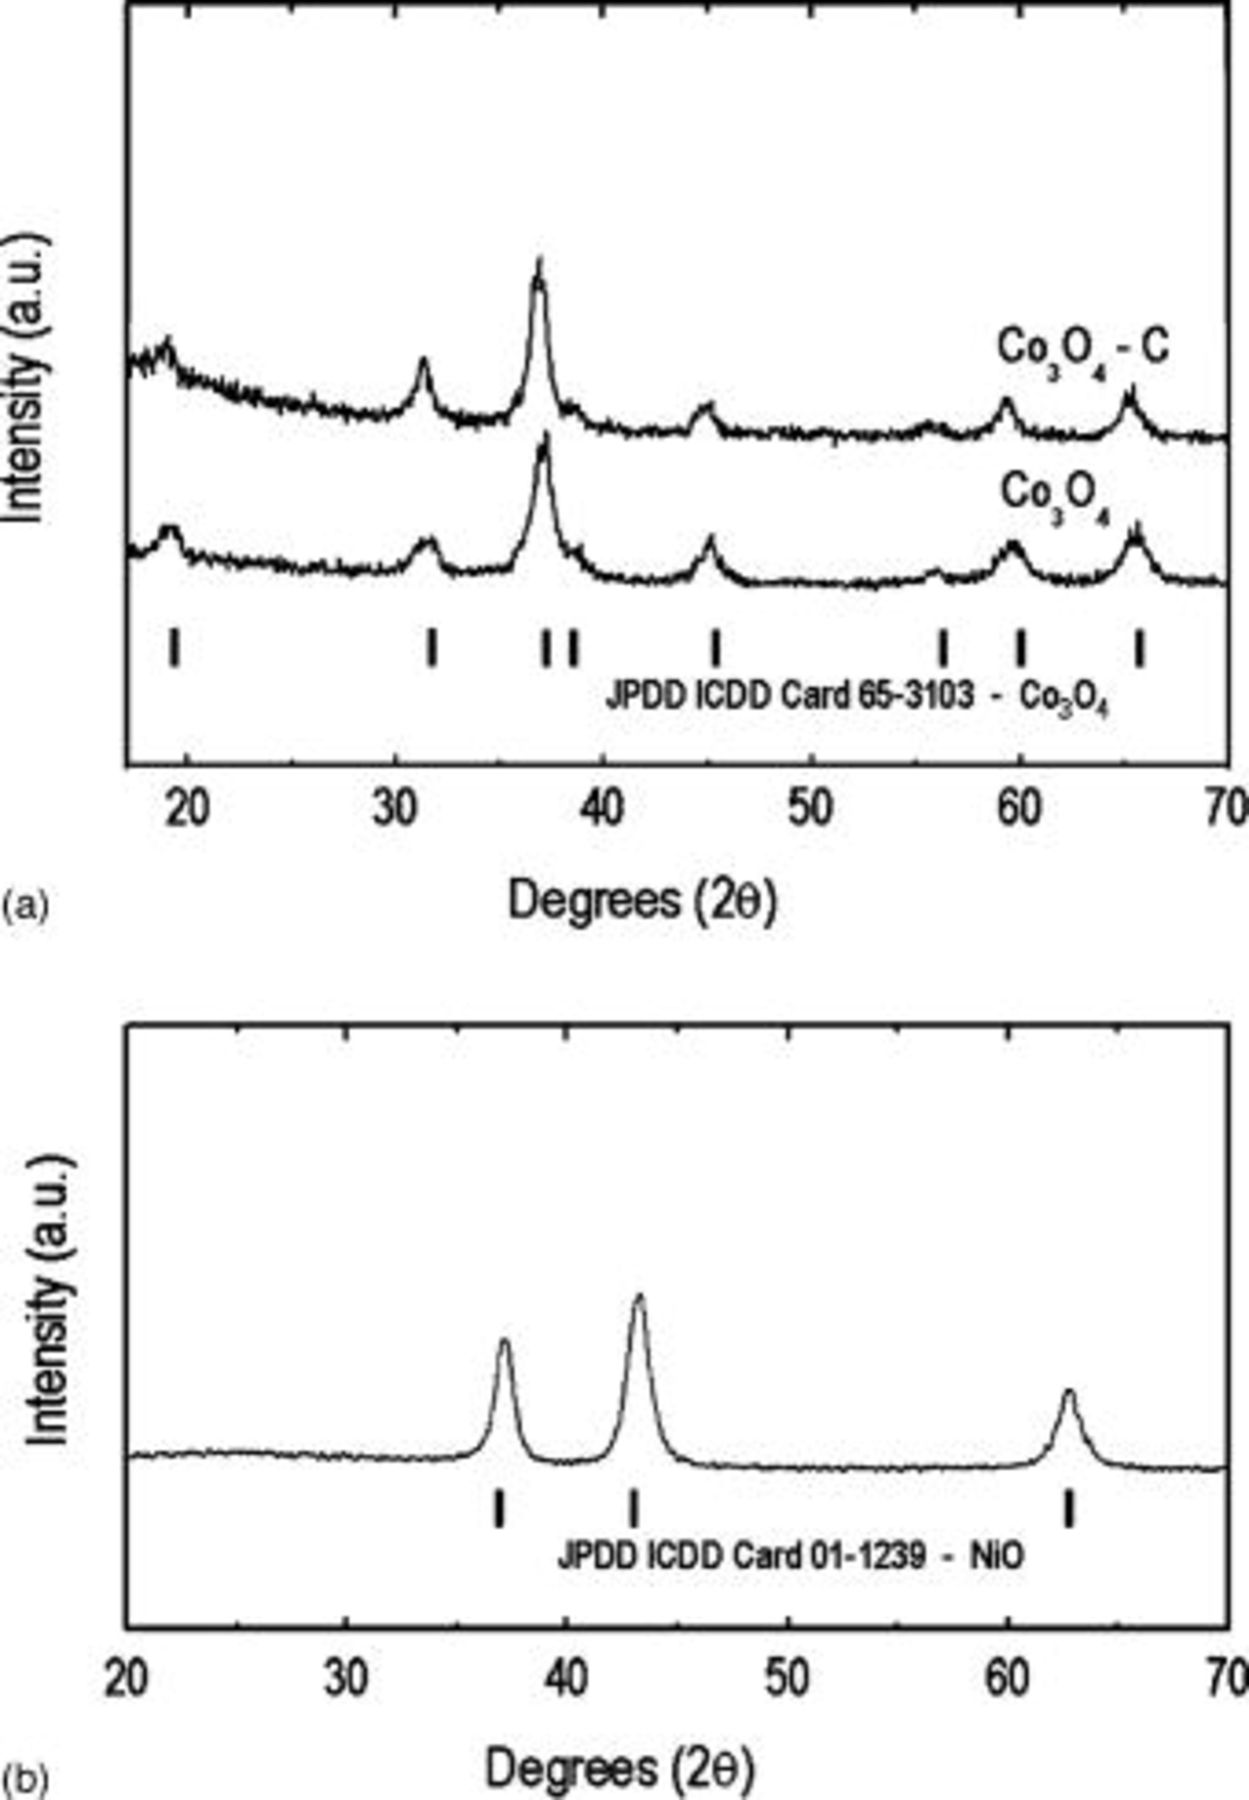
Figure 1. XRD patterns of (a)  ,
,  and (b)
  powders.
The actual quantity of carbon in the  composite powder was calculated by TG analysis at
  and EDXS area analysis at
  . The close agreement of these values confirms that the C content of the composite to be in the
  range. It is expected that a large fraction of the carbon in the precursor solution was also lost to the atmosphere as
  during pyrolysis, and can be explained by considering the behavior of sucrose upon heating. When sucrose is hydrolyzed, it first decomposes into its two smaller monosaccharide isostructural constituents, namely, glucose and fructose (Reaction 2).24 Slow heating initiates a series of up to 25 sequential reactions occur whereby different classes of compounds are formed including aldehydes, ketones, carboxylic acids.25 However, regardless of heating rate there are two main exothermic reactions of decomposition that occur before
  and involve the formation of large quantities of
  ,
,  (Reaction 3), and carbon (Reaction 4)


Figure 2 shows SEM and TEM images of the as-prepared  powder at different magnifications. Figure 2a shows a low magnification SEM of the morphology of the
  powder. The majority of particles measure less than
  and consist of a mixture of partially and fully developed hollow spheres, with the average wall thickness of
  . EDXS analysis indicates that carbon is evenly distributed across the surface of
  particles and also throughout the wall thickness. The TEM image in Fig. 2b shows that each particle visible in Fig. 2a is actually an agglomeration of sub-micrometer
  particles coated in a thin C-rich sheath, with the composition of the surface layer being confirmed by selected area electron diffraction (SAED). It is thought that this type of morphology may form as a result of the highly reactive particles coalescing within the reaction chamber, moments after being sprayed. The thickness of the C sheath is
  and can be seen in Fig. 2c coating grains containing a fine distribution of disordered carbon (black spots
  ) and domains of crystalline
  .
.
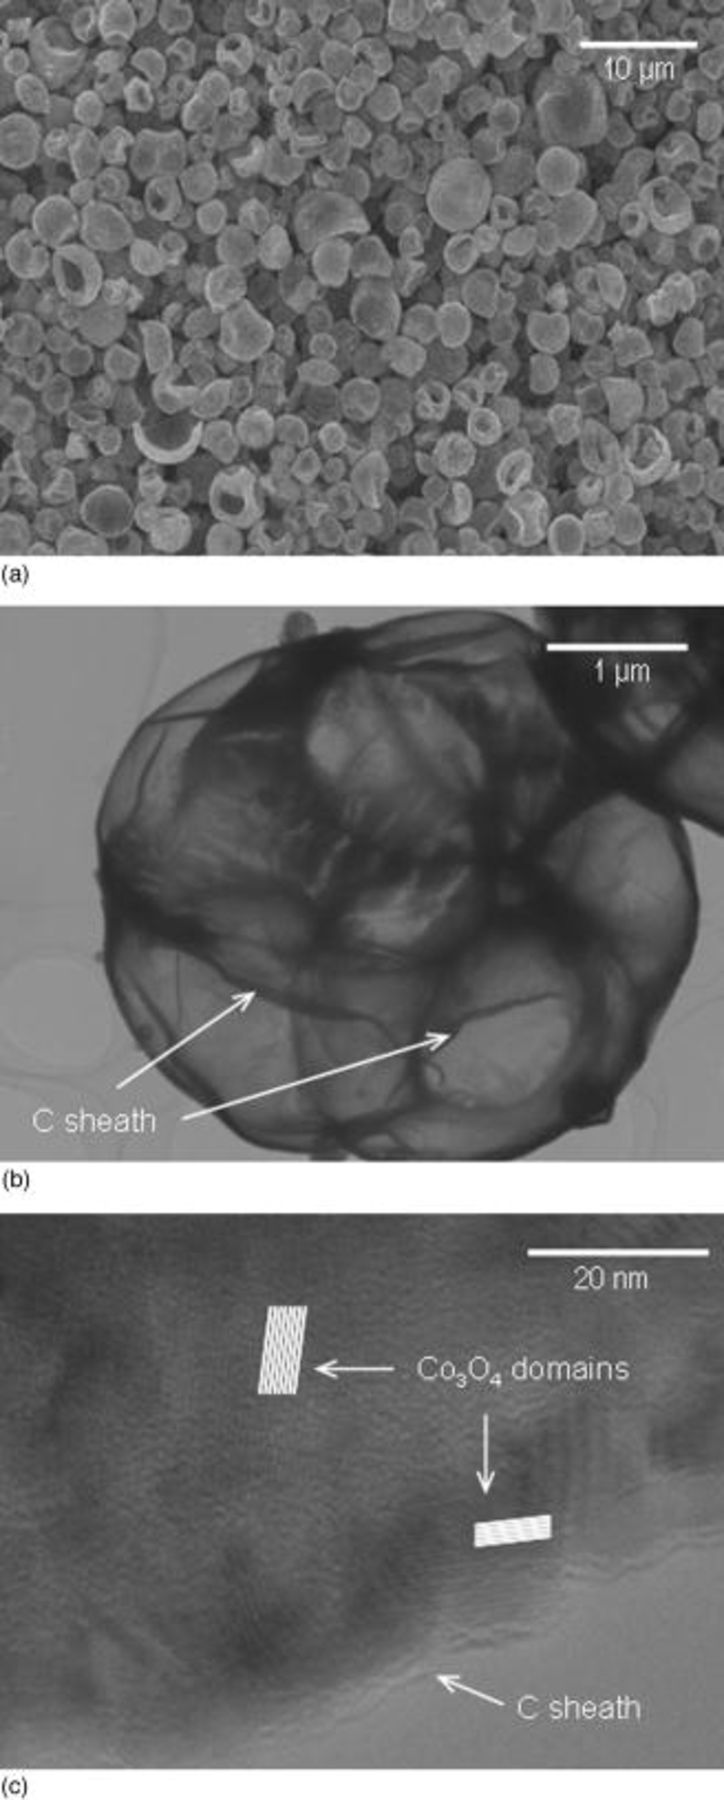
Figure 2. Images of  powder showing (a) a low magnification SEM view, (b) TEM of the nanoporous carbon sheath coated on a
  particle, (c) and a TEM image of finely distributed disordered C and crystalline
  domains within an individual particle.
Figure 3 shows the particle size distribution and BET surface areas of  ,
,  , and
, and  powders. All powders show a narrow Gaussian distribution from 2 to
  that supports SEM observations. The surface area of powders in decreasing order was
 ,
, 
 , and
, and 
 . The higher surface area measured in
  is explained by the additional gases given off during processing that have resulted in an aerated powder product. Small angle X-ray scattering (SAX) experiments conducted in other works26 have indicated that pyrolyzed carbons contain a mix of open and closed nanopores that can significantly increase the powder surface area. In these studies, a maximum surface area was achieved at spray temperatures
  , which corresponds well with the processing temperature used in our present study. From an electrochemical performance viewpoint, the higher surface area measured in
  powder implies that more electrolyte could be exposed to the particle surface. It is well documented that although this may produce initial improvements in the cell capacity, the electrode capacity can rapidly fade upon cycling due to the accelerated degradation of the electrolyte and concomitant formation of a thick SEI layer that surrounds active particles.3, 12 However, as seen in Fig. 4, the
  electrode demonstrated superior electrochemical performance compared to
  and
and  electrodes. In Fig. 4a, the
  electrode maintains a capacity
  for 50 cycles, whereas
  and
and  electrodes show a steady decay to 300 and
  respectively. Indeed, the
  electrode also demonstrates better capacity retention than
  electrodes that were prepared by thermal decomposition of a cobalt octacarbonyl compound and reported by our group elsewhere.9, 10 The first and fiftieth cycle discharge curves for electrodes made from
  ,
,  , and
, and  powders is shown in Fig. 4b. Here we see the voltage plateaus that were present for the noncomposite
  (at
(at  ) and
) and  (at
(at  ) during the first cycle, almost disappear in the fiftiethth cycle. Conversely for the
  electrode, the voltage plateau that was responsible for the high capacity achieved in early cycling is preserved in the fiftieth cycle. We believe that part of the reason for the improved cyclability may be attributed to carbon coating on the surface of
  crystals. We expect that this coating could simultaneously shield electrolytes from advanced decomposition caused by exposure to Co nanoparticles, enhance the overall electronic conductivity of the electrode, and also provide a cushion effect to accommodate volume expansion and contraction during discharge-charge cycling.11 Furthermore, any volume changes upon cycling may also be partially accommodated by the fine distribution of disordered carbon present throughout the bulk powder.
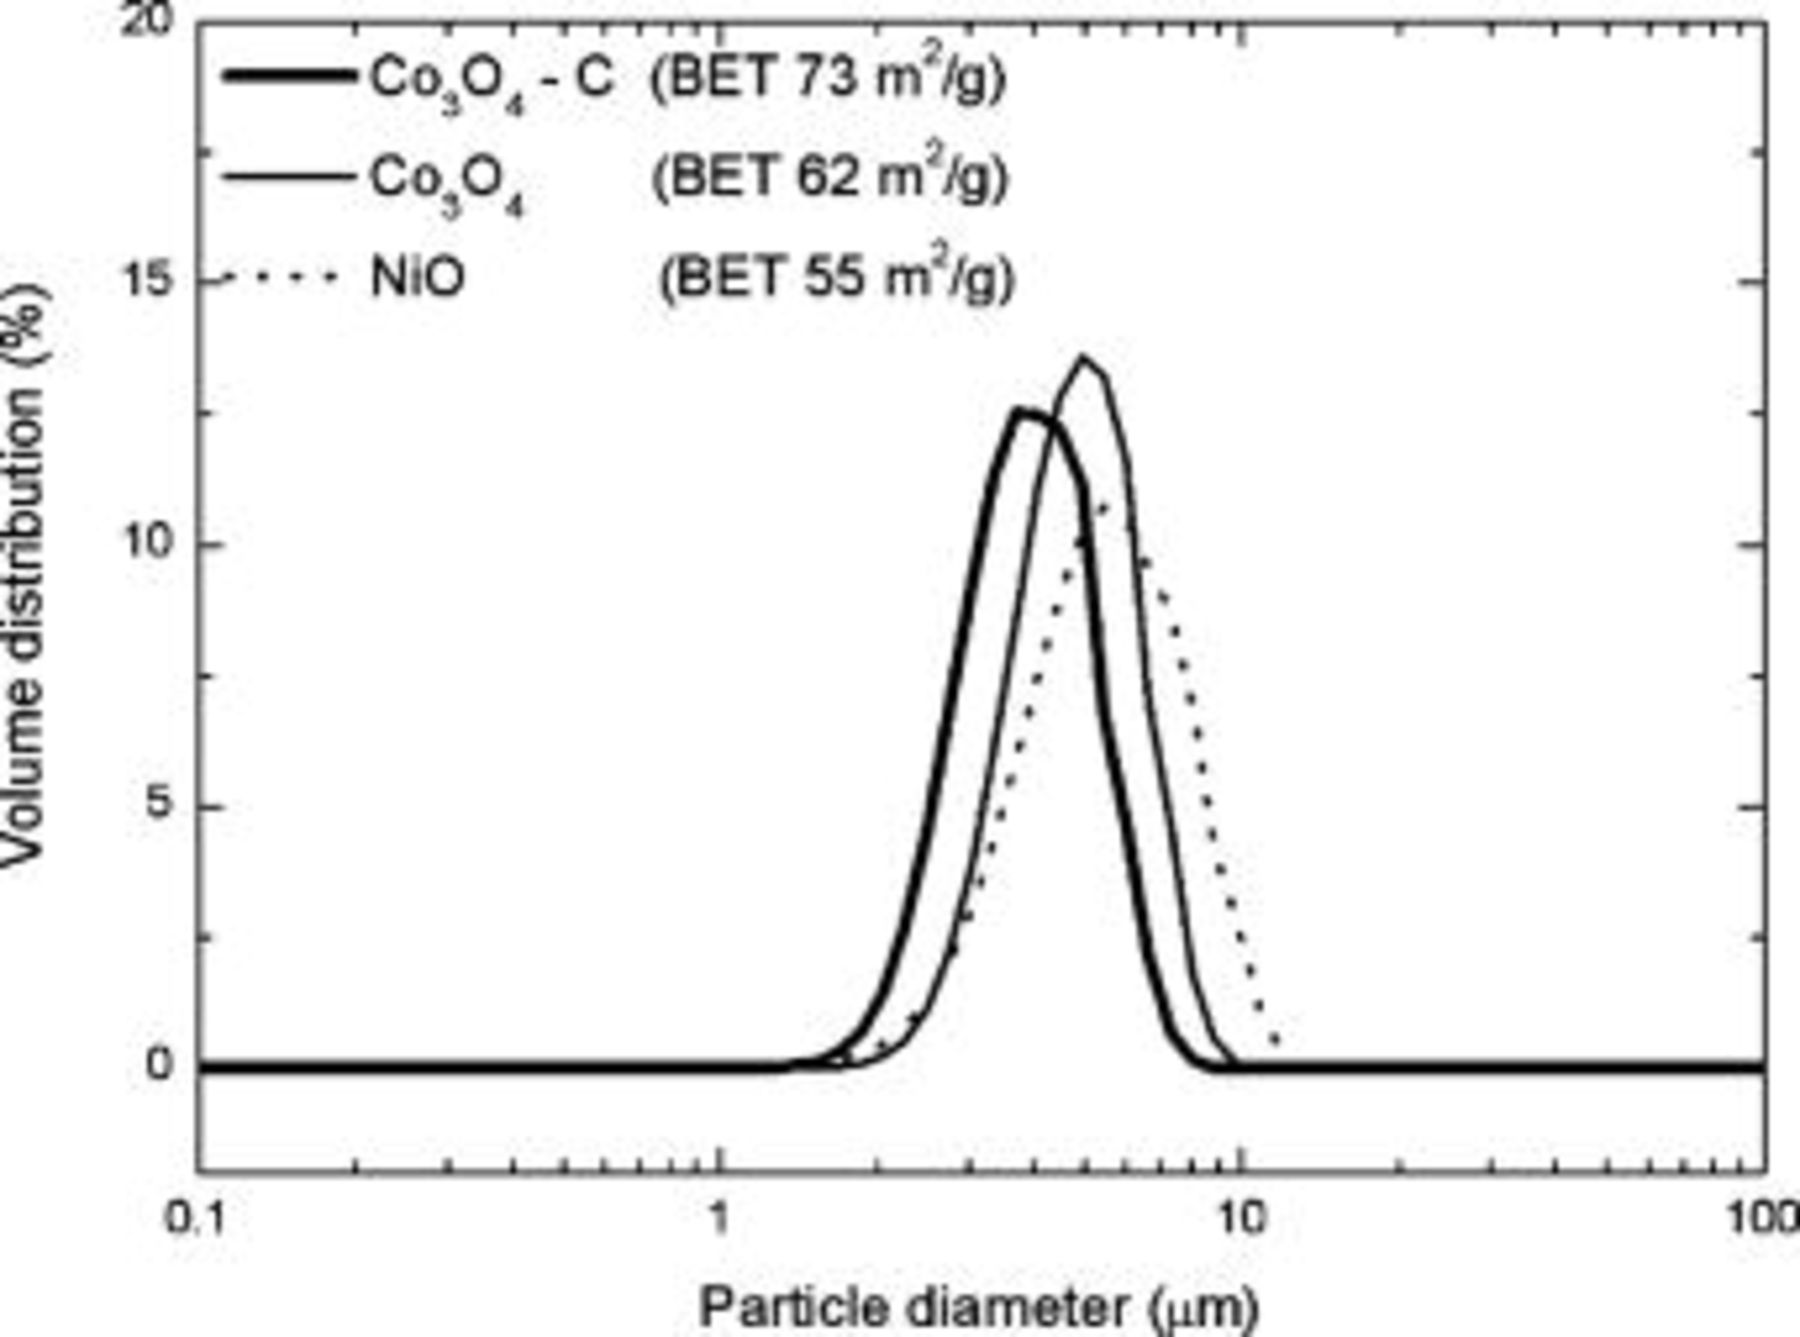
Figure 3. Particle size distribution and BET specific surface areas of  ,
,  , and
, and  powders.
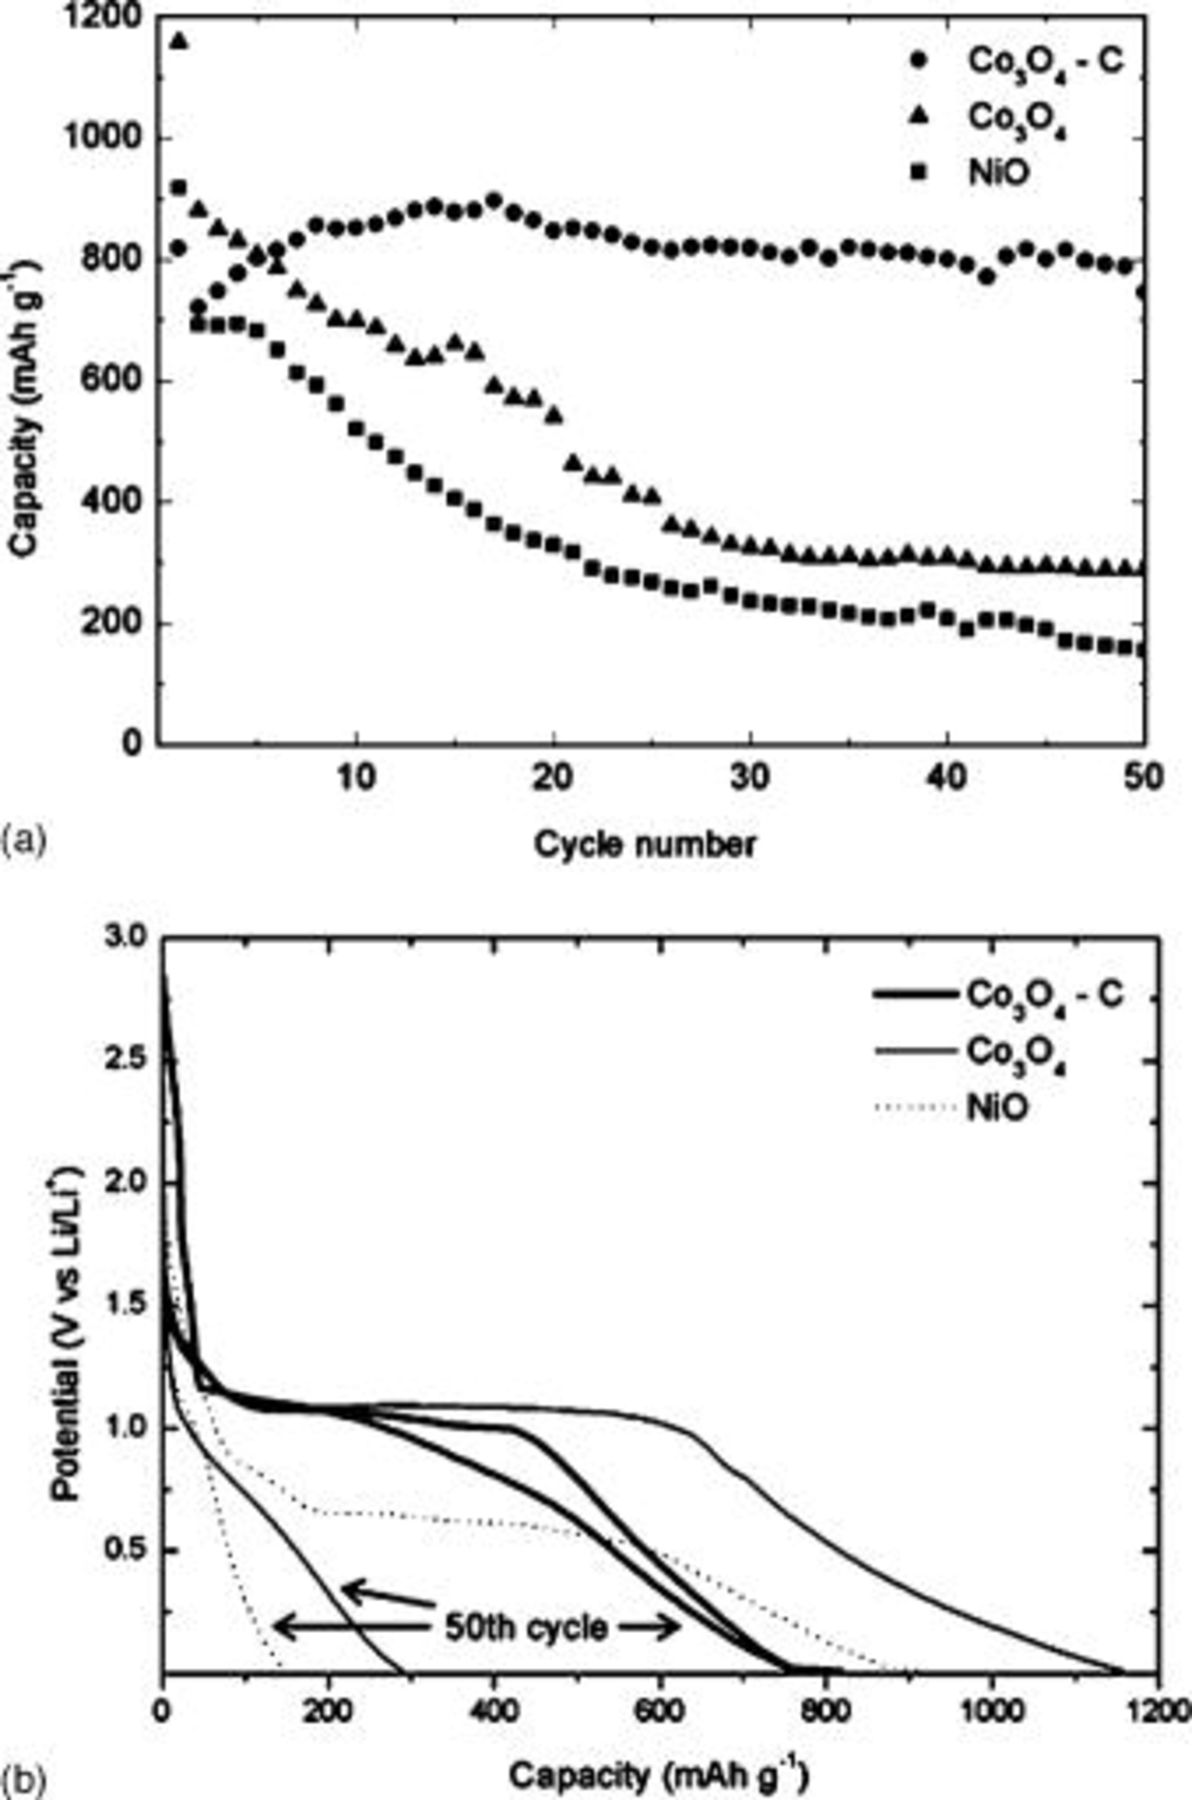
Figure 4. Comparison of electrochemical performance for  ,
,  , and
, and  electrodes showing discharge capacity over (a) 50 cycles and the (b) first and fiftieth cycle discharge curves.
EIS was used to further elucidate the nature of the cyclability improvement demonstrated in the  electrode, by collecting Nyquist plots at various predetermined voltages (2.0, 1.6, 1.2, 1.0, 0.8, 0.4, and
  ) on the tenth discharge cycle. Impedance spectra were recorded by applying an ac voltage of
  amplitude over the frequency range
  to
to  , after a
  rest at each potential to attain equilibrium. EIS is a powerful technique for Li-ion electrode kinetic analysis due to the information that can be deduced for each reaction process; concerning that of the electrolyte, passivation layer(s), charge transfer, and
  diffusion. The impedance spectra on 10th discharge for
  and
and  electrodes at various OCV are presented in Fig. 5. For all measurements, the overall shape of Nyquist plots show the characteristic depressed semicircle in the high and middle-frequency range and an extended tail at
  to the
  axis. The semicircle is often considered to be the superposition of two individual semicircles, even though the exact separation of these is not well developed in our case. Usually, a small, high-frequency semicircle is identified that corresponds to the formation of a passivated film (SEI) and creates impedance at the surface of the working electrode particles in contact with the organic electrolyte.27–29 The resistance
  and capacitance
  values associated with the migration of
  through the SEI are described by Eq. 5, 6
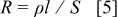

where  is the electrode surface area and
  is the thickness, ρ is the resistivity, and
  the permittivity of the SEI layer.30 However, because only one semicircle is distinguishable, the exact contribution to impedance of this component is difficult to quantify.31 The semicircle that dominates at intermediate frequency represents the charge transfer impedance
  through the electrode–electrolyte interface, and is considered to account for a large proportion of the overall kinetic impedance of the cell. From Fig. 5a and 5b, the size of this semicircle in both electrodes reduced considerably at voltages lower than
  since the primary reaction plateau for
  occurs at just below this value. The sloping line at
  to the
  axis found at low frequency is known as Warburg impedance and is representative of diffusion of
  within the bulk anode.32 The high frequency intercept at the
  axis corresponds primarily to the electrolyte resistance
  , however small contributions may exist from the wire resistance of the system and solid-solid contact.
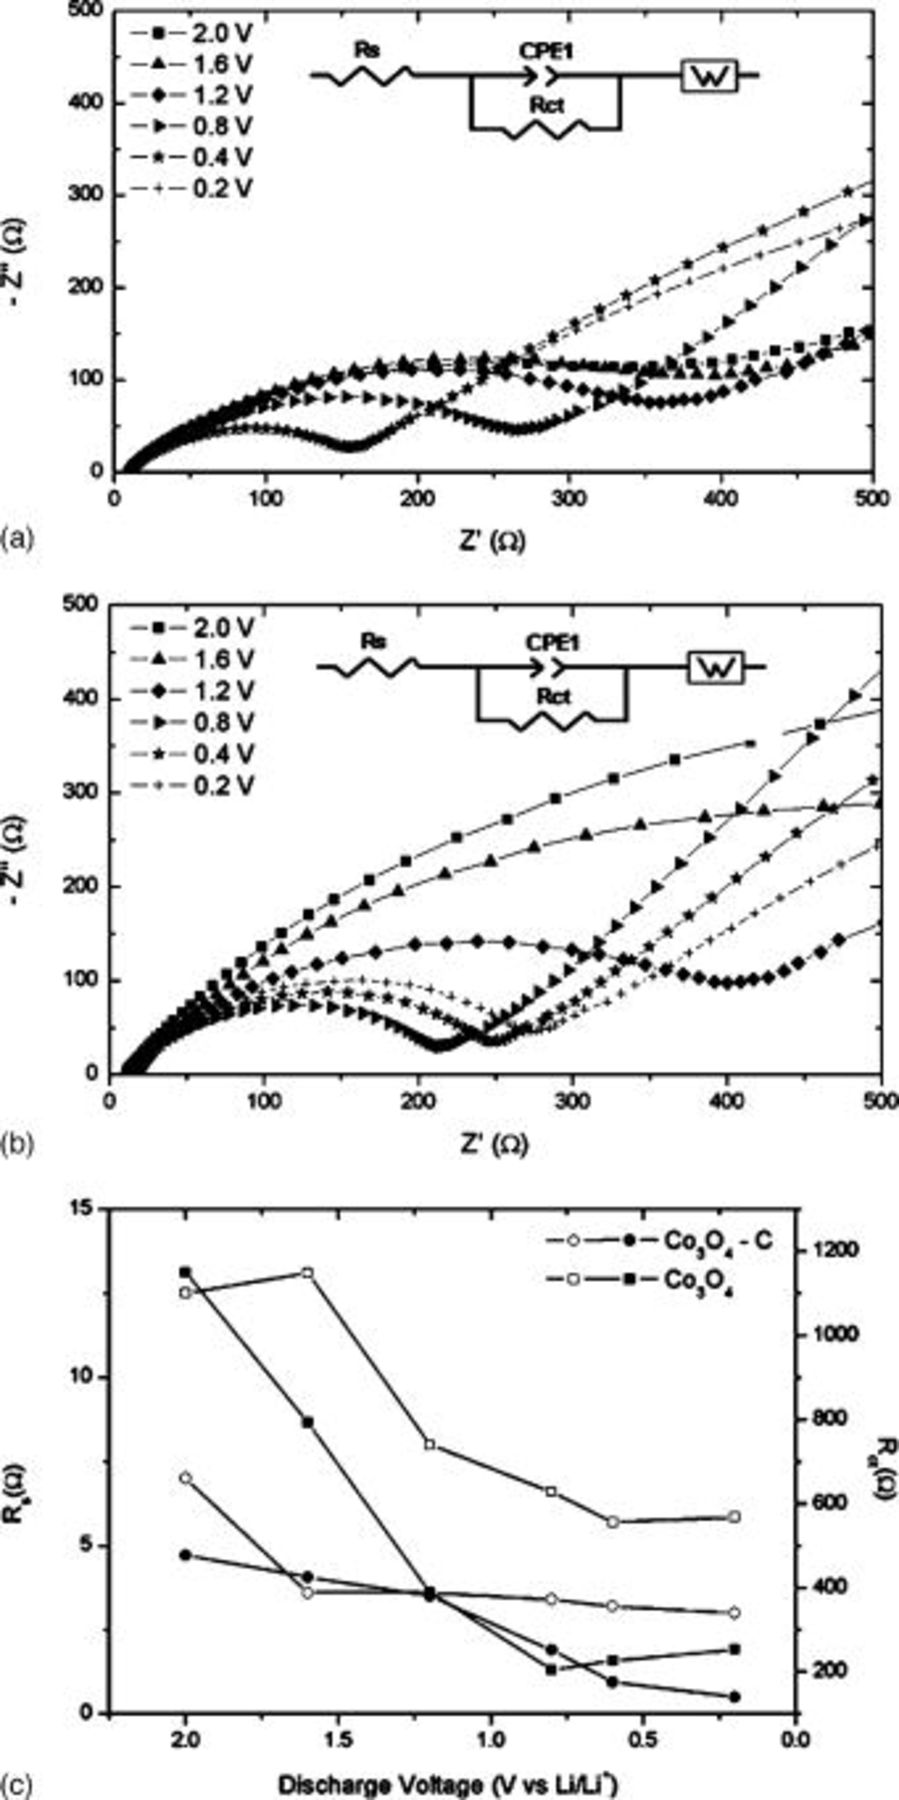
Figure 5. Nyquist plots of (a)  and (b)
  electrodes and (c) scatter plots of various equivalent circuit parameters vs discharge voltage.
  is represented by open symbols and
  by closed symbols.
To obtain quantitative results, an equivalent circuit (insets of Fig. 5a and 5b) was used to fit the Nyquist plots where  =solution resistance,
  =charge transfer resistance, and W is the
  diffusion resistance. A constant phase element
  was used to account for the complexity of the double layer effect associated with charge transfer resistance. The fit result parameters are summarized in Fig. 5c where we see
  values for the
  electrode are lower than those of the
  electrode. The values of
  at various potentials also show the same trend, except at 0.8 and
  where the values are similar. We attribute the generally lower trend of values of
  and
and  for the
  electrode to the improvement of electronic conductivity due to the formation of a disordered carbon sheath. Moreover, the sheath that coats
  crystals in the
  composite could also induce the formation of a high quality stable SEI layer, thereby contributing to the excellent cycling performance.27
Conclusions
We have produced nanocrystalline  composite powder by spray pyrolysis technique that has a narrow Gaussian type particle size distribution
  and high specific surface area
  . Preliminary electrochemical testing of
  electrodes indicates a high reversible capacity of
  , whereas the noncomposite
  and
and  electrodes show a steady decay upon cycling to less than 40% of their original capacity. By synthesizing
  powders we have overcome rapid capacity fade often associated with finely divided
  powder. The formation of a C sheath on the particle surface can potentially shield the catalytic action of the Co nanoparticles on electrolyte reduction and the retard development of a thick SEI that can impede charge transfer. In addition, we expect that the disordered C matrix throughout the bulk powder and the carbon sheath assist to cushion the volume expansion associated with the reversible formation of Co nanoparticles. It can be assumed that these results are not limited to the
  system but also to other promising transition MO–C composite powders.
Acknowledgments
The authors acknowledge financial support provided by the Australian Research Council (ARC) through ARC linkage project LP0453766 and the Centre of Excellence program.
The University of Wollongong assisted in meeting the publication costs of this article.